Spoiler Alert: The Universe Is Weird
How Do We Know What We Know?
January 20, 2026
Join iClicker

If you can’t scan: open the link and enter the course code ASES.
Most of Those Weren’t Stars
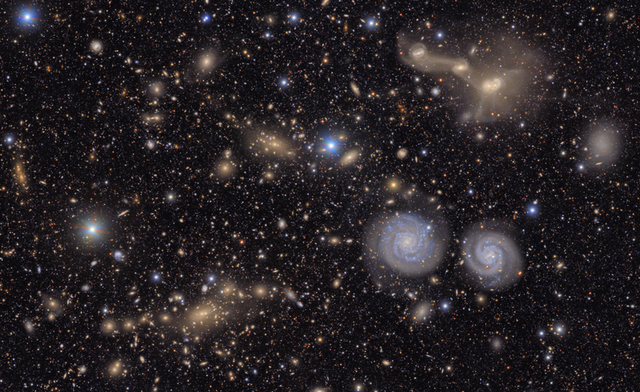
When you look up, you see stars, planets, maybe a galaxy or two…
But most of those points of light? Galaxies.
Each one containing hundreds of billions of stars.
You just saw millions of galaxies — and that’s only a tiny fraction of what one telescope will find.
NASA’s Three Big Questions
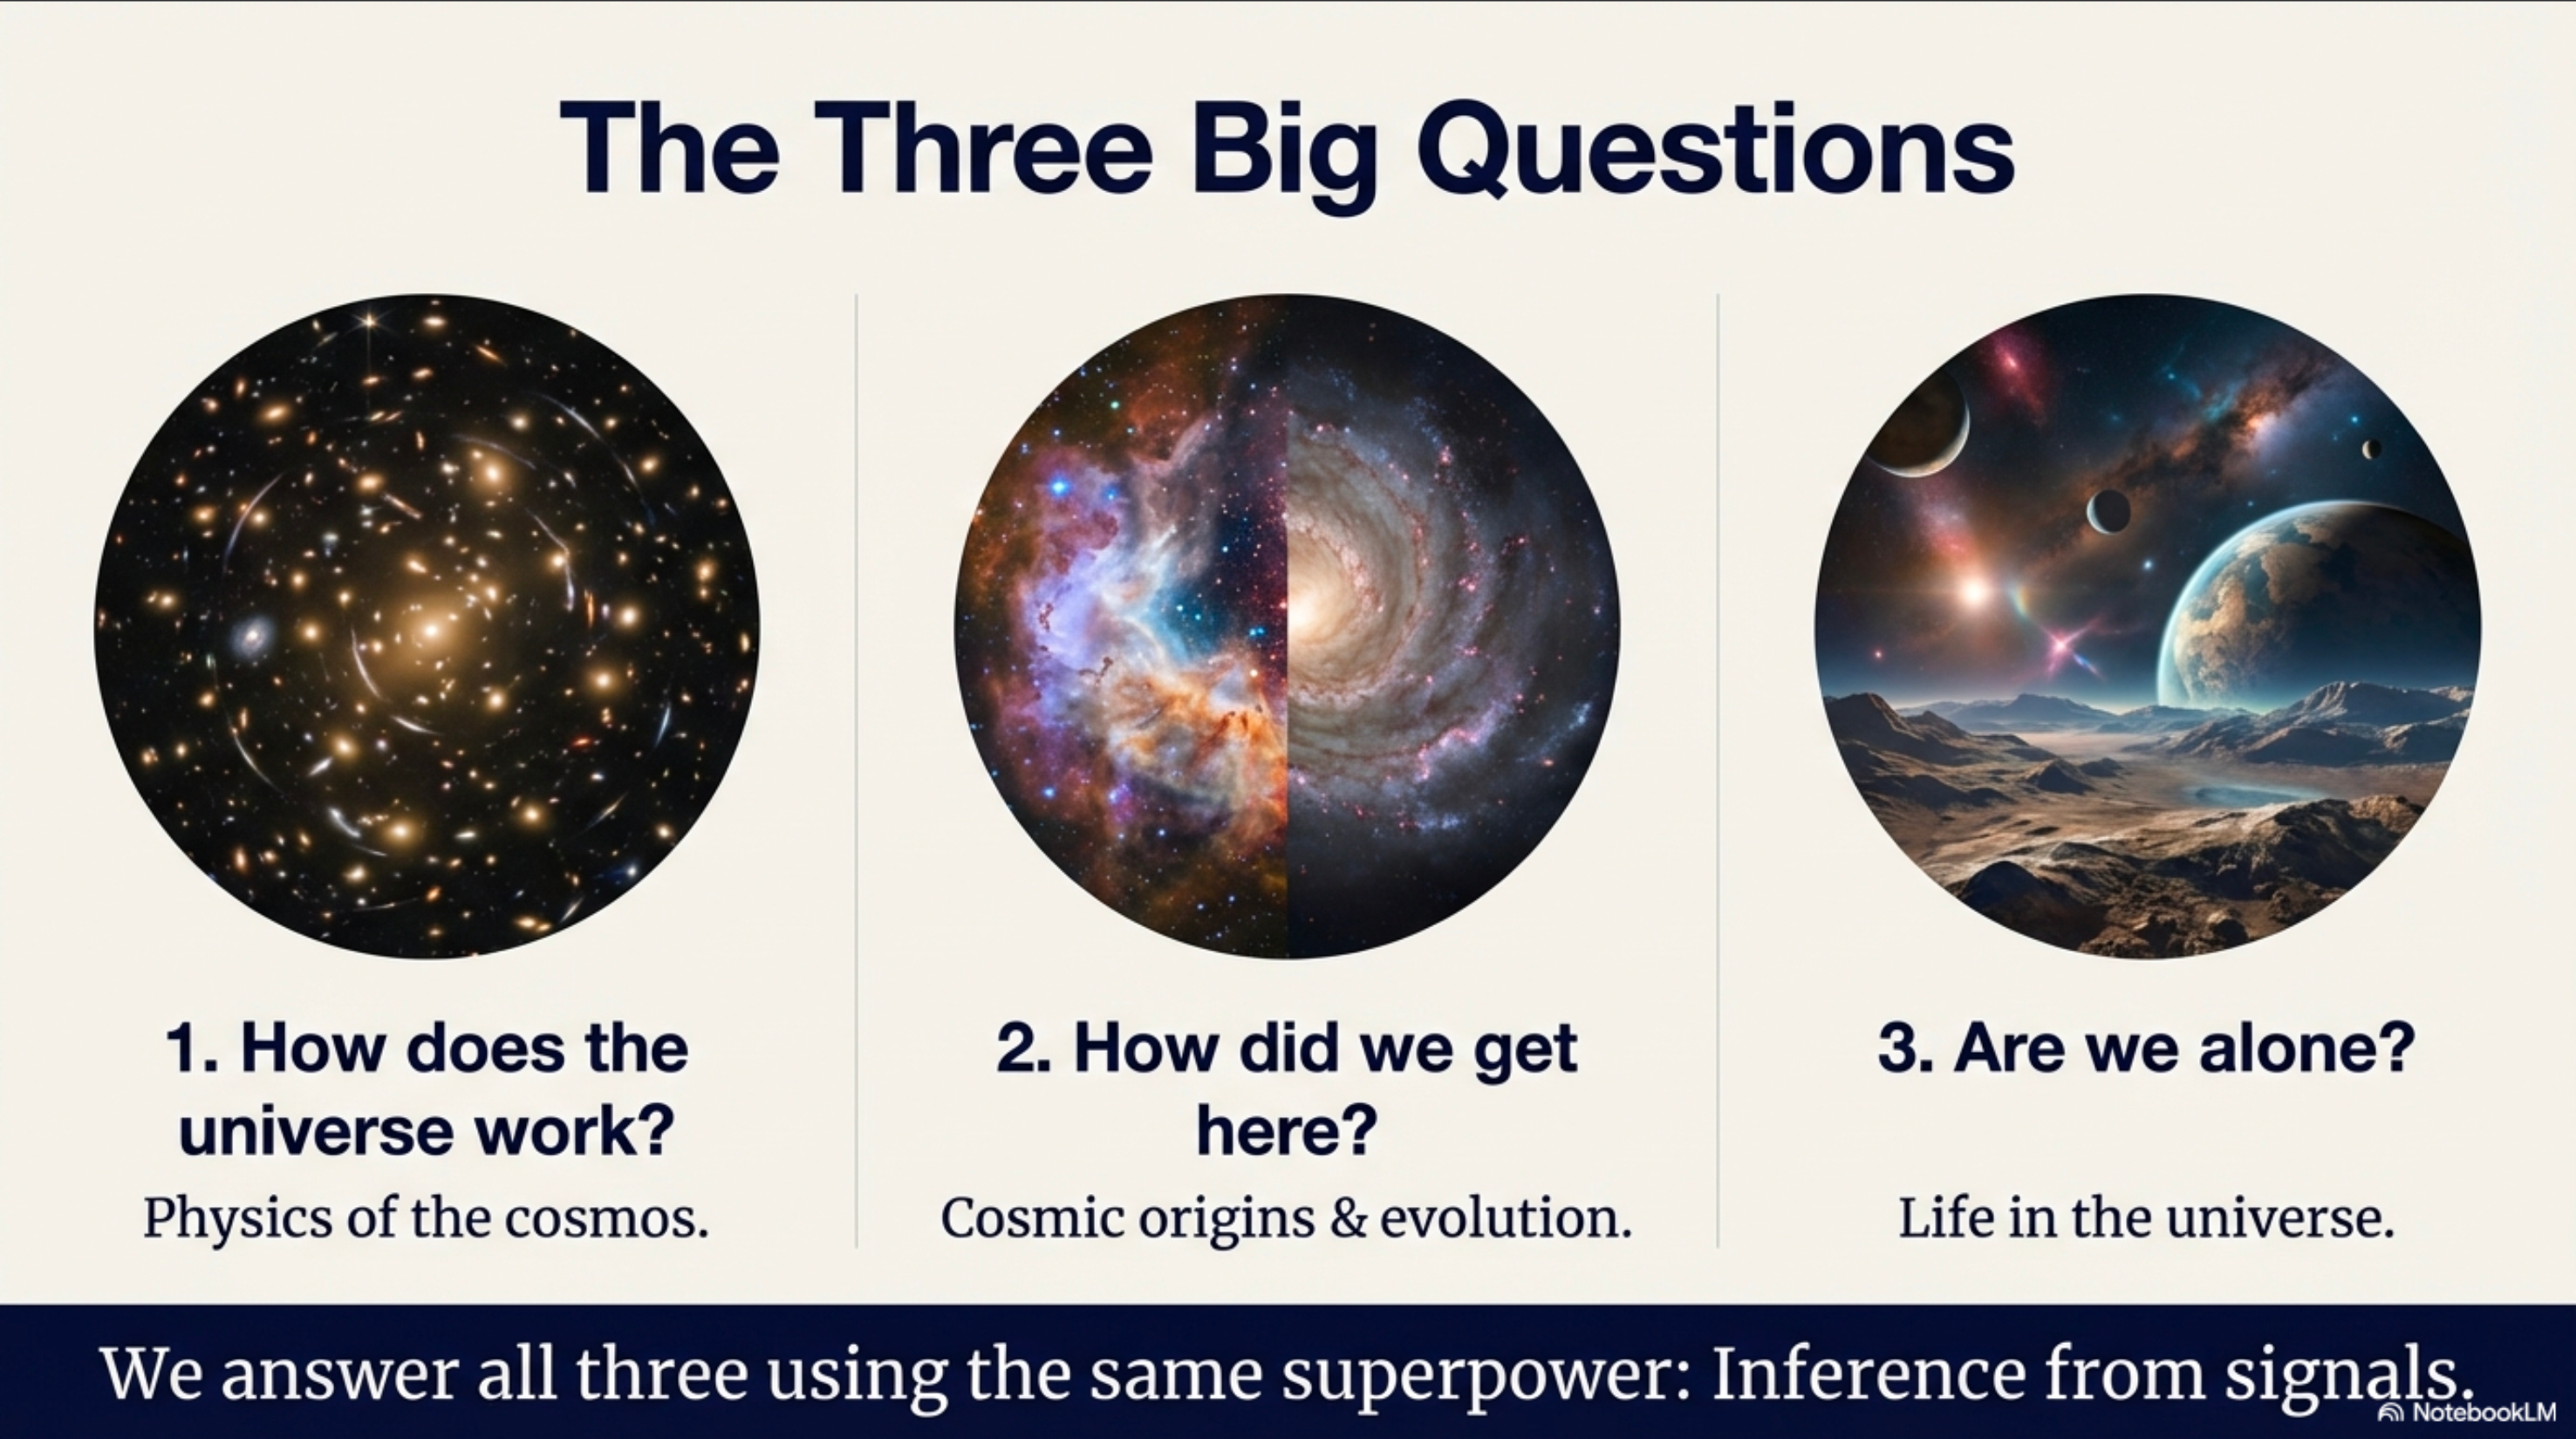
Think: Which question are you most curious about?
What Can We Actually Measure?
From billions of kilometers away, we can directly measure only four things.
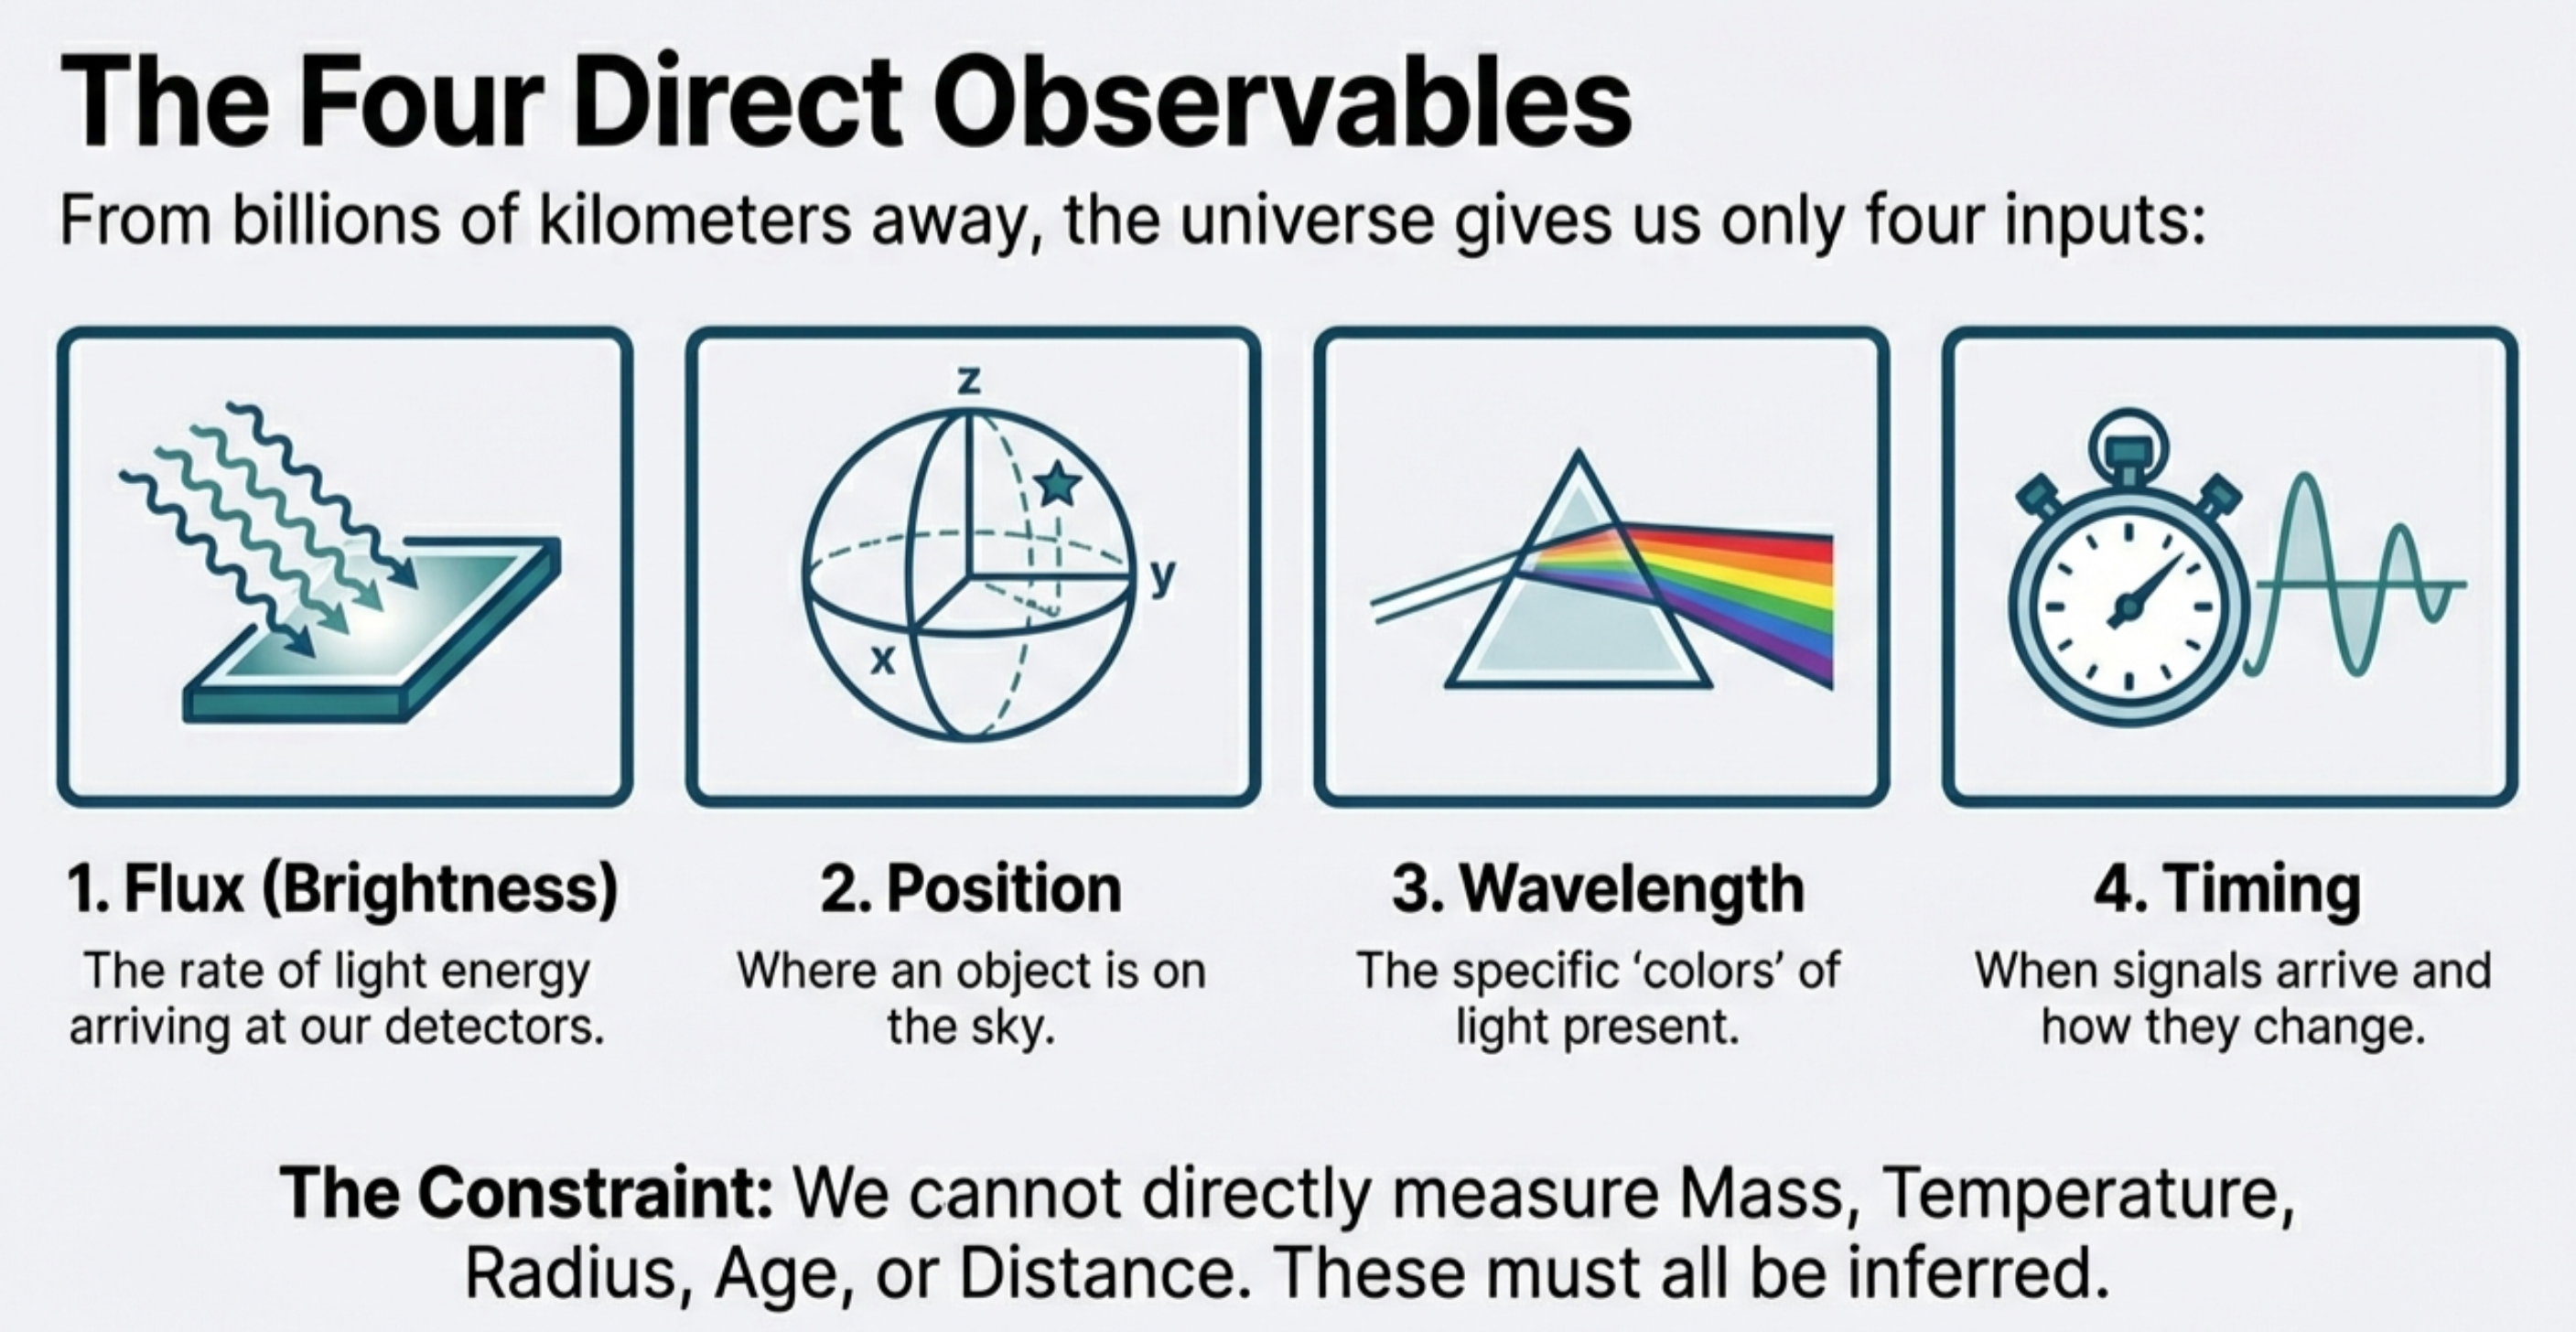
The Four Observables
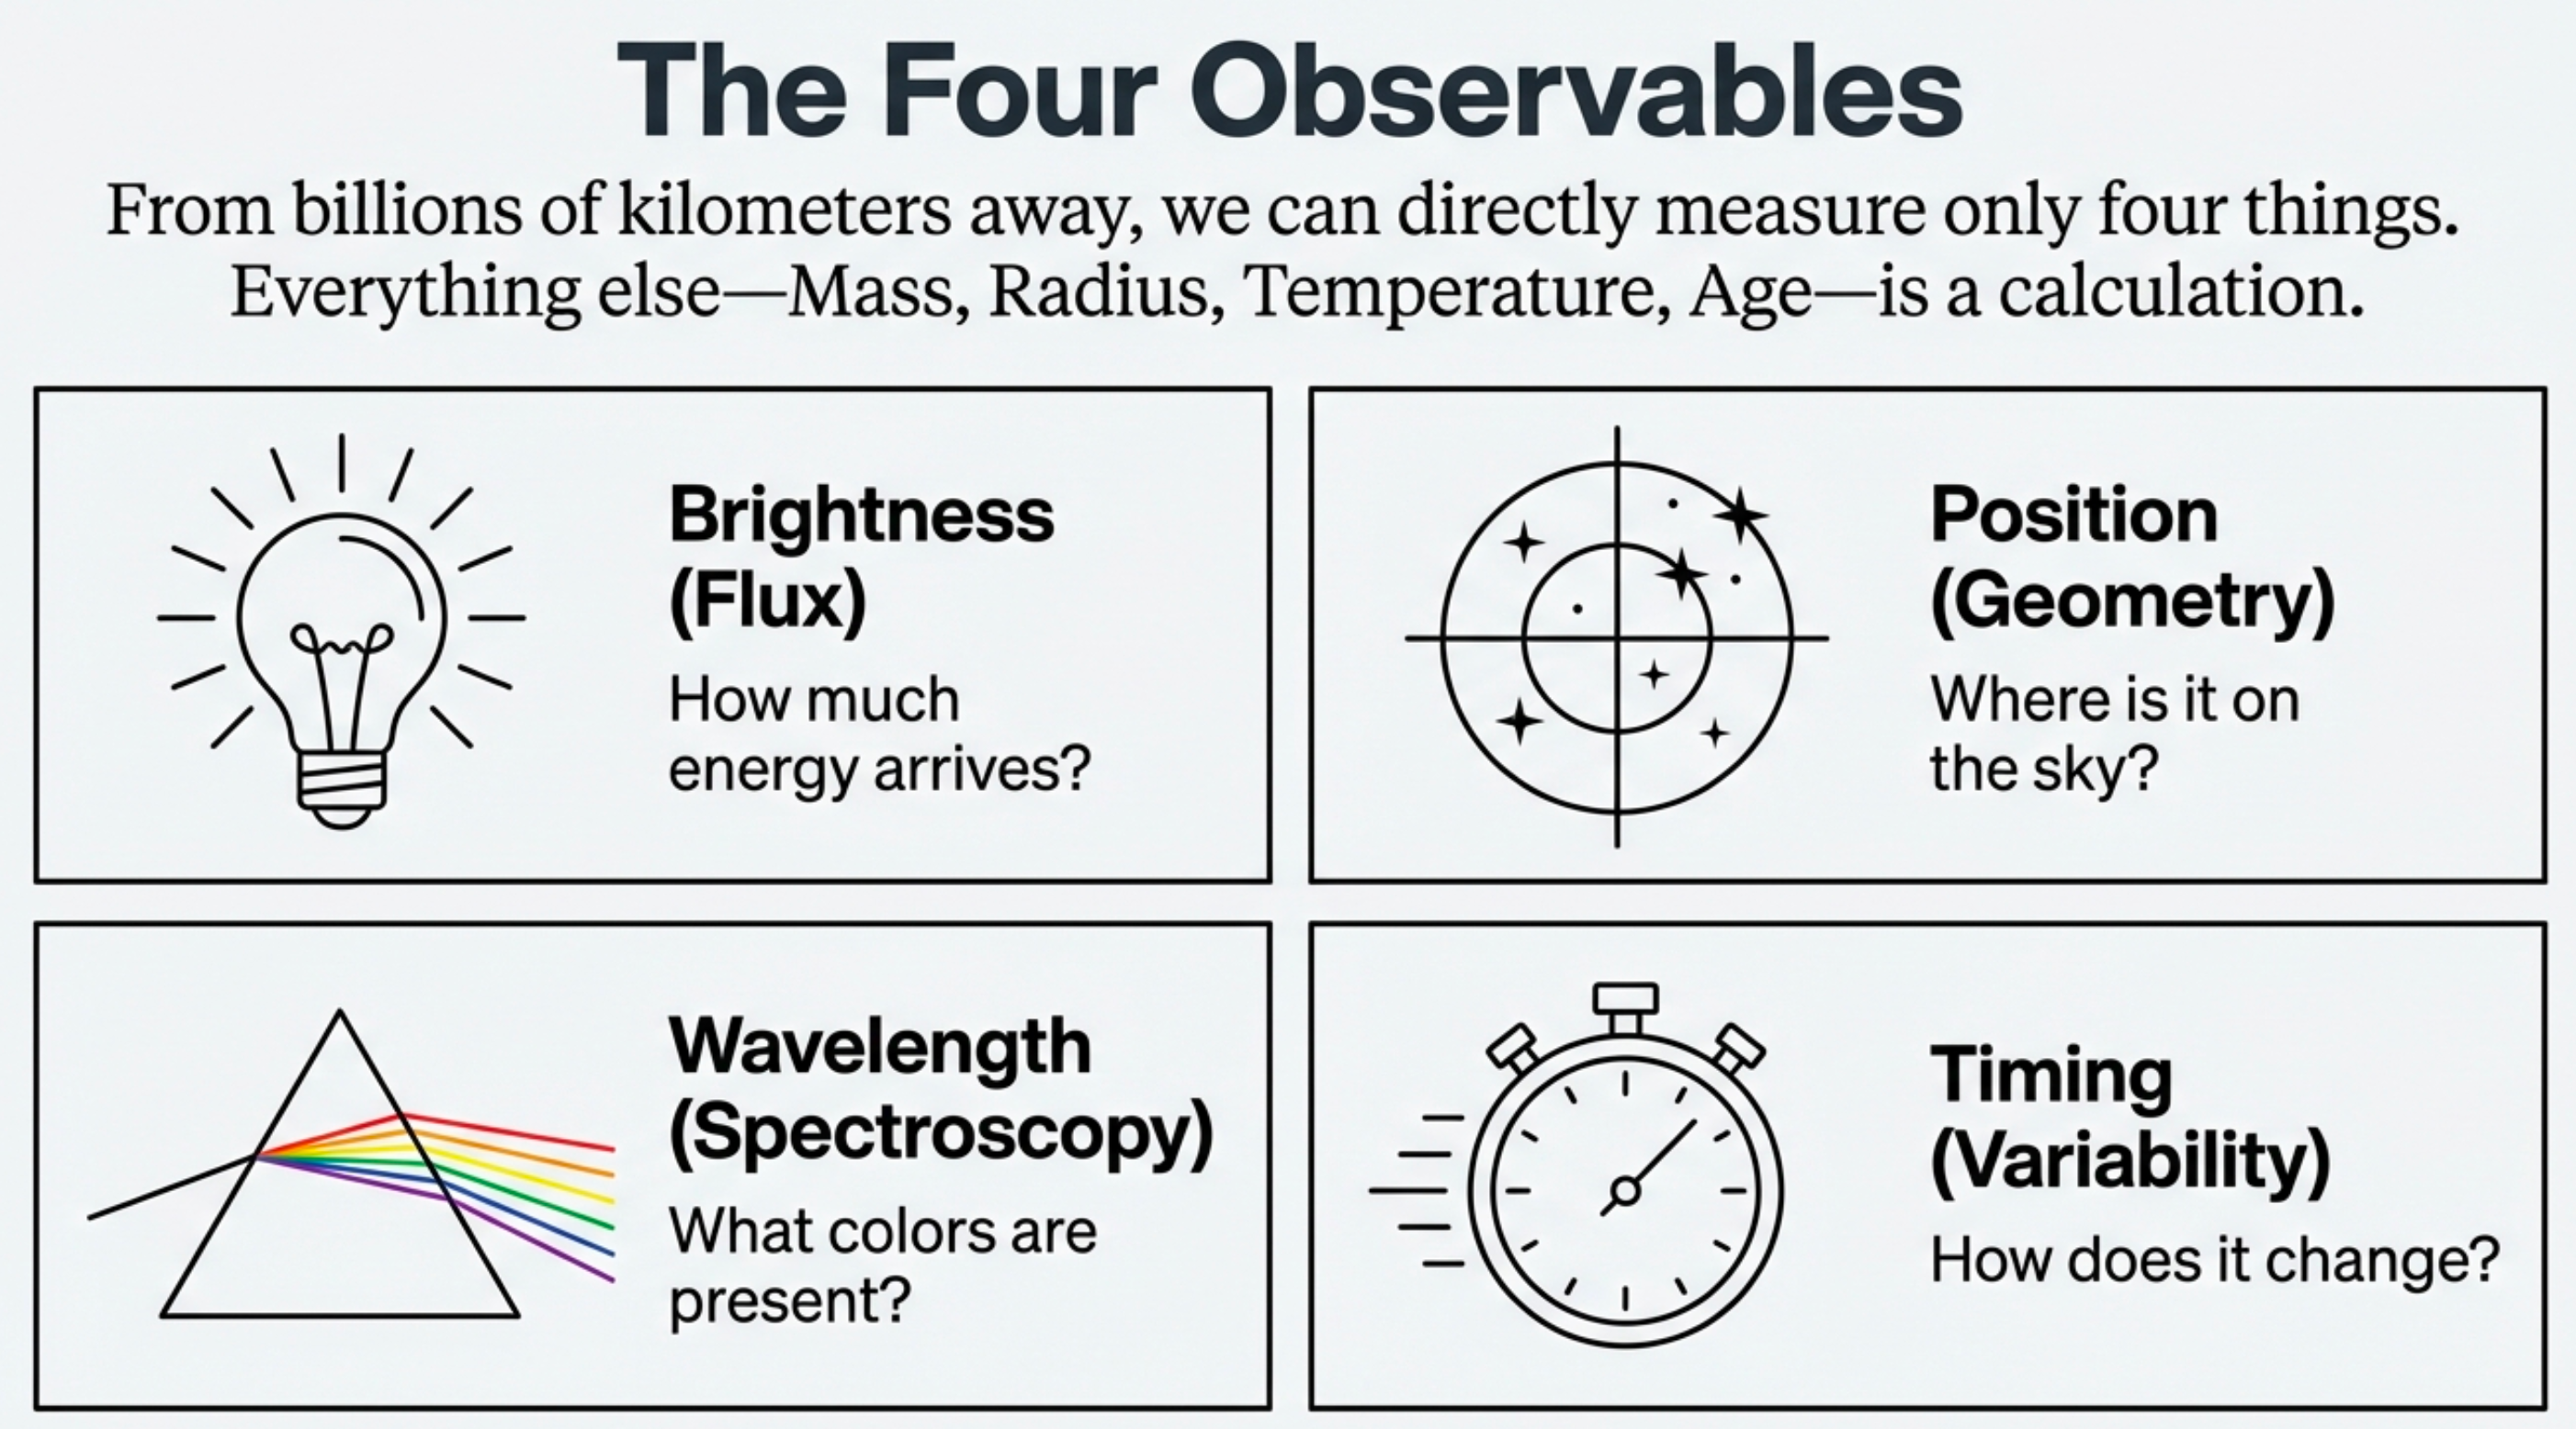
Direct observables (what we measure):
- Brightness — how much energy arrives per second
- Position — where on the sky, and how it moves
- Wavelength — what colors/spectrum are present
- Timing — how brightness or position changes over time
Spoiler 1: Nebulae — Colors Are Chemistry
![Annotated nebula image showing three labeled features: (1) Hydrogen-Alpha at 656.3 nm in red regions indicating ionized gas, (2) Doubly-ionized Oxygen [OIII] at 500 nm in blue-green regions indicating extremely low density, (3) Dark Lanes showing silhouettes of interstellar dust blocking the light.](../../../assets/images/module-01/forensic-analysis-of-a-nebula-nblm.png)
We measure: Colors at specific wavelengths
We infer: Chemical composition and dust structure
The physics: Each element emits/absorbs at unique wavelengths — a “spectral fingerprint”
Red = hydrogen (656 nm) Blue-green = oxygen (500 nm) Dark lanes = dust blocking light
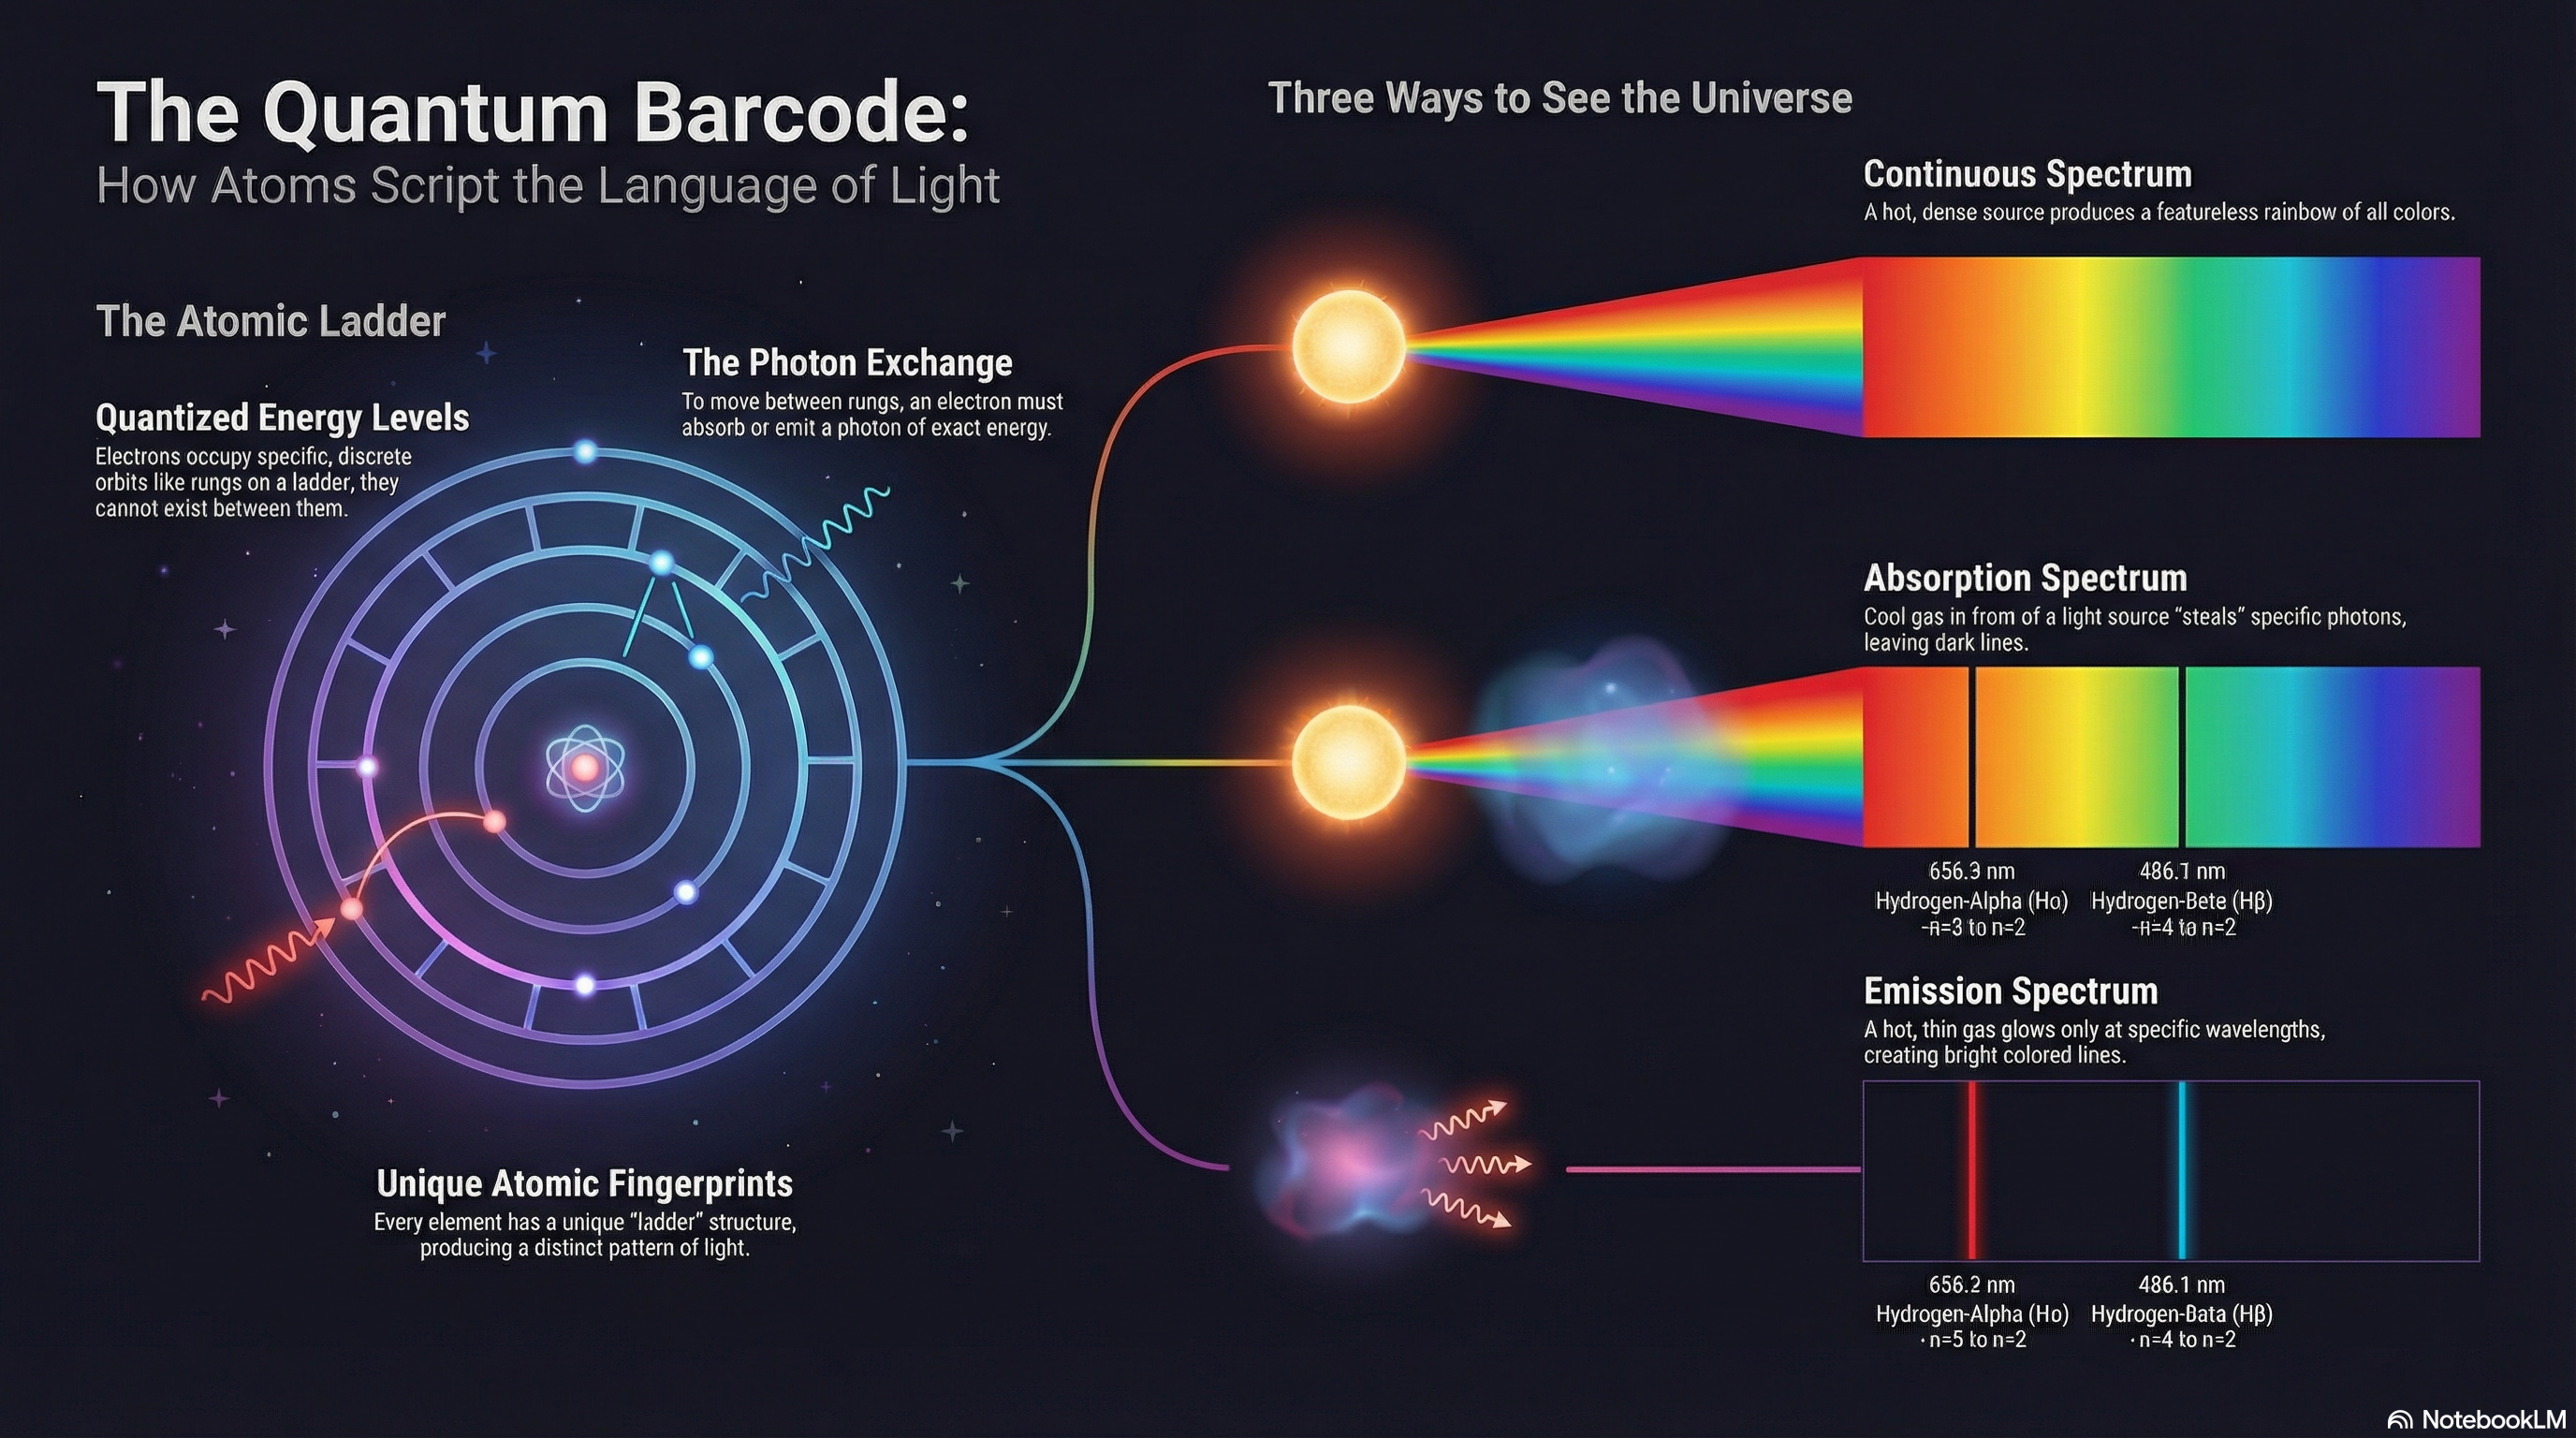
Spoiler 2: Spectroscopy — The Master Key
We measure: Brightness at each wavelength (a spectrum)
We infer: Temperature, composition, and motion
The physics: Atoms have quantized energy levels — electrons can only jump between specific rungs
Why it’s the master key:
A single brightness measurement = 1 data point. A spectrum = thousands of data points.
The Quantum Barcode
Spoiler 3: The Cosmic Distance Ladder
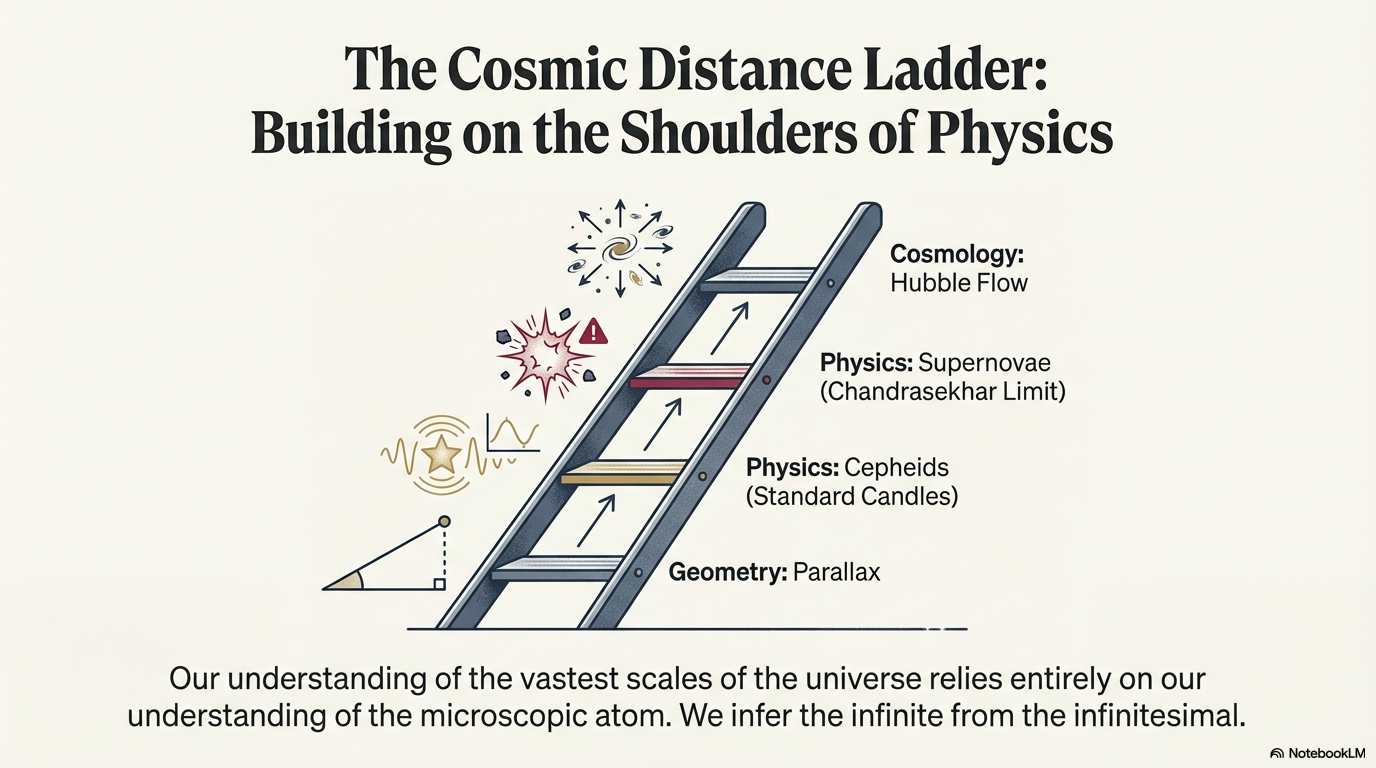
We measure: How bright an object appears (flux)
We infer: How far away it is
The physics: Light spreads out as it travels
— if you know the true brightness, you can calculate distance
A dim nearby source can look identical to a bright distant one
— physics breaks the tie.
Standard Candles: Know the Brightness, Calculate the Distance
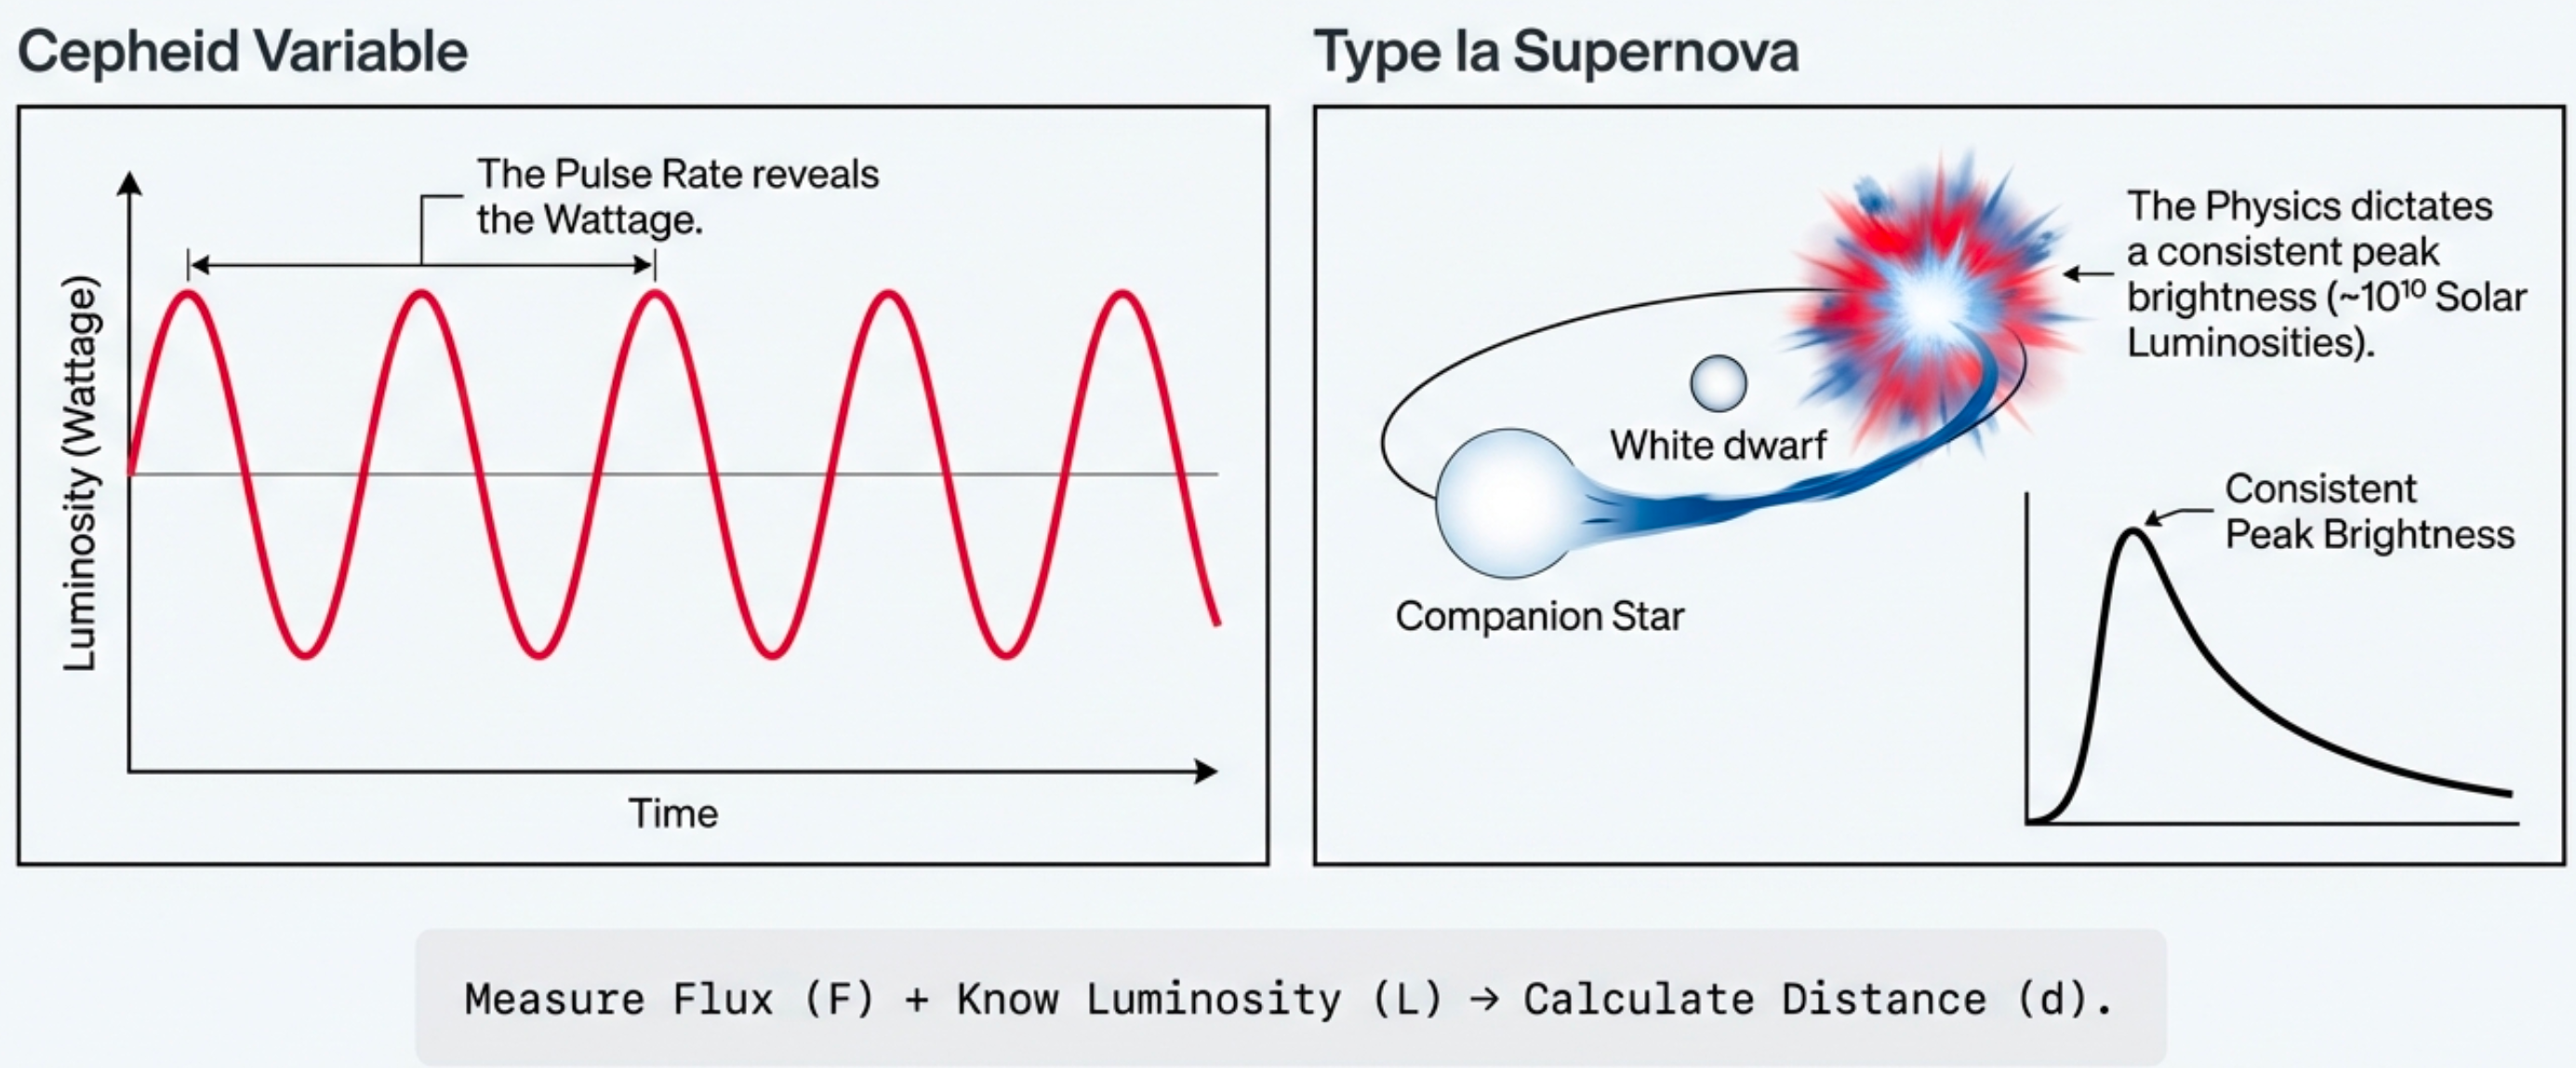
- Pulsating stars (period → luminosity)
- Exploding white dwarfs
(same mass → same brightness)
The key idea: If you know how bright something actually is (luminosity), and you measure how bright it appears (flux), you can calculate distance.
Standard candles: Objects whose true brightness we can predict from physics.
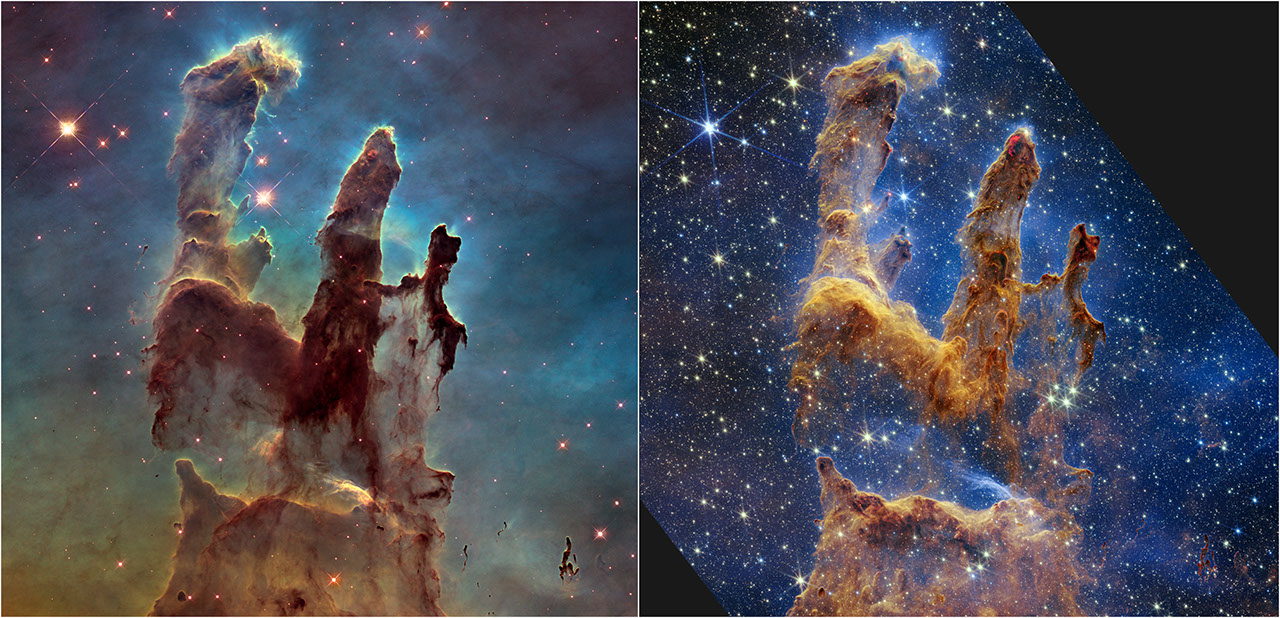
Spoiler 4: Same Galaxy, Different Physics
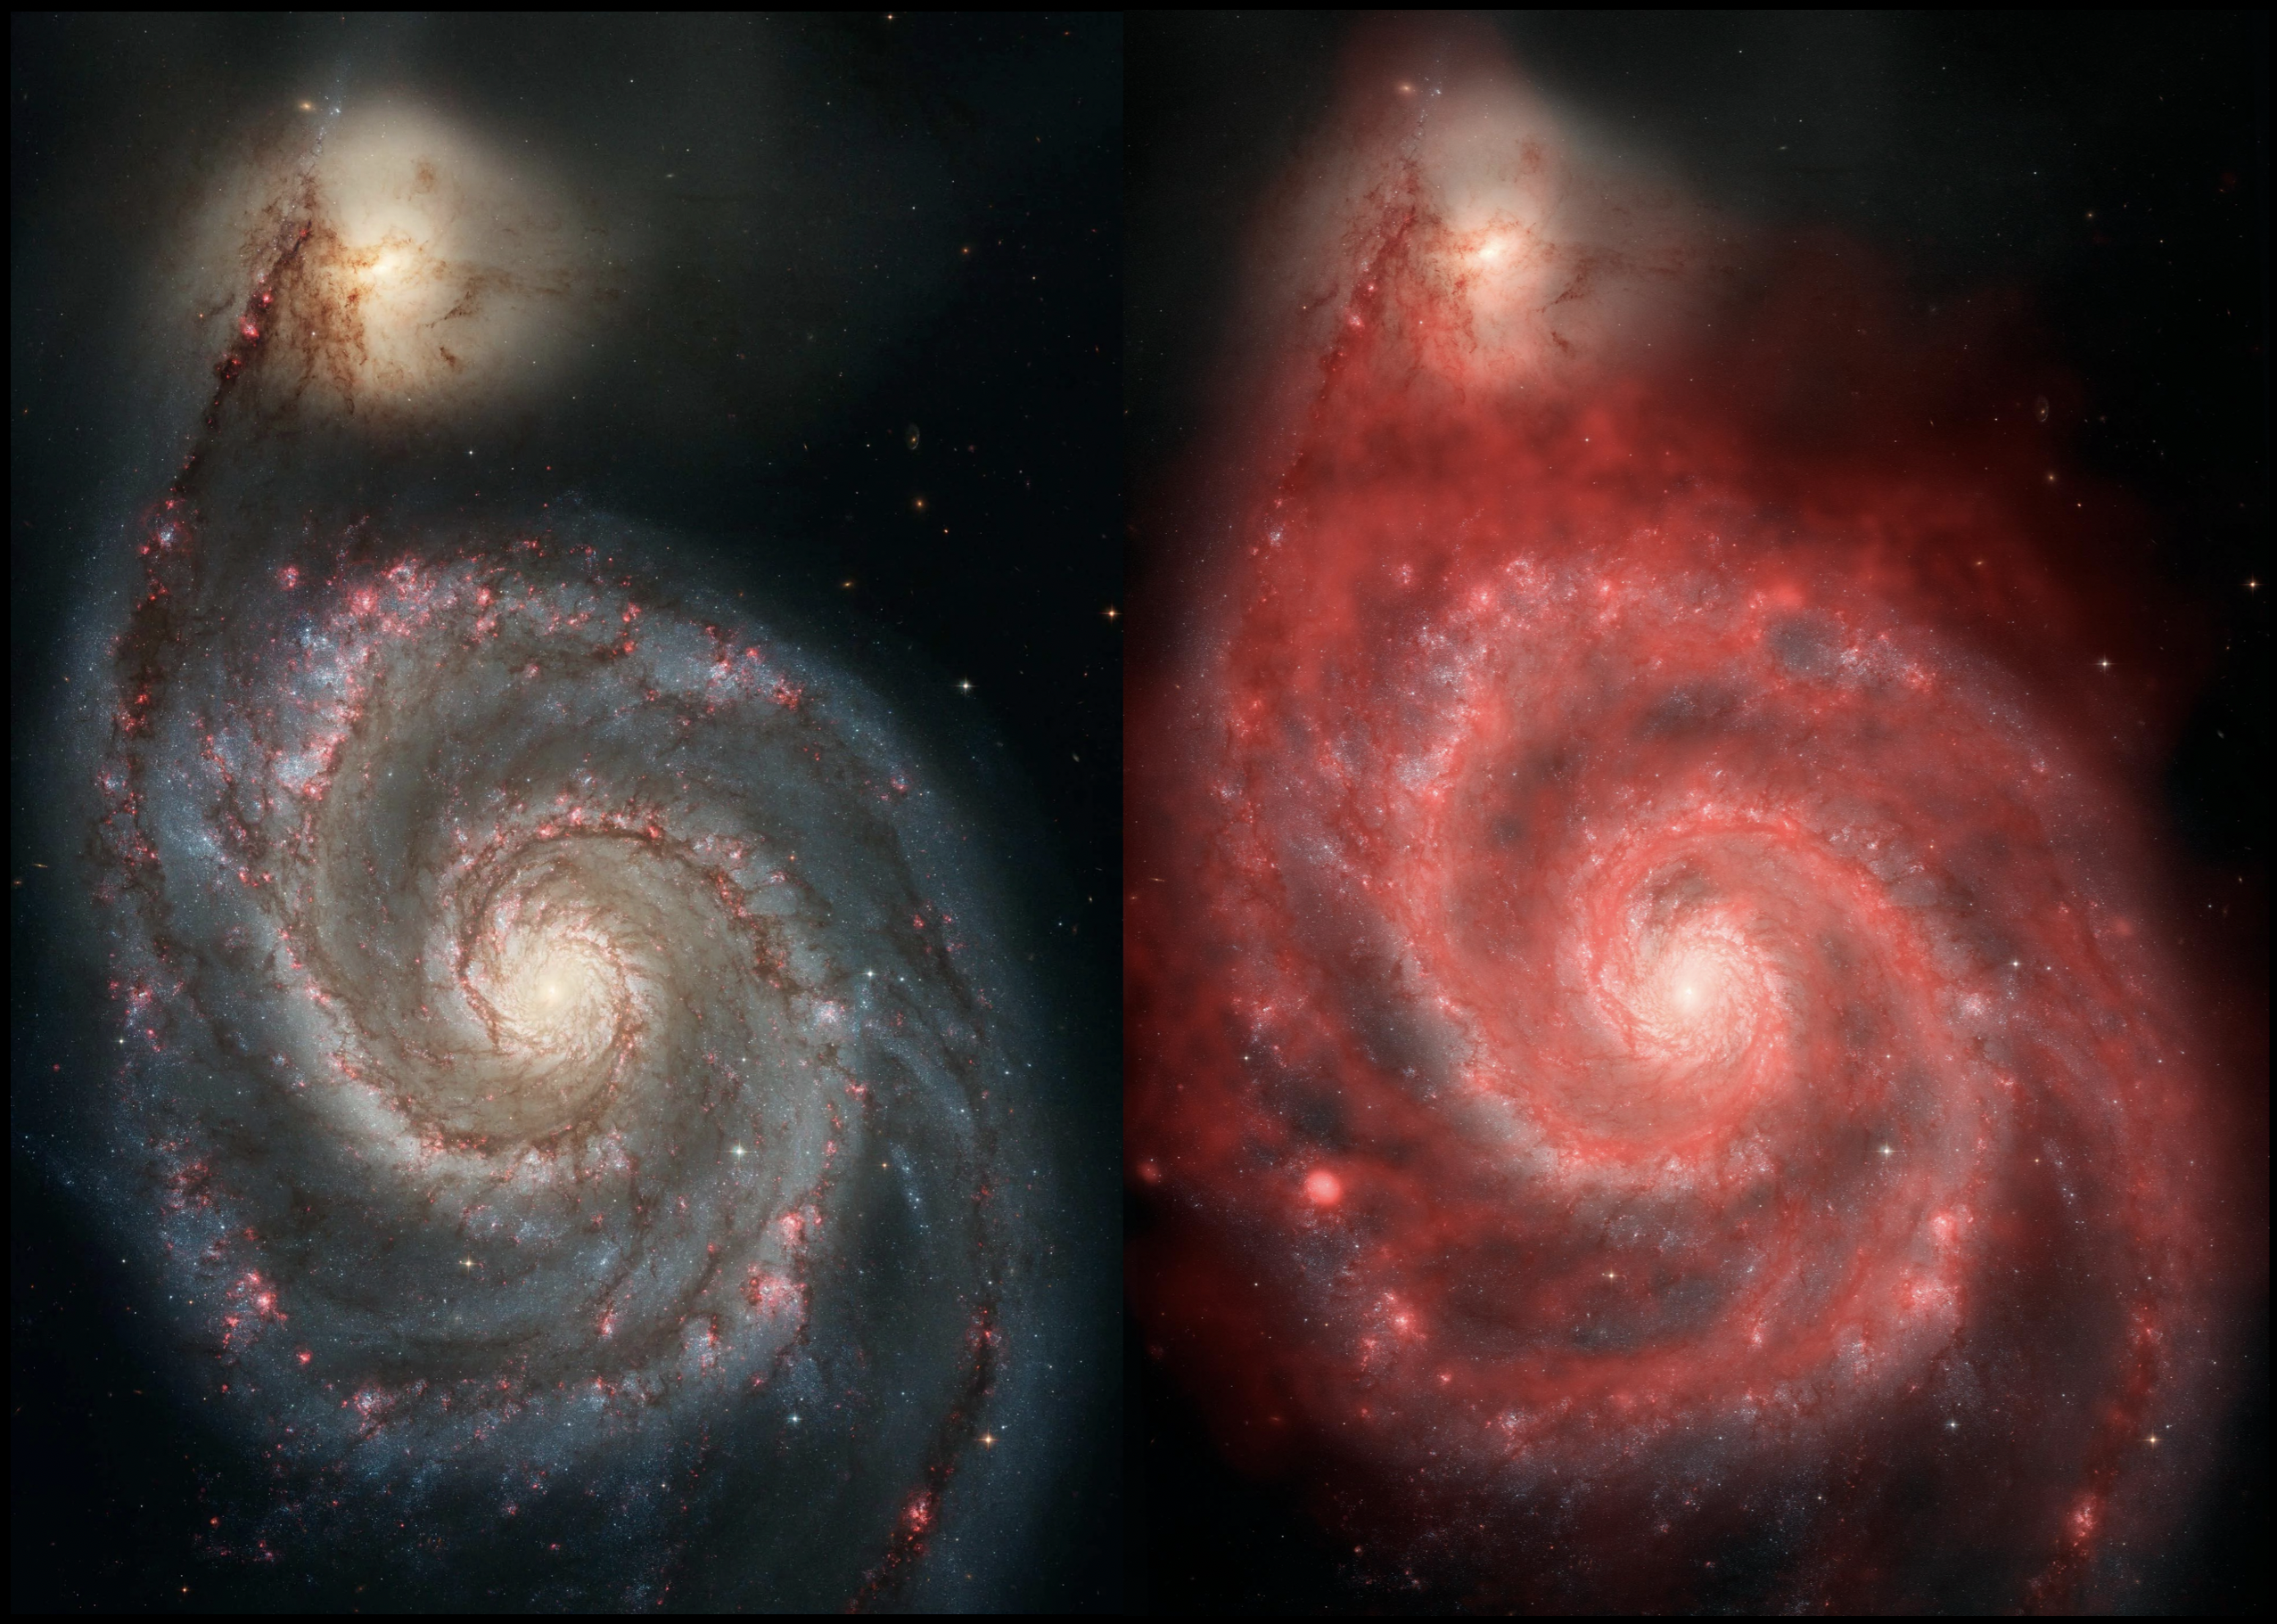
We measure: The same galaxy at different wavelengths
We infer: Different physical components are visible at different wavelengths
The physics: Different emission processes dominate at different wavelengths
Left (optical): Stars and dust lanes
Right (radio): Cold hydrogen gas
Spoiler 7: The Cosmic Web — Mapping the Universe in 3D
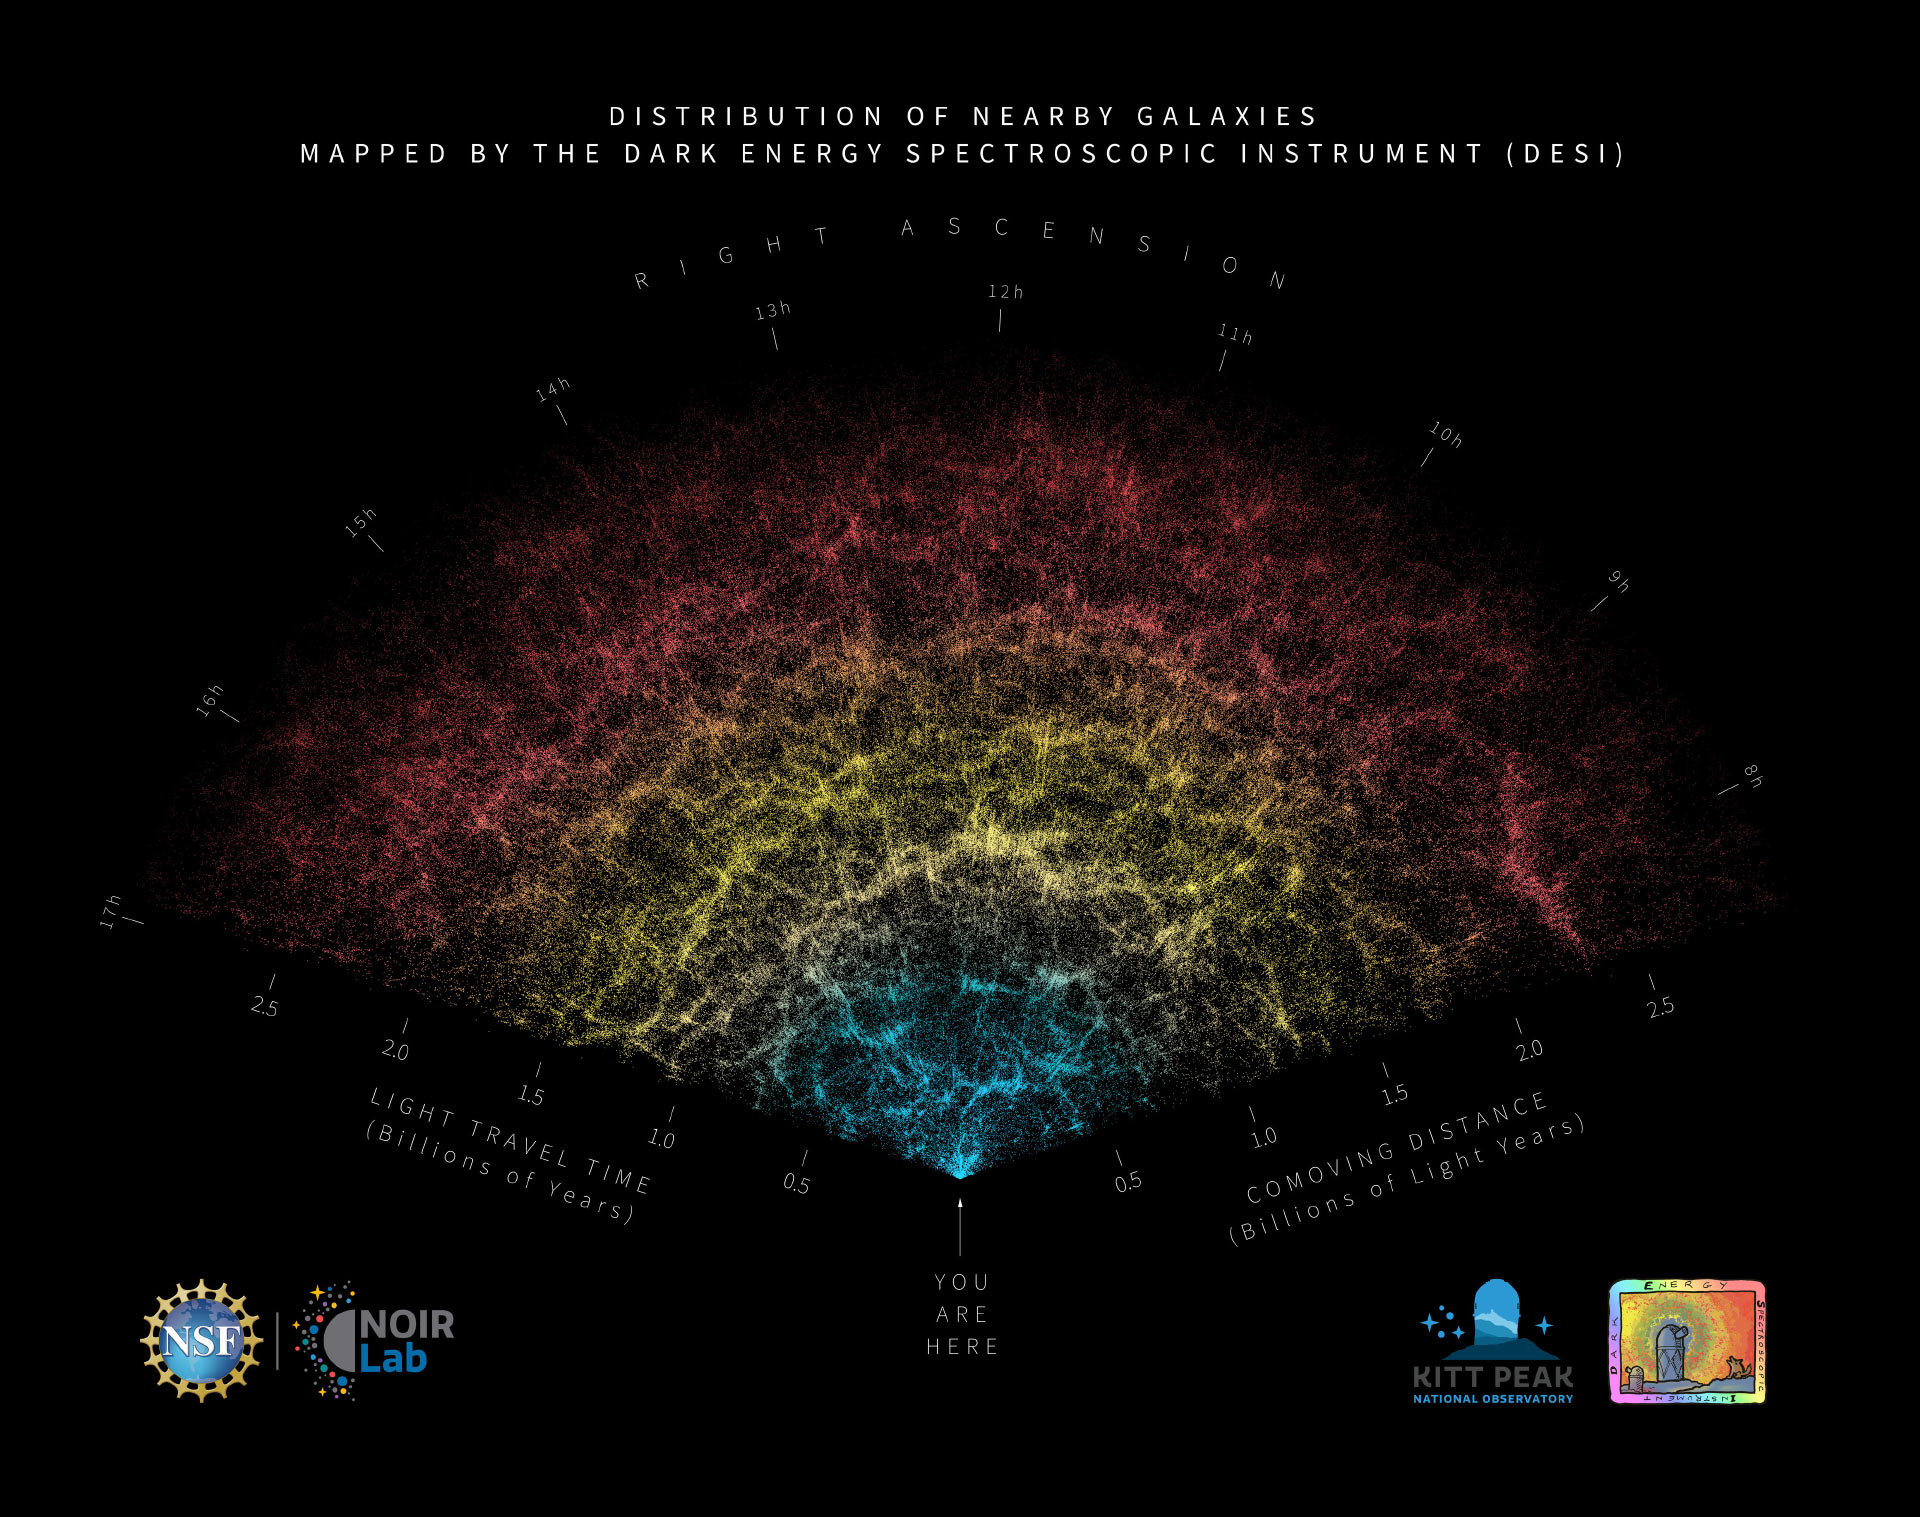
We measure: spectra (wavelength shifts) → redshifts → distances → 3D positions
We infer: the cosmic web (filaments + voids) and expansion-history constraints
The physics: gravity + cosmic expansion shape large-scale structure; mapping it tests cosmological models
Spoiler 8: The Universe Is “Dark”
Dark Matter + Dark Energy
We measure: how the expansion rate changes with time (distance + redshift)
We infer: the expansion is accelerating → “dark energy”
The physics: gravity + cosmic expansion link energy content to expansion.
Acceleration implies a component that acts like “repulsive gravity”
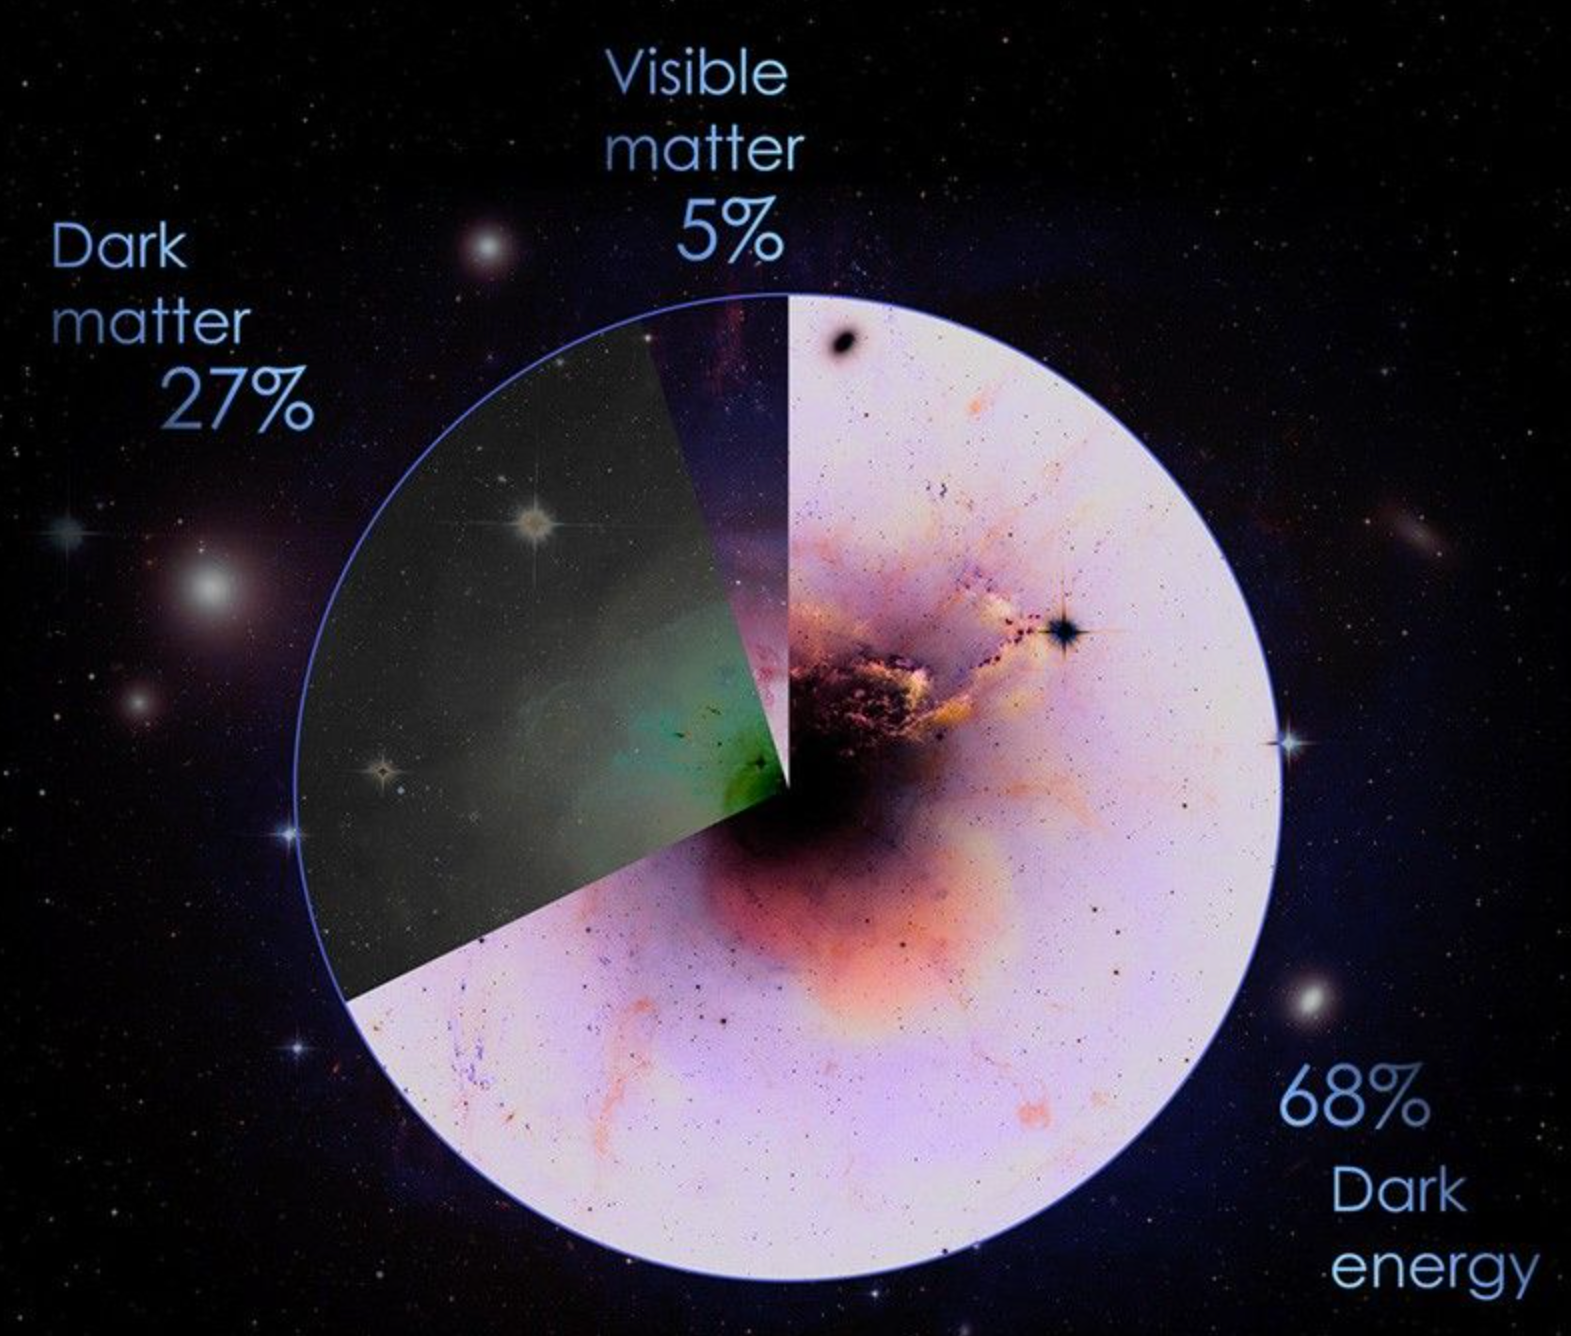
Big question: How does dark energy evolve?
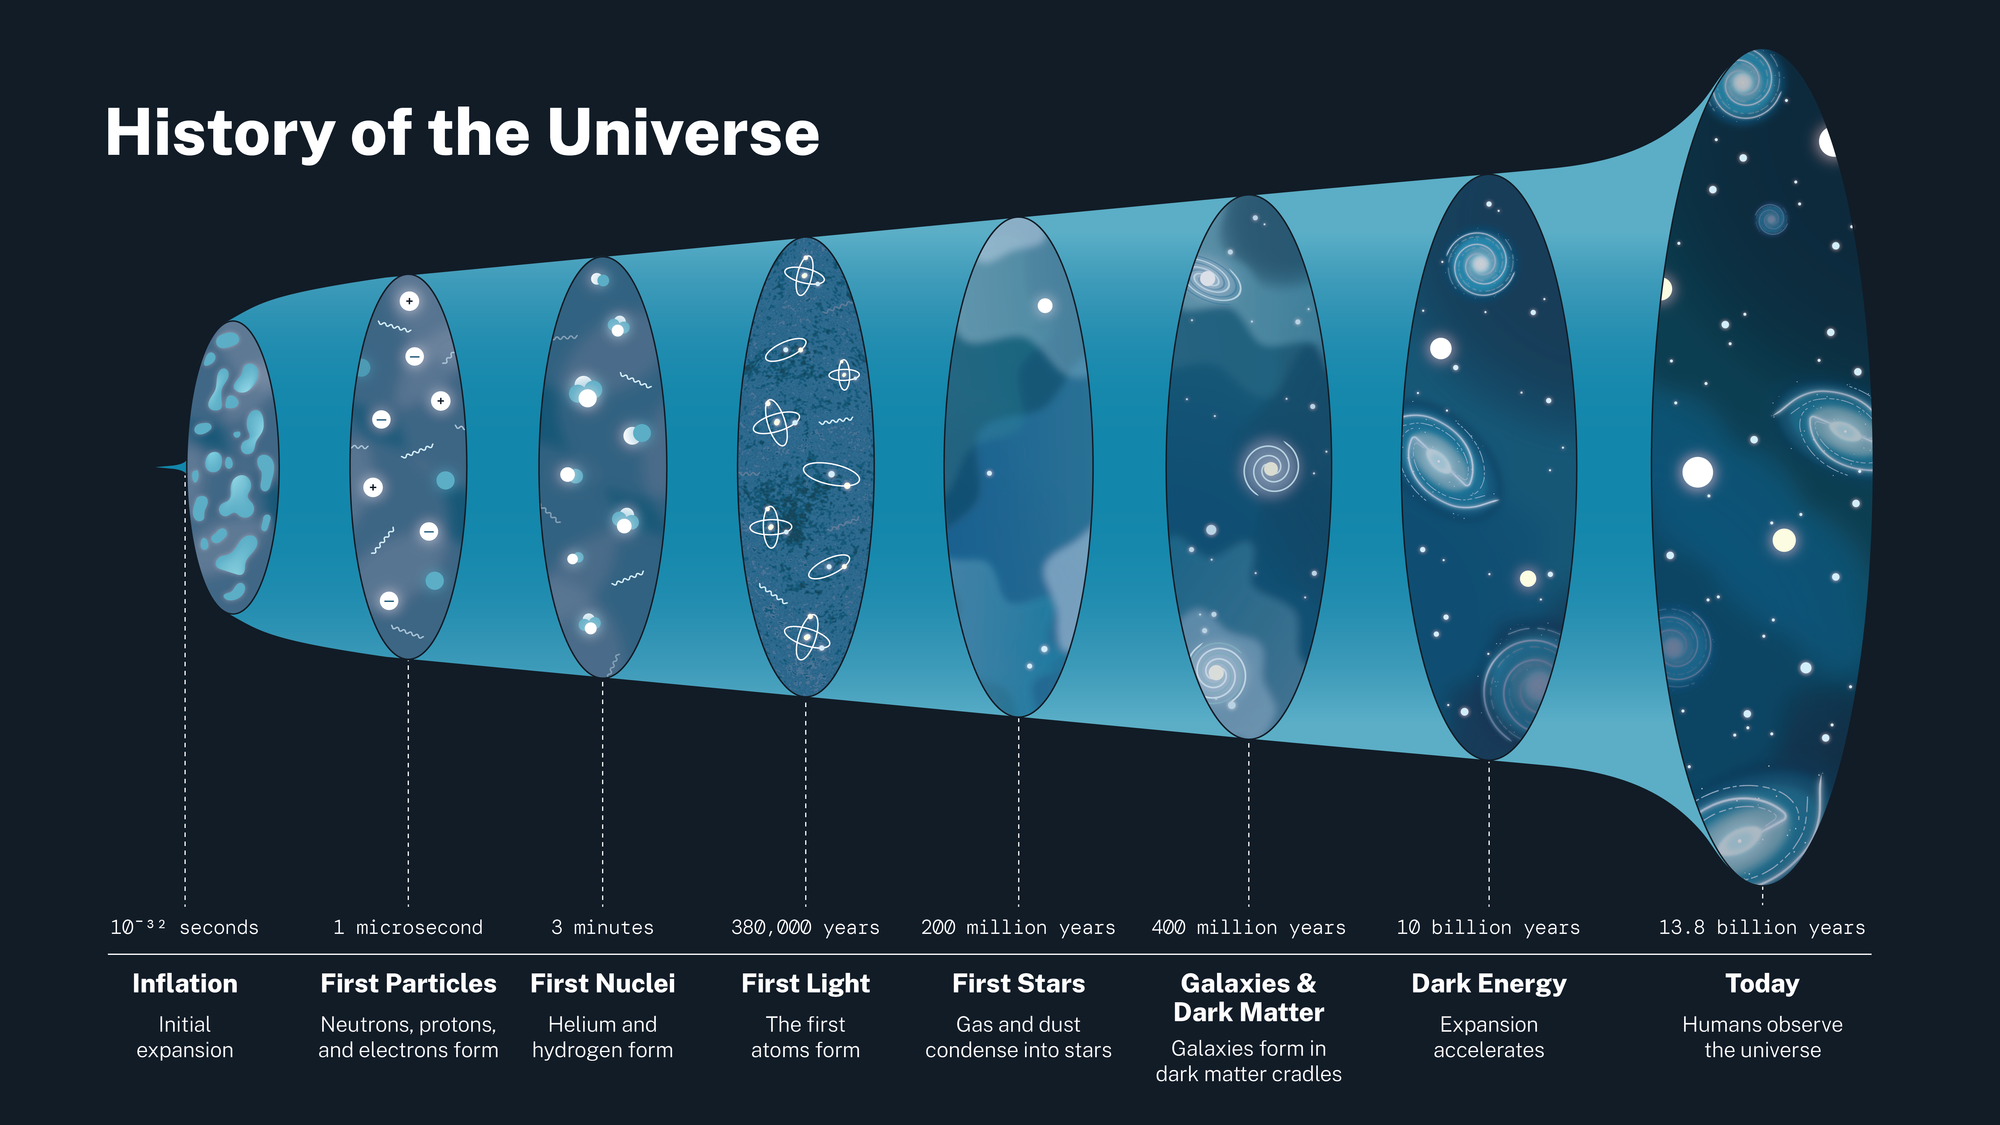
History of the Universe
Lookback Time: Distance Is a Time Machine
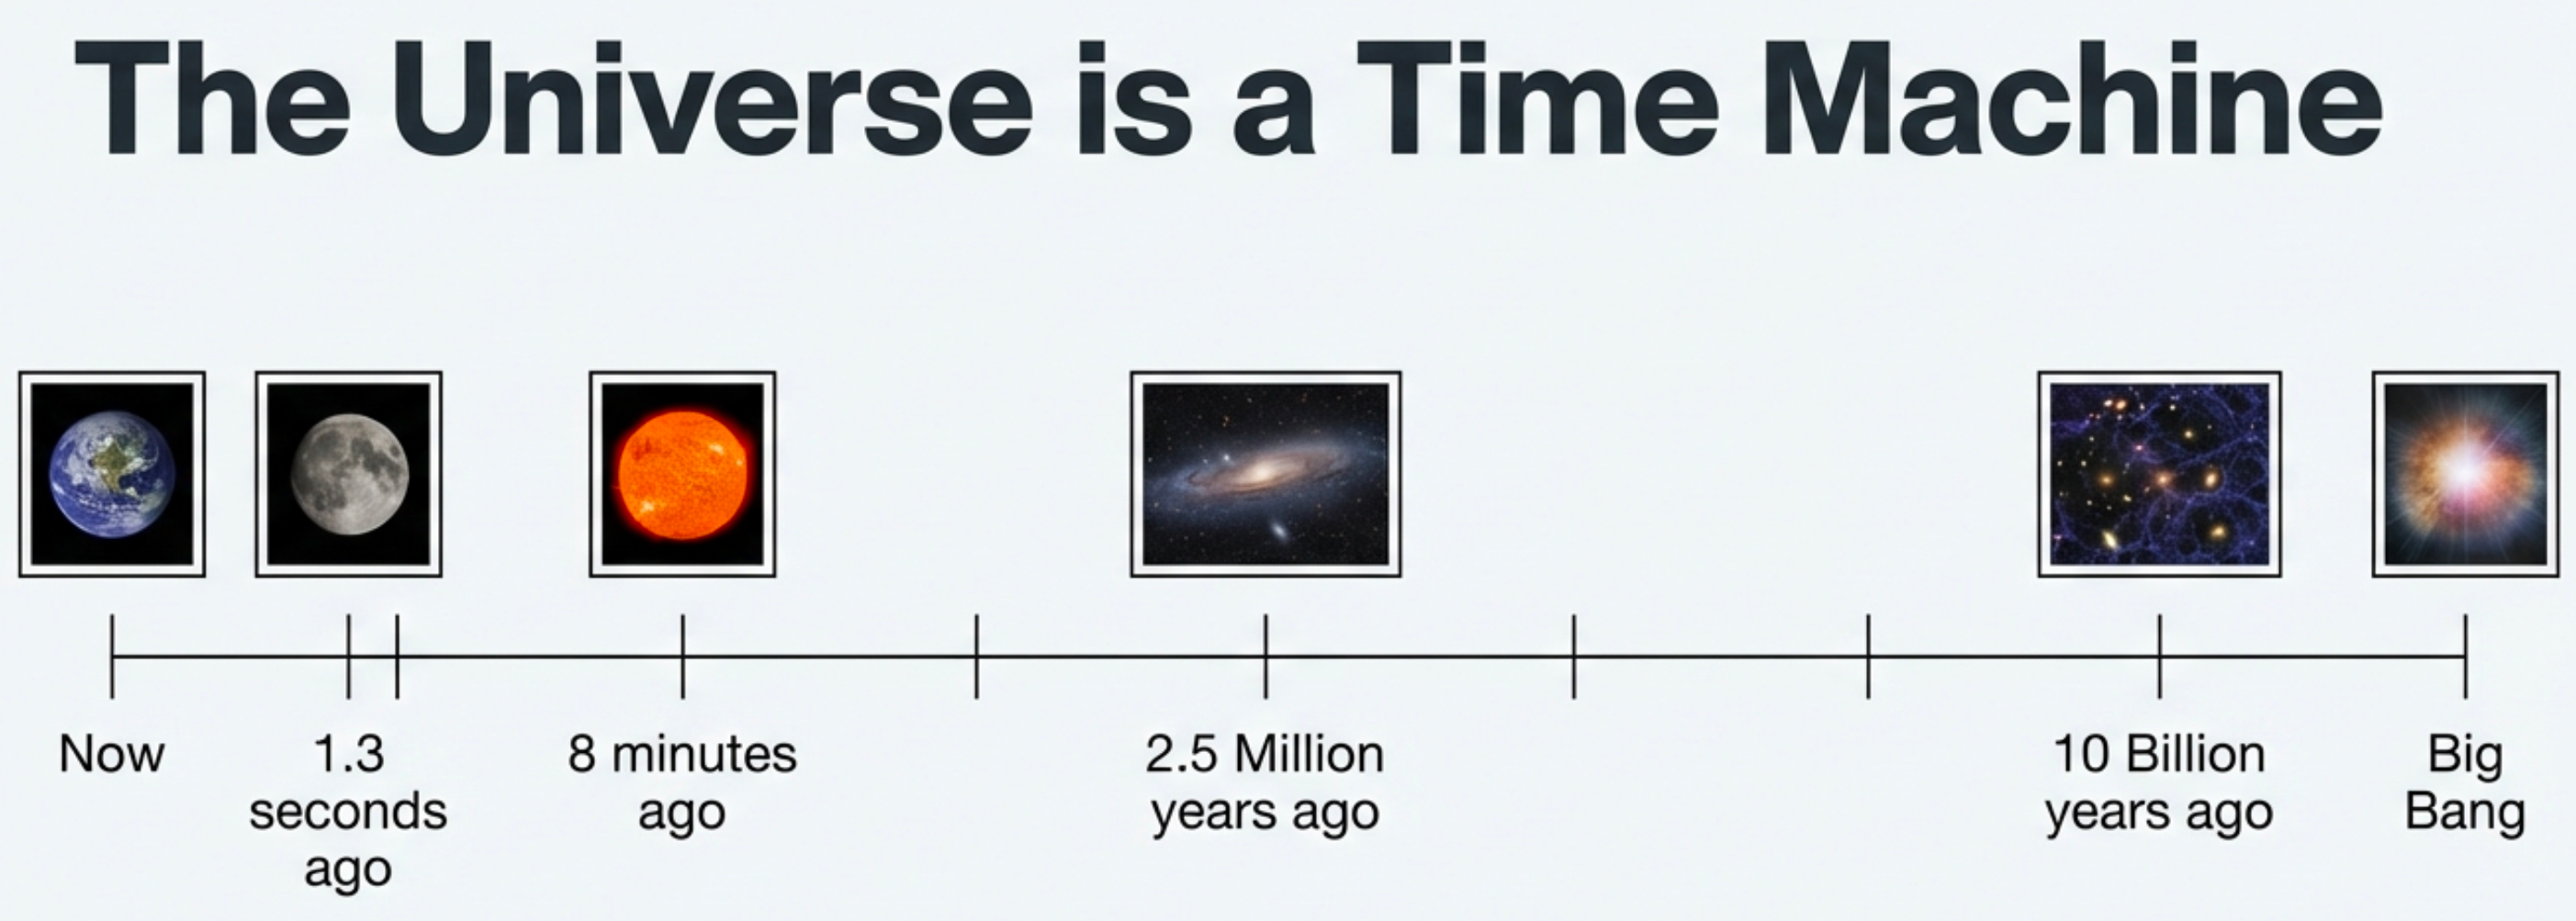
| Object | You see it as it was… |
|---|---|
| The Moon | 1.3 seconds ago |
| The Sun | 8 minutes ago |
| Andromeda Galaxy | 2.5 million years ago |
| Distant galaxies | Billions of years ago |
Looking far away means looking into the past.
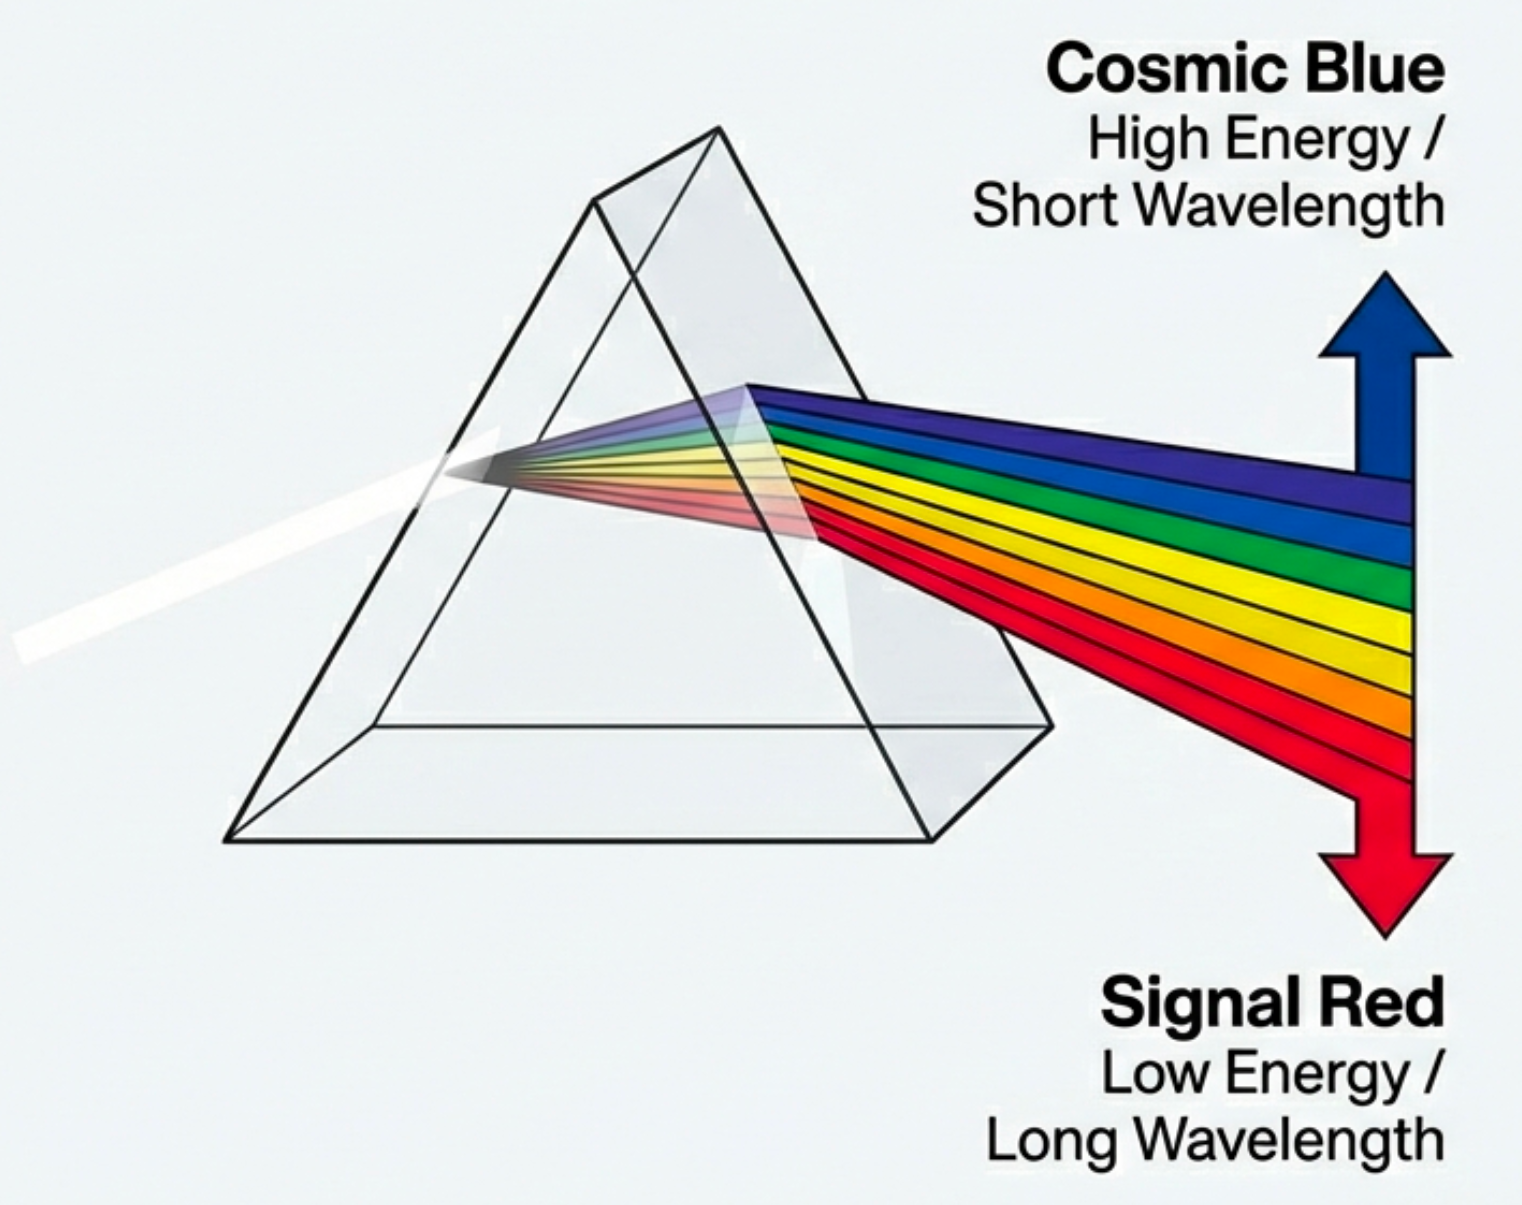
Wavelength Is Energy
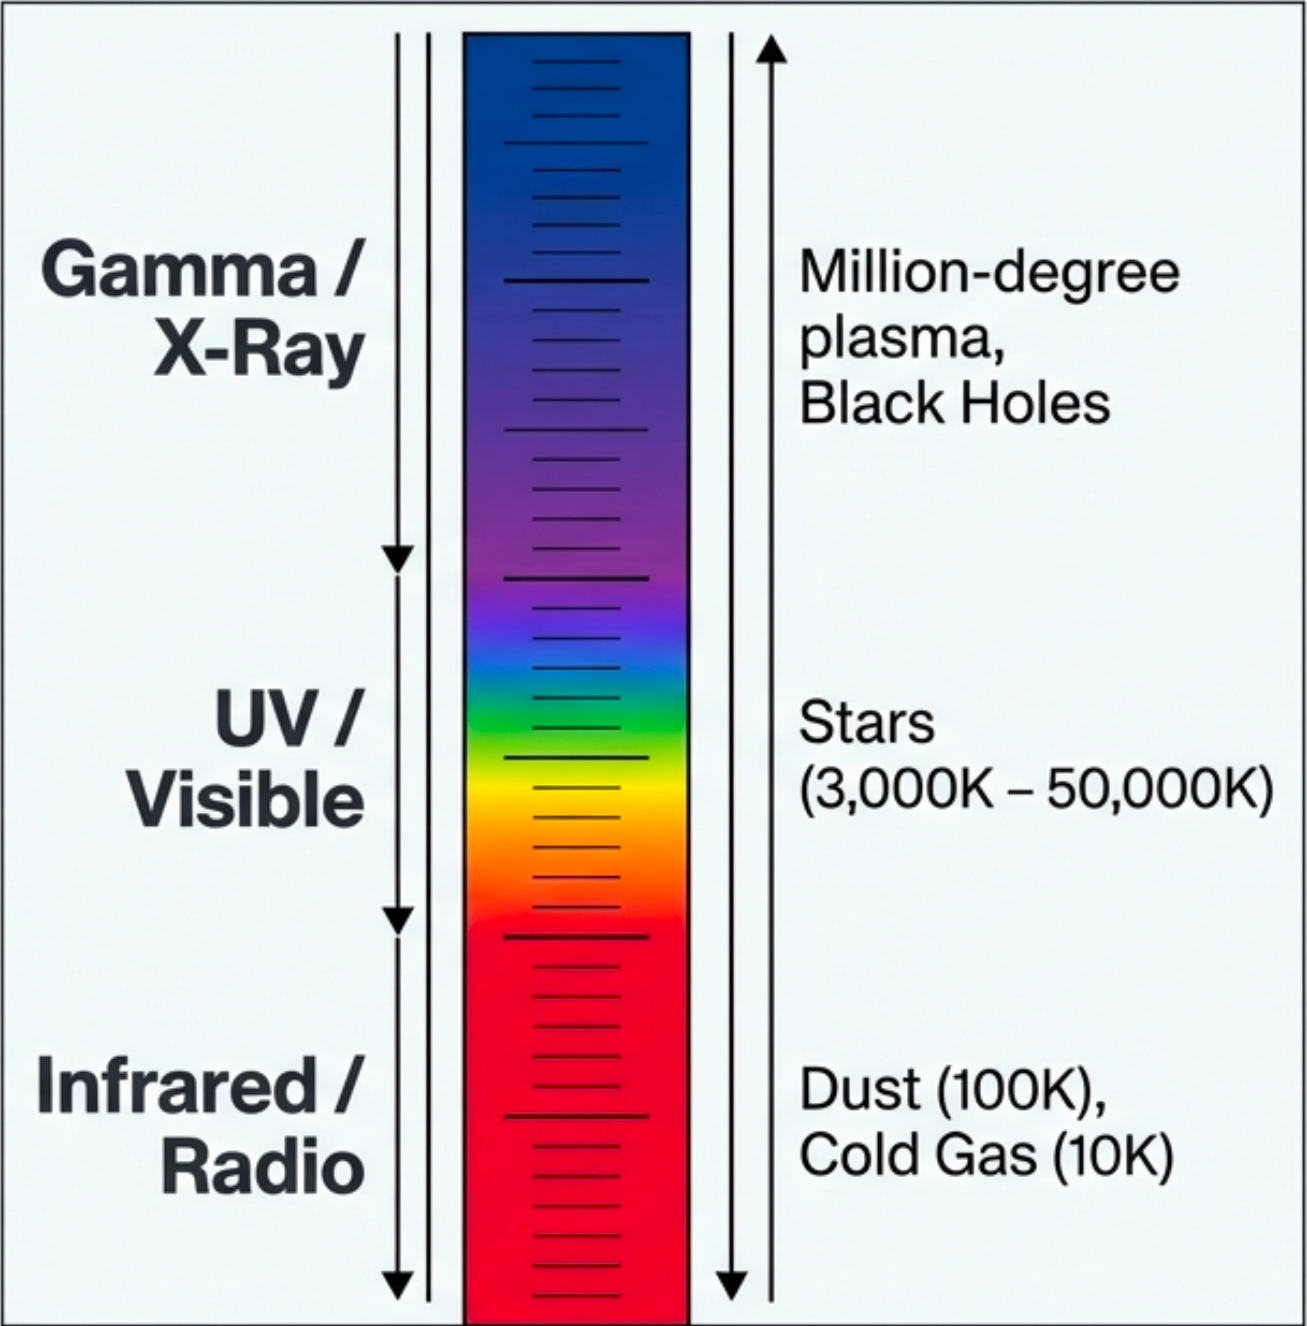
The key relationship:
For thermal light: shorter wavelength = higher photon energy = hotter source
- Gamma/X-ray: Million-degree plasma, black holes
- Visible: Stellar surfaces (3,000–50,000 K)
- Infrared/Radio: Dust and cold gas (10–100 K)
This is why different telescopes see different physics — not just “better pictures.”