Reading the Glow
Temperature Written in Light
February 11, 2026
You. Your laptop. The walls around you.
Most of it is infrared — invisible to your eyes.
Color tracks temperature
Heat it to \(500^{\circ}\mathrm{C}\) \(\to\) dull red
Heat it to \(1000^{\circ}\mathrm{C}\) \(\to\) bright orange
Heat it to 5800 K \(\to\) brilliant white
The color of the glow tells you the temperature.
🖥️ Explore: Infrared Animals
Betelgeuse and Sirius are both among the brightest stars in the winter sky.
One is 880 times the Sun’s radius. The other is just 1.7×.
How could we possibly know that — without visiting either one?
By the end of today, you’ll be able to answer this.
Today’s Learning Objectives
By the end of today, you’ll be able to:
- Explain that all objects with temperature emit thermal radiation
- Define a blackbody and explain why stars approximate blackbodies
- Apply Wien’s Law to connect peak wavelength and temperature
- Explain why the Sun appears white even though its peak is green
- Apply the Stefan-Boltzmann Law to relate temperature and luminosity
- Connect luminosity, temperature, and radius: \(L = 4\pi R^2 \sigma T^4\)
- Use the ratio method to calculate stellar properties in solar units
- Infer stellar size when temperature is fixed but luminosity differs
Quick Review: The Kelvin Scale
In physics, we measure temperature in Kelvin — starts at absolute zero.
| Absolute zero |
\(-273^{\circ}\mathrm{C}\) |
0 K |
| Room temperature |
\(20^{\circ}\mathrm{C}\) |
293 K |
| Sun’s surface |
\(5500^{\circ}\mathrm{C}\) |
5800 K |
Quick rule: \(T_K = T_C + 273\)
“Double the temperature” only makes physical sense in Kelvin.
Thermal Radiation
All objects with temperature above absolute zero emit electromagnetic radiation.
This is thermal radiation — comes from thermal motion of particles.
No external source needed — the object emits because it has internal energy.
Examples Across Temperatures
| Cosmic background |
2.7 K |
~1 mm |
Microwaves |
| Room temperature |
300 K |
~\(10\,\mu\mathrm{m}\) |
Infrared |
| Red-hot metal |
~1000 K |
~\(3\,\mu\mathrm{m}\) |
Near-IR, dull red |
| Sun’s surface |
5800 K |
~500 nm |
Visible (green peak) |
| Hot blue star |
30,000 K |
~100 nm |
Ultraviolet |
Pattern: hotter \(\to\) shorter wavelength
Quick Check: Thermal Radiation
Which of the following emits thermal radiation?
- Only the Sun and stars
- Only objects that are visibly glowing
- Everything with temperature above absolute zero
- Only objects connected to power sources
What Is a Blackbody?
A blackbody is an idealized object with two properties:
- It absorbs all incident radiation — nothing reflected
- It emits thermal radiation with a spectrum determined only by temperature
Temperature alone determines the spectrum.
A blackbody iron ball at 5800 K emits the same spectrum as a blackbody tungsten ball at 5800 K — or the Sun.
Quick Recall: Photon Energy (Lecture 7)
Each photon carries energy:
\[E = h\nu = \frac{hc}{\lambda}\]
- \(h = 6.626 \times 10^{-34}\ \mathrm{J \cdot s}\) (Planck’s constant)
- \(\nu\) = frequency (Hz), \(\lambda\) = wavelength (m), linked by \(c = \lambda\nu\)
- Shortcut: \(E\ (\mathrm{eV}) \approx 1240 / \lambda\ (\mathrm{nm})\)
Shorter wavelength → higher energy per photon
(high energy) Gamma → X-ray → UV → Visible → IR → Radio (low energy)
Predict: Hotter objects peak at shorter \(\lambda\) — do they emit more energetic photons?
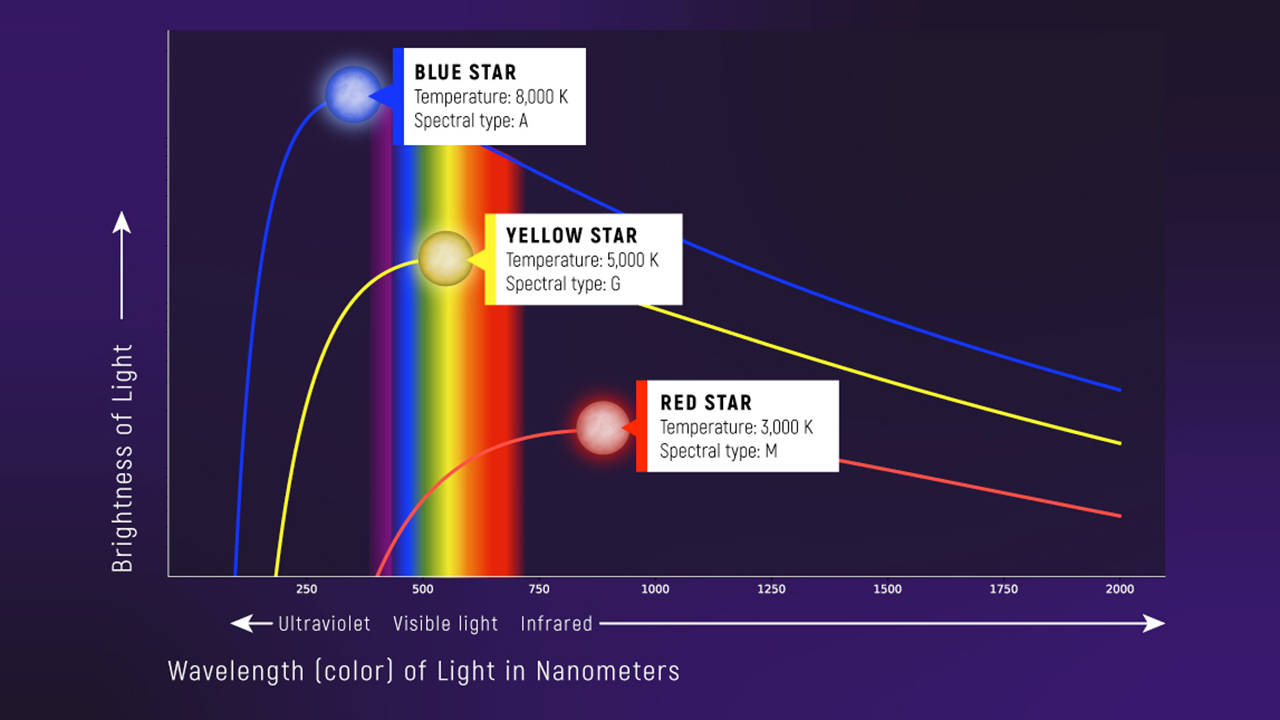
The Blackbody Spectrum
- Hotter \(\to\) peak shifts to shorter wavelengths (bluer)
- Hotter \(\to\) curve is taller (more total energy)
Both Wien’s Law and Stefan-Boltzmann are visible in these curves.
Why Stars Are (Nearly) Blackbodies
- Stars are opaque — photons interact many times before escaping
- Those interactions thermalize the radiation
- The light we see comes from the photosphere — characterized by temperature
Real stellar spectra have spectral lines on top of the blackbody continuum — we’ll use those in Lecture 9.
Quick Check: Blackbody Concept
A blackbody’s emission spectrum depends on:
- What the object is made of
- The object’s color and reflectivity
- Only the object’s temperature
- The type of EM wave hitting it
Predict First!
If you double an object’s temperature (in Kelvin), its peak wavelength…
Wien’s Displacement Law
\[\lambda_{\text{peak}} = \frac{2.9 \times 10^6\,\mathrm{nm\cdot K}}{T\,(\mathrm{K})}\]
Hotter objects peak at shorter wavelengths.
This is the astronomer’s thermometer:
Measure peak wavelength \(\to\) know the temperature.
Wien’s Law in Action
| Cool red star |
3000 K |
~970 nm |
Near-infrared |
| Sun |
5800 K |
~500 nm |
Green visible |
| Hot white star |
10,000 K |
~290 nm |
Ultraviolet |
| Hot blue star |
25,000 K |
~120 nm |
Far ultraviolet |
Worked Example
Problem: A star’s spectrum peaks at 290 nm (UV). What is its temperature?
\[T = \frac{2.9 \times 10^6\,\mathrm{nm\cdot K}}{290\,\mathrm{nm}} = 10^4\,\mathrm{K}\]
This is a hot, blue-white star — about \(1.7\times\) the Sun’s temperature.
Quick Check: Wien’s Law
A cool red star has a surface temperature of 3000 K. Where does its spectrum peak?
- 100 nm (ultraviolet)
- 500 nm (visible green)
- 970 nm (near-infrared)
- 10,000 nm (far infrared)
🖥️ Live Demo: Blackbody Radiation
The “Sun Is Green” Puzzle
Plug in the Sun’s temperature (5800 K):
\[\lambda_{\text{peak}} = \frac{2.9 \times 10^6\,\mathrm{nm\cdot K}}{5800\,\mathrm{K}} = 500\,\mathrm{nm}\]
That’s green light!
Yet the Sun doesn’t look green…
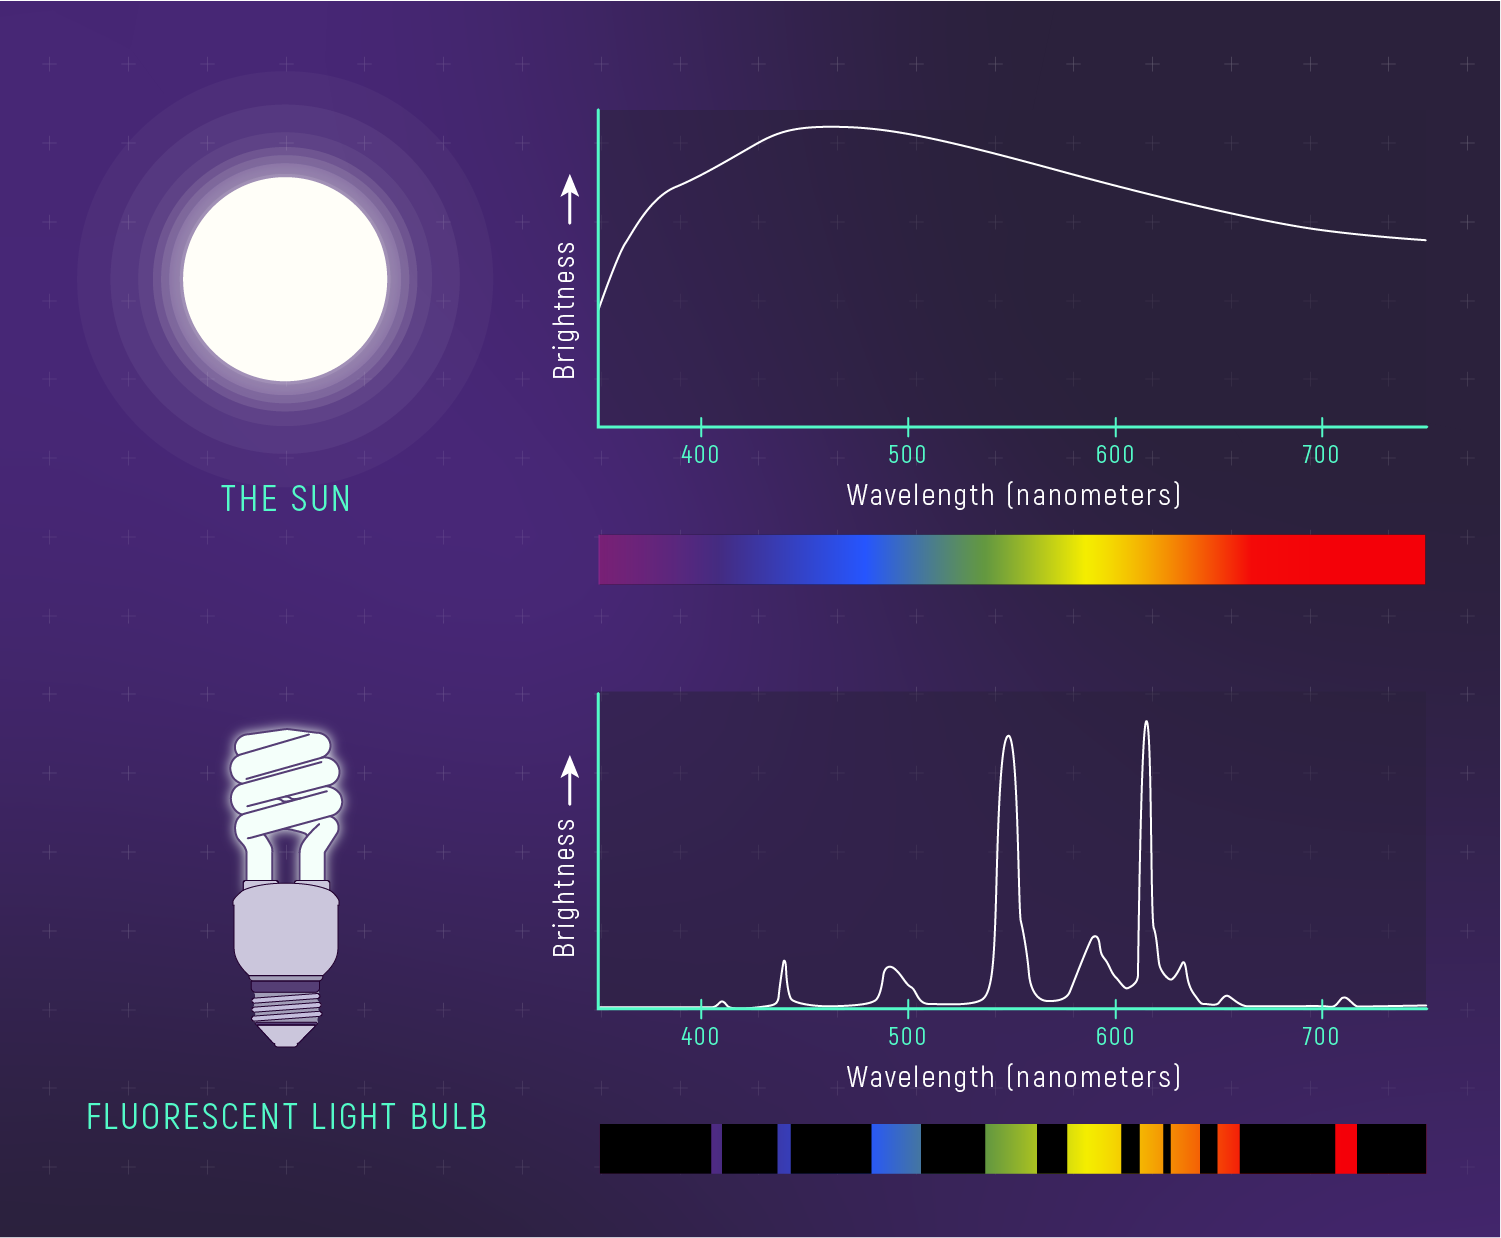
The Sun’s Spectrum Is Broad
The peak is near green, but the curve spans the full visible band.
Why the Sun Isn’t Green
1. Blackbody curves are broad.
The Sun emits across ALL visible wavelengths — not just the peak.
2. Our eyes see the mix as white.
When all colors are present, we perceive white light.
If the Sun emitted ONLY at 500 nm, it would look green.
But blackbody spectra are continuous and broad.
Quick Check: Why Not Green?
The Sun’s blackbody spectrum peaks at ~500 nm (green). Why doesn’t the Sun appear green?
- The Sun doesn’t actually emit green light
- Earth’s atmosphere absorbs all the green
- The Sun emits broadly across all visible wavelengths; we see white
- Our eyes can’t see green light
Star Colors = Temperatures
| Red/orange |
3000–4500 K |
Betelgeuse, Antares |
| Yellow |
5000–6000 K |
Sun, Alpha Centauri A |
| White |
7000–10,000 K |
Sirius A, Vega |
| Blue-white |
10,000–30,000+ K |
Rigel, Spica |
Wien’s Law in action: color reveals temperature.
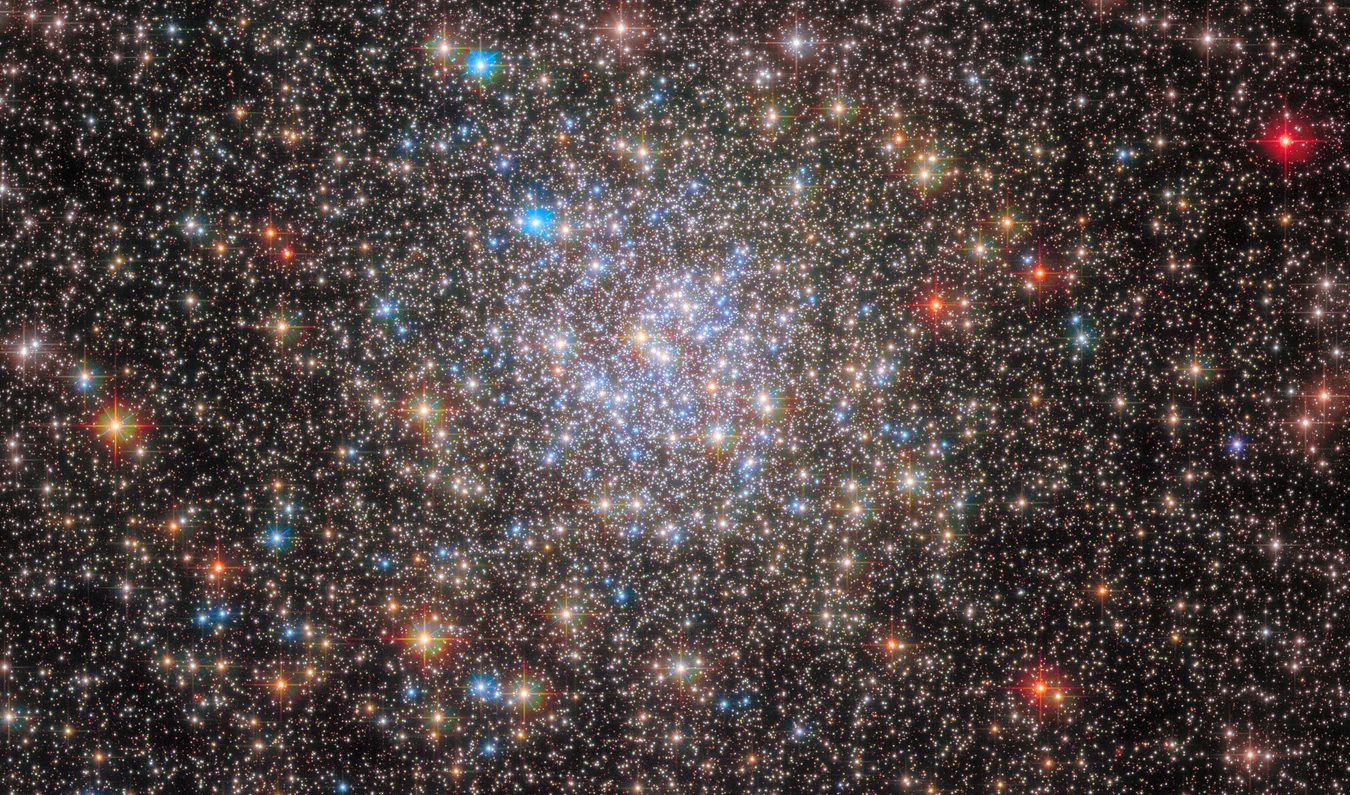
Star Colors in the Wild: NGC 6355
In this Hubble image of globular cluster NGC 6355, each star’s color tells its temperature — Wien’s Law in one glance.
Quick Check: Star Colors
Rank these stars from coolest to hottest: Rigel (blue-white), Betelgeuse (red), Sun (yellow-white).
- Rigel, Sun, Betelgeuse
- Betelgeuse, Sun, Rigel
- Sun, Betelgeuse, Rigel
- They’re all the same temperature
Observable → Model → Inference
The astronomer’s thermometer:
Observable: A star’s spectrum peaks at 580 nm (yellow-orange light).
Model: Wien’s Law — \(\lambda_{\text{peak}}\,(\mathrm{nm}) = 2.9 \times 10^6\,\mathrm{nm\cdot K}\, / \, T\,(\mathrm{K})\)
Inference: \(T = 2.9 \times 10^6\,\mathrm{nm\cdot K}\, / \, 580\,\mathrm{nm} = 5000\,\mathrm{K}\). Slightly cooler than the Sun.
No thermometer. No contact. Just light carrying information across the cosmos.
Part 3: Stefan-Boltzmann Law
Temperature and luminosity
Remember the Demo?
When you raised the temperature, two things happened:
- The peak shifted left — that was Wien’s Law (Part 2)
- The curve got much taller — that’s what we’ll quantify now
How much taller? The answer is dramatic.
Predict First!
If you double an object’s temperature, its total energy output…
Stefan-Boltzmann Law
\[\text{Power per area} = \sigma T^4\]
Temperature has a HUGE effect on luminosity.
\(\sigma = 5.67 \times 10^{-8}\ \mathrm{W\,m^{-2}\,K^{-4}}\) (Stefan-Boltzmann constant). Use \(T\) in Kelvin.
The fourth power is dramatic:
| \(2\times\) hotter |
\(2^4 = 16\times\) more luminous |
| \(3\times\) hotter |
\(3^4 = 81\times\) more luminous |
| \(10\times\) hotter |
\(10^4 = 10,000\times\) more luminous |
Quick Check: Stefan-Boltzmann
Star A has twice the surface temperature of Star B. If both have the same radius, Star A is:
- \(2\times\) more luminous
- \(4\times\) more luminous
- \(8\times\) more luminous
- \(16\times\) more luminous
The L-T-R Connection
\[L = 4\pi R^2 \sigma T^4\]
Luminosity depends on both size (\(R^2\)) and temperature (\(T^4\)).
\(L\) = luminosity (W), \(R\) = radius (m), \(T\) = surface temperature (K), \(\sigma = 5.67 \times 10^{-8}\ \mathrm{W\,m^{-2}\,K^{-4}}\).
A star can be luminous because:
- It’s very hot (even if small)
- It’s very large (even if cool)
- Or both!
How Many Light Bulbs?
The Sun’s luminosity: \(L_\odot = 3.84 \times 10^{26}\) W
A typical LED bulb: 10 W
Number of bulbs to match the Sun:
\[N = \frac{3.84 \times 10^{26}\,\mathrm{W}}{10\,\mathrm{W}} = 3.84 \times 10^{25} \text{ bulbs}\]
That’s 38 trillion trillion LED bulbs!
Or about 5 billion bulbs for every human who has ever lived.
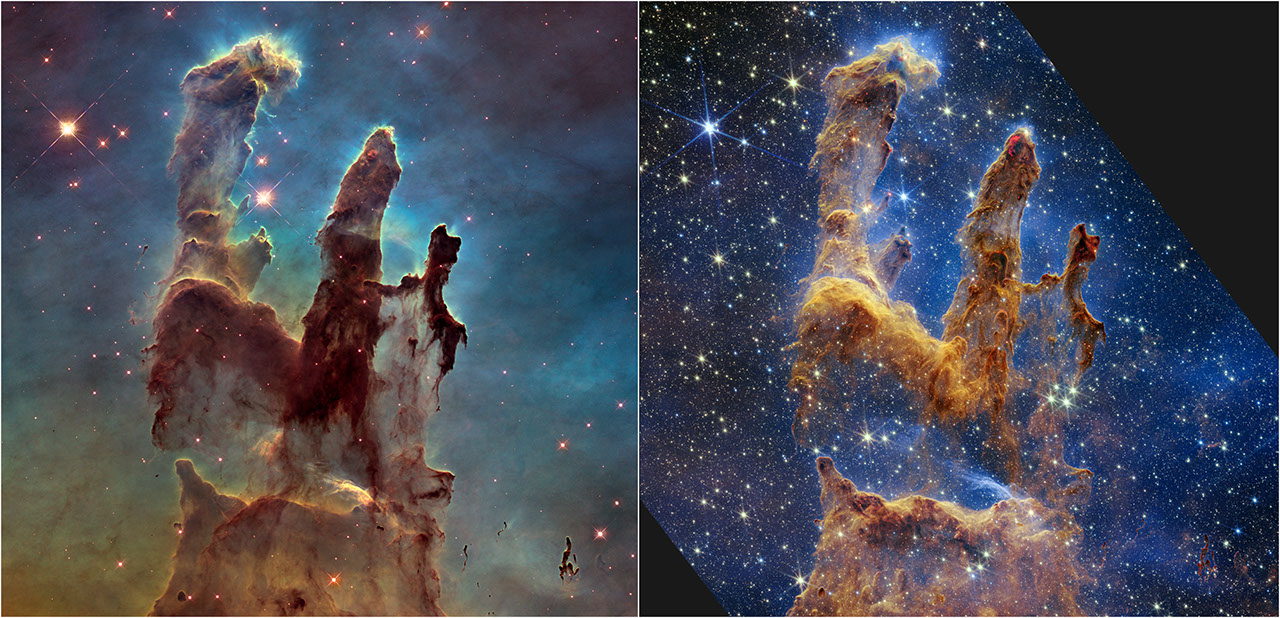
The Pillars of Creation: Wien’s Law in Action
Left: Hubble (visible) — Right: Webb (near-IR)
- Glowing gas (~10,000 K) → peaks in visible
- Dust pillars (~20–50 K) → opaque here
- Newborn stars (~3,000 K) → peaks in near-IR
Wien’s Law told astronomers where to look. Stefan-Boltzmann told them what they’d find.
Same Temperature, Different Luminosity
Two stars at the same temperature but different luminosities…
must have different sizes.
If Star A and Star B have the same \(T\) but Star A is \(100\times\) more luminous…
Then Star A has \(10\times\) the radius (since \(L \propto R^2\)).
This is how we distinguish giants from dwarfs.
Betelgeuse is a red giant — same color as red dwarfs, but ~\(1000\times\) the radius.
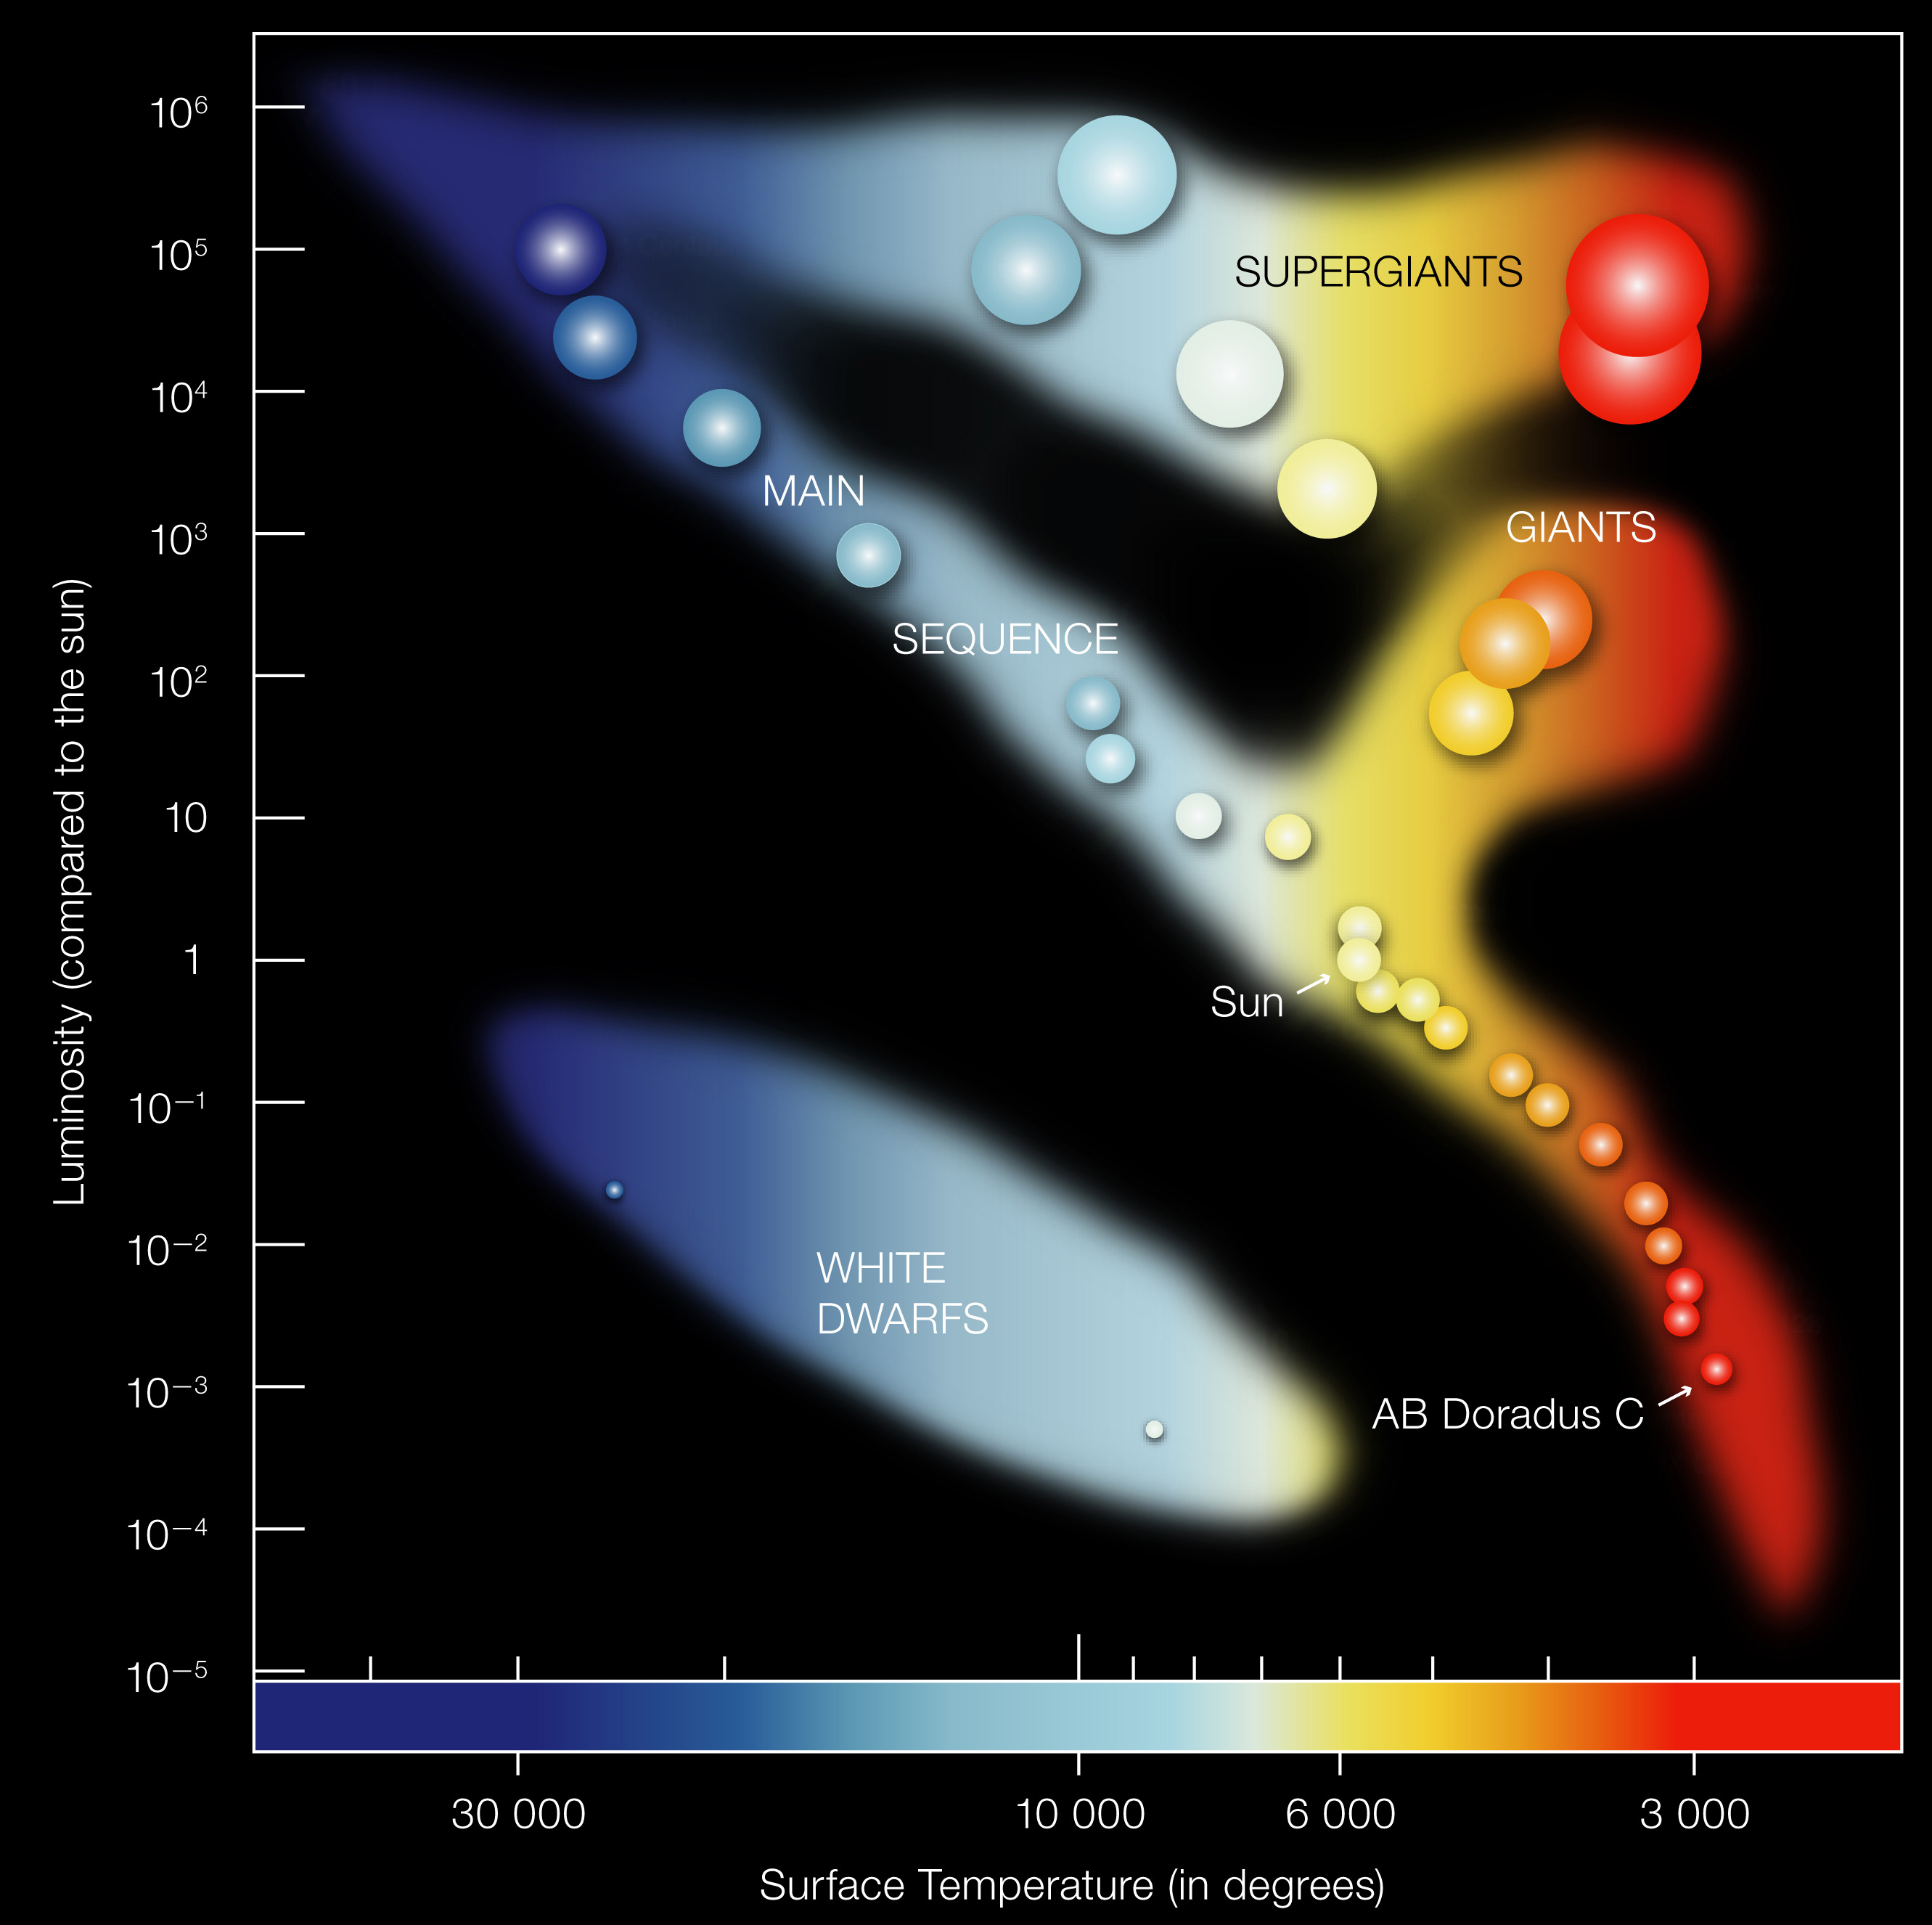
Preview: The H-R Diagram
Temperature (\(x\)-axis) vs. luminosity (\(y\)-axis). The L-T-R relationship organizes all of stellar astrophysics.
Worked Example
Problem: Two stars have the same temperature. Star A has \(100\times\) the luminosity of Star B. How do their radii compare?
Since \(L \propto R^2 T^4\) and \(T\) is the same:
\[\frac{R_A}{R_B} = \left(\frac{L_A}{L_B}\right)^{1/2} = 100^{1/2} = 10\]
Star A has \(10\times\) the radius of Star B.
Quick Check: Giants vs Dwarfs
A red giant and a red dwarf have the same surface temperature. The giant is \(10^4\) times more luminous. How do their radii compare?
- Giant’s radius is \(10\times\) the dwarf’s
- Giant’s radius is \(100\times\) the dwarf’s
- Giant’s radius is \(10^4\) times the dwarf’s
- Their radii are the same
Quick Check: L-T-R Synthesis
Star X is twice as hot as Star Y and has half the radius. How does Star X’s luminosity compare?
- Same luminosity
- \(2\times\) more luminous
- \(4\times\) more luminous
- \(8\times\) more luminous
Part 4: The Astronomer’s Shortcut
Ratios and solar units
Working in Solar Units
The L-T-R equation has constants (\(4\pi\), \(\sigma\)) that are awkward to use. But there’s a trick:
Write the equation for any star:
\[L_{\star} = 4\pi R_{\star}^2 \sigma T_{\star}^4\]
Write the same equation for the Sun:
\[L_\odot = 4\pi R_\odot^2 \sigma T_\odot^4\]
Divide star by Sun — constants cancel!
\[\frac{L_{\star}}{L_\odot} = \left(\frac{R_{\star}}{R_\odot}\right)^2 \left(\frac{T_{\star}}{T_\odot}\right)^4\]
Why This Works
\[\frac{L}{L_\odot} = \left(\frac{R}{R_\odot}\right)^2 \left(\frac{T}{T_\odot}\right)^4\]
What happened?
- \(4\pi\) canceled
- \(\sigma\) canceled
- We only need ratios — no SI units, no scientific notation!
This works because \(4\pi\) and \(\sigma\) are the same for every star. The physics is in the ratios.
Worked Example: Sirius A
Problem: Sirius A is \(25\times\) more luminous than the Sun and has \(T = 9940\,\mathrm{K}\) (\(T_\odot = 5800\,\mathrm{K}\)). What’s its radius?
\[\frac{L}{L_\odot} = 25 = \left(\frac{R}{R_\odot}\right)^2 \left(\frac{9940\,\mathrm{K}}{5800\,\mathrm{K}}\right)^4\]
\[25 = \left(\frac{R}{R_\odot}\right)^2 \times (1.71)^4 = \left(\frac{R}{R_\odot}\right)^2 \times 8.6\]
\[\left(\frac{R}{R_\odot}\right)^2 = \frac{25}{8.6} = 2.9 \quad \Rightarrow \quad \frac{R}{R_\odot} = 2.9^{1/2} = 1.7\]
Sirius A is \(1.7\times\) the Sun’s radius — hot and slightly larger.
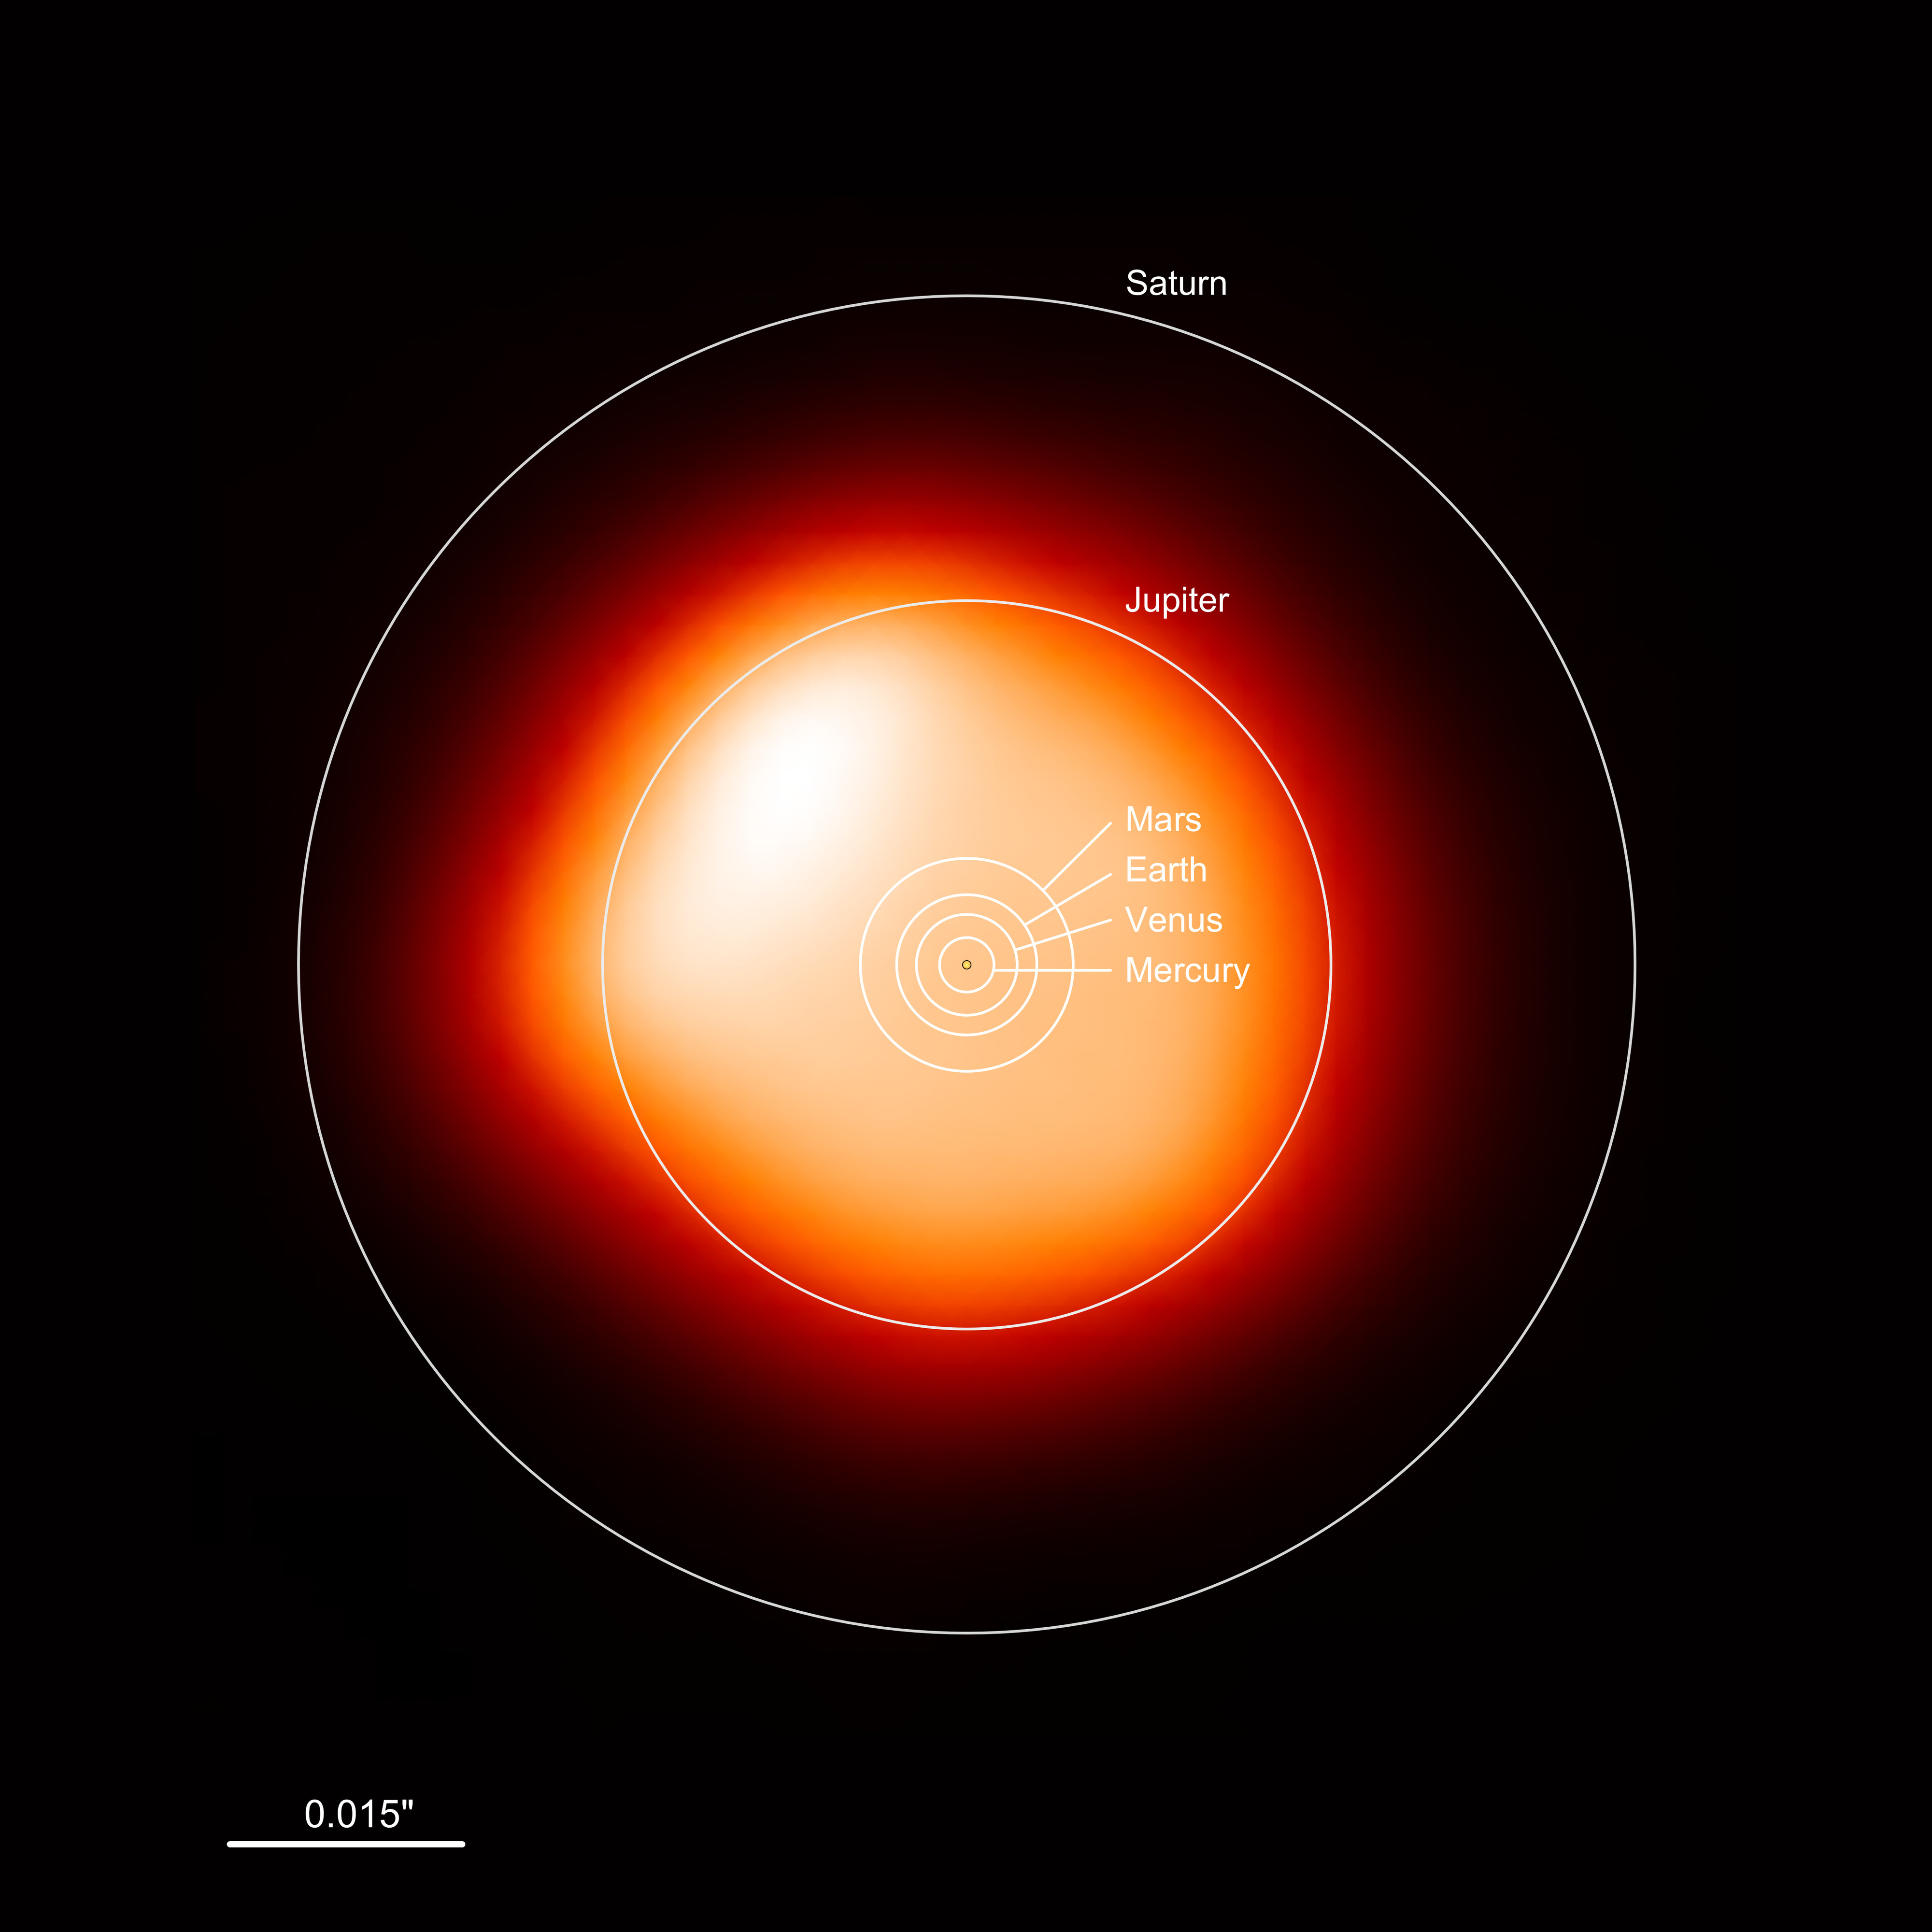
Worked Example: Betelgeuse
Problem: Betelgeuse has \(T \approx 3500\,\mathrm{K}\) and \(L \approx 10^5\,L_\odot\). How big is it?
\[\frac{L}{L_\odot} = 10^5 = \left(\frac{R}{R_\odot}\right)^2 \left(\frac{3500\,\mathrm{K}}{5800\,\mathrm{K}}\right)^4\]
\[10^5 = \left(\frac{R}{R_\odot}\right)^2 \times (0.60)^4 = \left(\frac{R}{R_\odot}\right)^2 \times 0.13\]
\[\left(\frac{R}{R_\odot}\right)^2 = \frac{10^5}{0.13} \approx 7.7 \times 10^5\]
\[\frac{R}{R_\odot} = (7.7 \times 10^5)^{1/2} \approx \mathbf{880}\]
Betelgeuse is ~880 times the Sun’s radius (~4 AU). It would swallow Mars and the entire asteroid belt!
Quick Check: The Ratio Method
A star is \(3\times\) hotter than the Sun and has the same radius. Using the ratio method, how luminous is it compared to the Sun?
- \(3\times\) more luminous
- \(9\times\) more luminous
- \(81\times\) more luminous
- \(27\times\) more luminous
Observable → Model → Inference
The astronomer’s tape measure:
Observable: Betelgeuse appears red (peak in near-IR) and is \(100{,}000\times\) more luminous than the Sun.
Model: \(L/L_\odot = (R/R_\odot)^2 (T/T_\odot)^4\) — the ratio method.
Inference: Betelgeuse must be ~880× the Sun’s radius. A cool but enormous star.
No ruler. No spacecraft. Just light and one equation — with all constants canceled.
Part 5: Where Does the Curve Come From?
We’ve used the blackbody curve all lecture — but in 1900, it was physics’ most embarrassing failure.
The Ultraviolet Catastrophe
The problem (circa 1900):
Classical physics predicted that a hot object should emit infinite energy at short wavelengths!
Classical prediction (Rayleigh-Jeans):
\[B(\lambda) \propto \frac{T}{\lambda^4}\]
As \(\lambda \to 0\), energy \(\to \infty\). Obviously wrong!
This was called the “ultraviolet catastrophe” — classical physics broke down.
Planck’s Quantum Solution (1900)
Max Planck’s radical idea:
Energy isn’t continuous — it comes in discrete packets: quanta.
\[E = nh\nu\]
where \(n = 0, 1, 2, 3, ...\) (integers only!)
Why this fixes the catastrophe:
At short wavelengths, \(h\nu\) is large.
Creating even ONE quantum requires lots of energy.
At finite temperature, high-energy quanta are exponentially suppressed.
The Model Behind the Curve
You don’t need to memorize this equation. But it’s worth seeing — this single formula produces every blackbody curve you’ve explored in the demo.
\[B_\lambda(T) = \frac{2hc^2}{\lambda^5} \times \frac{1}{e^{hc/\lambda k_B T} - 1}\]
This is the Planck function — temperature is the ONLY variable.
- At long wavelengths: matches classical predictions
- At short wavelengths: exponentially suppressed (no catastrophe!)
- Wien’s Law and Stefan-Boltzmann both emerge from this one equation
When you move the temperature slider in the demo, you’re watching the Planck function respond.
Birth of Quantum Mechanics
Planck’s solution (1900) required \(E = h\nu\).
Einstein (1905) showed light itself comes in quanta: photons.
Bohr (1913) showed atoms have quantized energy levels.
Heisenberg & Schrödinger (1925–26) developed full quantum mechanics.
The blackbody problem launched the quantum revolution!
Trying to understand why hot things glow the way they do led to the theory that governs atoms, chemistry, and modern technology.
🖥️ Explore: Spectrum of Altair
Key Takeaways
Everything above absolute zero emits thermal radiation. Hotter \(\to\) more and at shorter wavelengths.
Blackbody spectrum depends only on temperature.
Wien’s Law: \(\lambda_{\text{peak}}\,(\mathrm{nm}) = 2.9 \times 10^6\,\mathrm{nm\cdot K}\, / \, T\,(\mathrm{K})\). Hot \(\to\) blue. Cool \(\to\) red.
The Sun peaks at green but appears white because it emits broadly.
Stefan-Boltzmann: Power per area \(\propto T^4\). Doubling \(T\) \(\to\) \(16\times\) more luminous.
L-T-R: \(L = 4\pi R^2 \sigma T^4\). Use the ratio method to skip the constants.
The Planck function is the model behind every blackbody curve — it launched quantum mechanics.
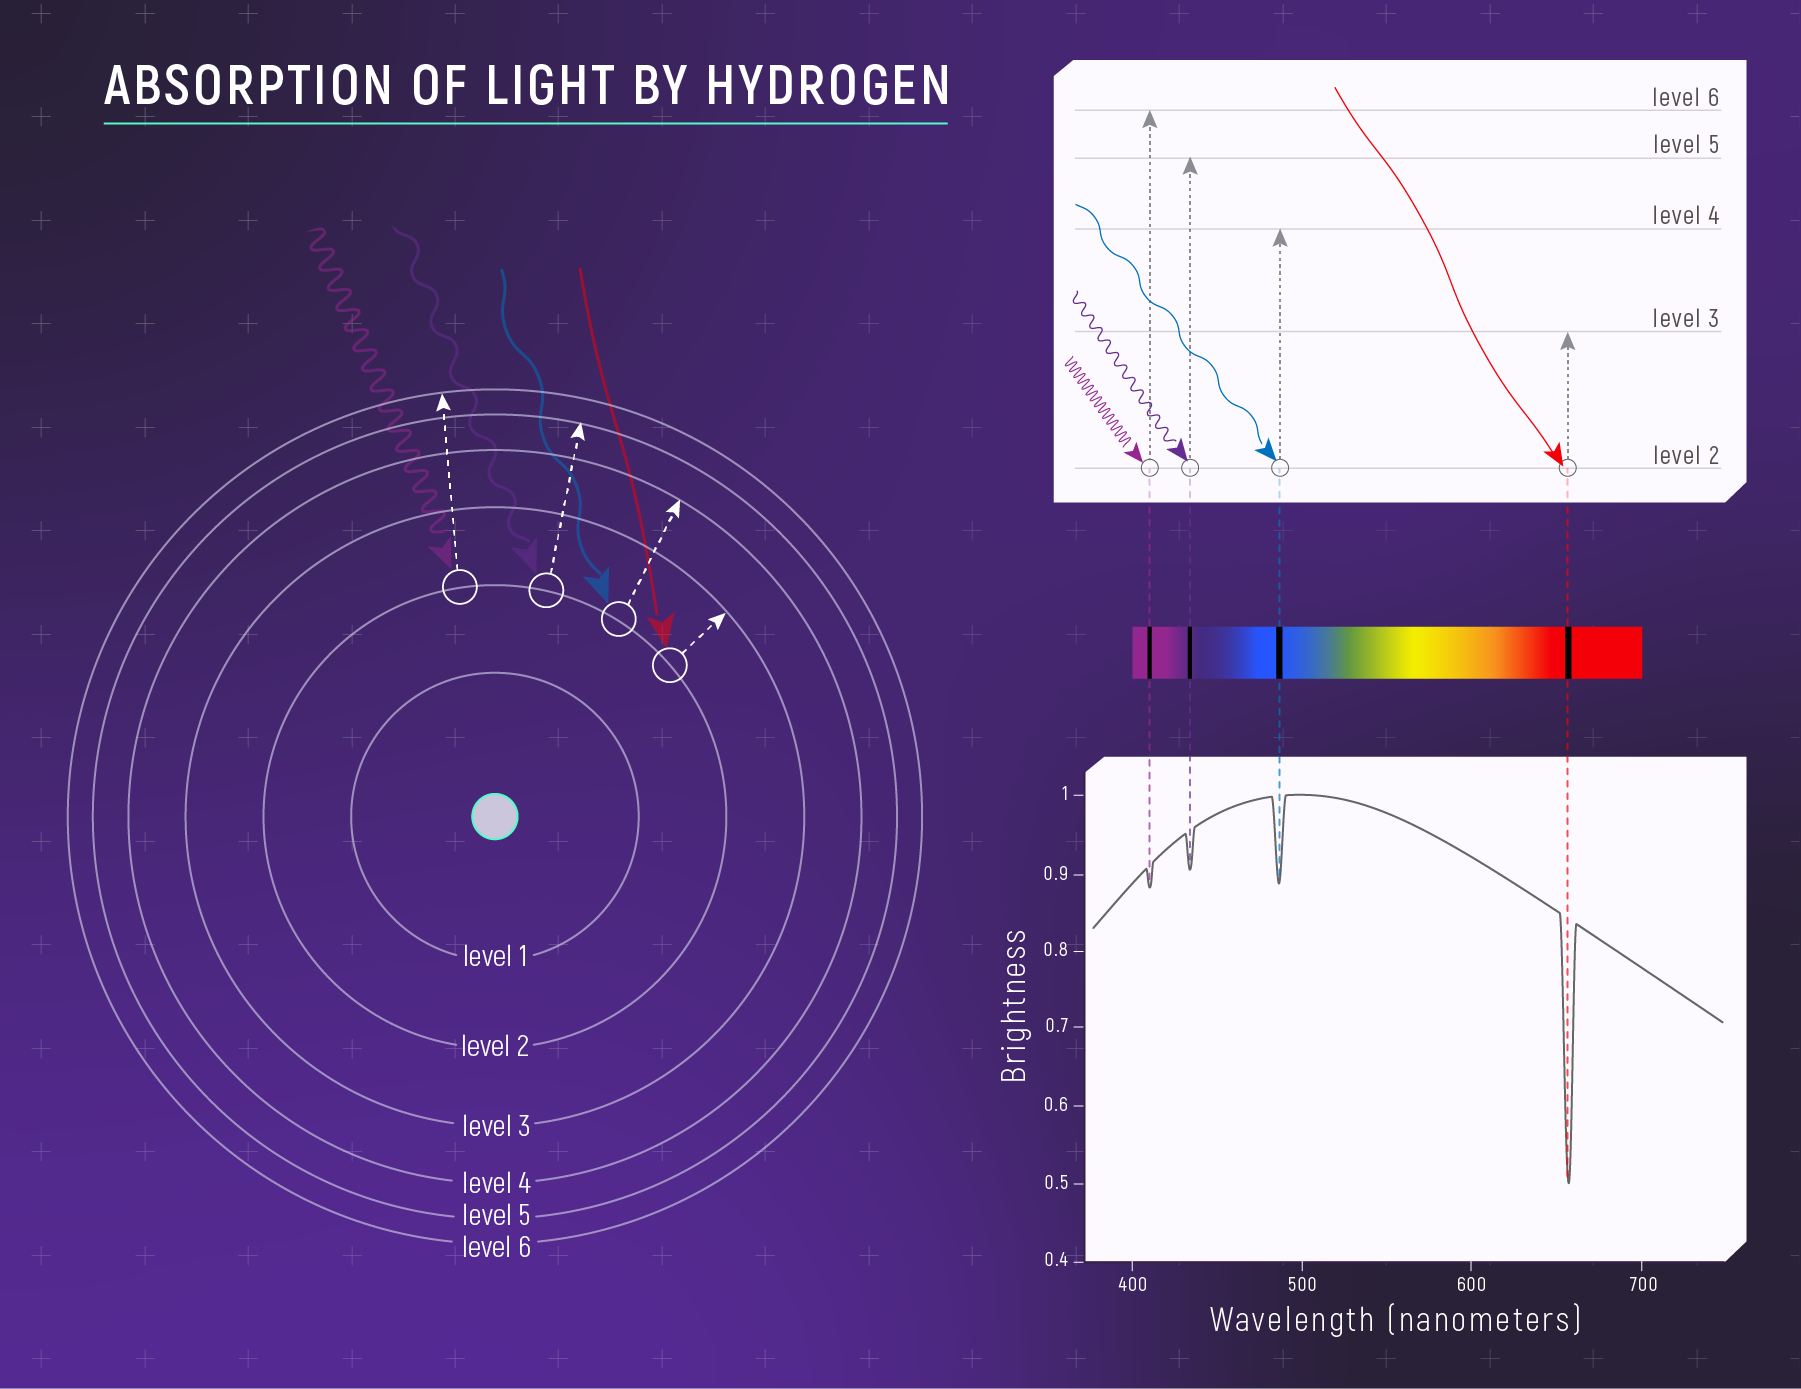
Coming Up: Spectral Lines
Next lecture: Spectral lines — the chemical fingerprints.
Blackbodies tell us temperature.
Spectral lines tell us composition and motion.
Reading: Lecture 9 Reading Companion
Demos: Blackbody Radiation | EM Spectrum
Spectral Lines Preview: Absorption vs Emission
Same element, same line wavelengths, different physical setup.
Questions?
Temperature is written in light.
Wien’s Law + Stefan-Boltzmann + the ratio method = the astronomer’s thermometer.