Decoding Starlight
Spectral Lines and Chemical Fingerprints
February 18, 2026
Join iClicker

If you can’t scan: open the link and enter the course code ASES.
The Missing Colors
In 1814, Joseph von Fraunhofer found dark lines crossing the Sun’s spectrum.
Specific wavelengths where light was missing.

Chemical Fingerprints
Each chemical element absorbs and emits at unique wavelengths.
The pattern is like a barcode — match it, identify the element.
This is how we know what stars are made of, from 150 million km away.
Today’s Learning Objectives
By the end of today, you’ll be able to:
- Describe how emission and absorption spectra form (Kirchhoff’s Laws)
- Explain why spectra have discrete lines (quantized energy levels)
- Apply the hydrogen energy level formula to predict line wavelengths
- Identify the OBAFGKM spectral sequence and its temperature basis
- Explain why hydrogen lines are strongest in A-type stars
Part 1: Three Types of Spectra
Kirchhoff’s Laws
Predict First!
You observe light from a hot, dense source that passes through a cooler, thin gas on its way to you. What kind of spectrum do you expect?
- Continuous (smooth rainbow)
- Emission lines (bright lines on dark)
- Absorption lines (dark lines on bright)
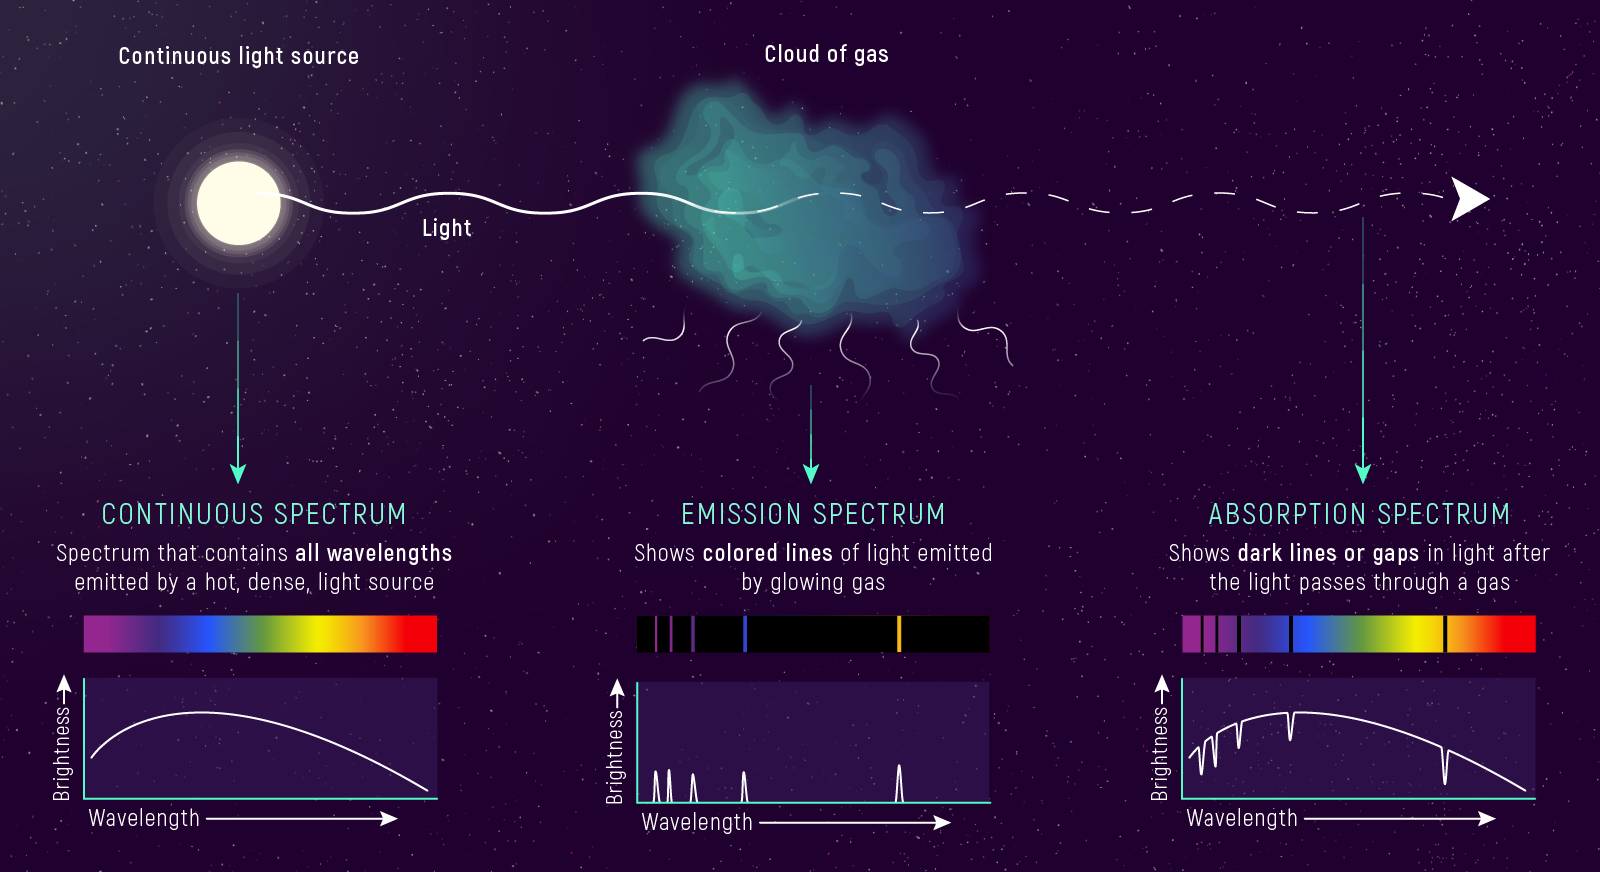
Kirchhoff’s Three Laws
1. Continuous Spectrum
Hot, dense object → light at all wavelengths (smooth rainbow)
2. Emission Spectrum
Hot, thin gas → light at specific wavelengths only (bright lines on dark)
3. Absorption Spectrum
Cool gas in front of hot source → dark lines on bright rainbow
Why Stars Have Absorption Lines
- Hot interior (dense) → continuous blackbody spectrum (the Planck curve from last lecture!)
- Cooler outer atmosphere (thin gas) → absorbs specific wavelengths
- What we see: that smooth blackbody rainbow, but with dark lines carved into it
The pattern of dark lines tells us which elements are in the star’s atmosphere.
Quick Check: Kirchhoff’s Laws
The dark lines in the Sun’s spectrum are caused by:
- The Sun’s core being too cool to emit those wavelengths
- Cool gas in the Sun’s outer atmosphere absorbing specific wavelengths
- Earth’s atmosphere blocking the light
- The Sun rotating and shifting the wavelengths
🖥️ Live Demo: Spectral Lines Lab
What Did You Notice?
Think-Pair-Share (~90 seconds)
Turn to your neighbor and discuss:
“Could you identify an element from just one spectral line? Why or why not?”
No — different elements can share individual wavelengths. The full pattern of lines is the fingerprint, like a barcode. You need multiple lines to make a unique match.
Each Element Has a Unique Pattern
| Element | Signature Lines |
|---|---|
| Hydrogen | 656 nm (red), 486 nm (blue-green), 434 nm (violet)… |
| Sodium | Bright yellow doublet at 589 nm |
| Calcium | Violet H and K lines (397, 393 nm) |
| Iron | Hundreds of lines throughout visible |
Match the pattern → identify the element.
Quick Check: Element Identification
How do astronomers determine which elements are present in a star?
- By measuring the star’s temperature
- By matching the pattern of spectral lines to laboratory measurements
- By observing the star’s color
- By measuring how bright the star is
Part 2: Why Discrete Lines?
The deepest puzzle in spectroscopy
The Puzzle
Why do atoms absorb and emit at specific wavelengths only?
Why not a continuous range?
Classical physics couldn’t explain this.
The answer required a revolution: quantum mechanics.
Energy Is Quantized
Electrons can only occupy specific energy levels — like rungs on a ladder, not a ramp.
To move between levels, an electron must absorb or emit a photon with exactly the right energy.
Specific energies → specific wavelengths → discrete lines.
The Ladder Analogy
You can stand on the rungs, never between them.
Electrons in atoms are the same — discrete levels only.
Photon Energy and Wavelength
\[E_{photon} = \frac{hc}{\lambda}\]
\(h\) is Planck’s constant, \(c\) is the speed of light, and \(\lambda\) is wavelength. Shorter \(\lambda\) means higher photon energy.
Higher energy ↔︎ shorter wavelength
Lower energy ↔︎ longer wavelength
The photon energy must exactly match the gap between two levels.
Hydrogen Energy Levels
\[E_n = -\frac{13.6 \text{ eV}}{n^2}\]
where \(n = 1, 2, 3, ...\)
| Level | Energy |
|---|---|
| \(n=1\) (ground) | -13.6 eV |
| \(n=2\) | -3.4 eV |
| \(n=3\) | -1.51 eV |
| \(n=4\) | -0.85 eV |
| \(n=\infty\) (ionized) | 0 eV |
Levels get closer together as \(n\) increases.
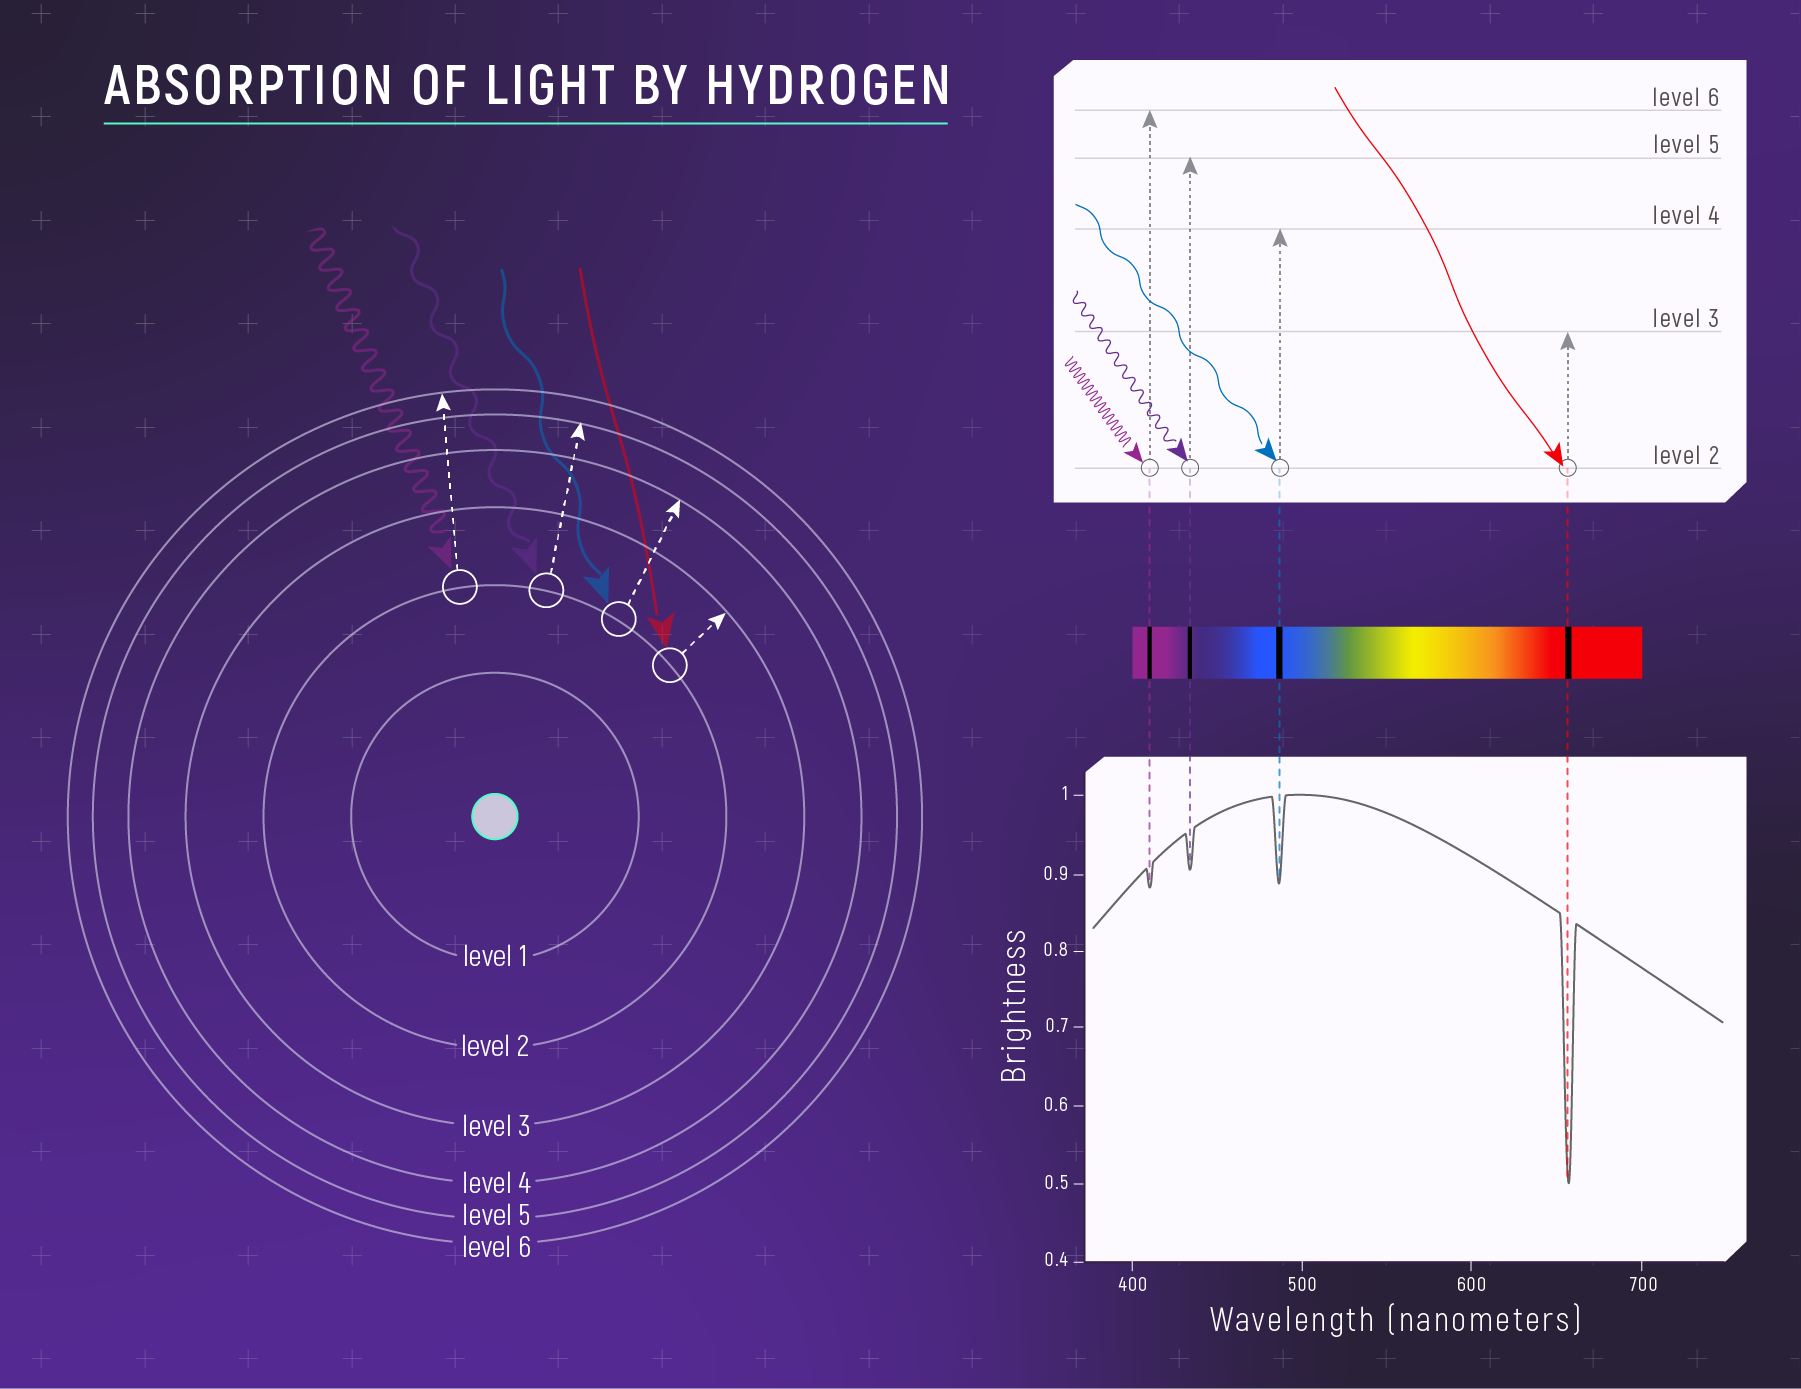
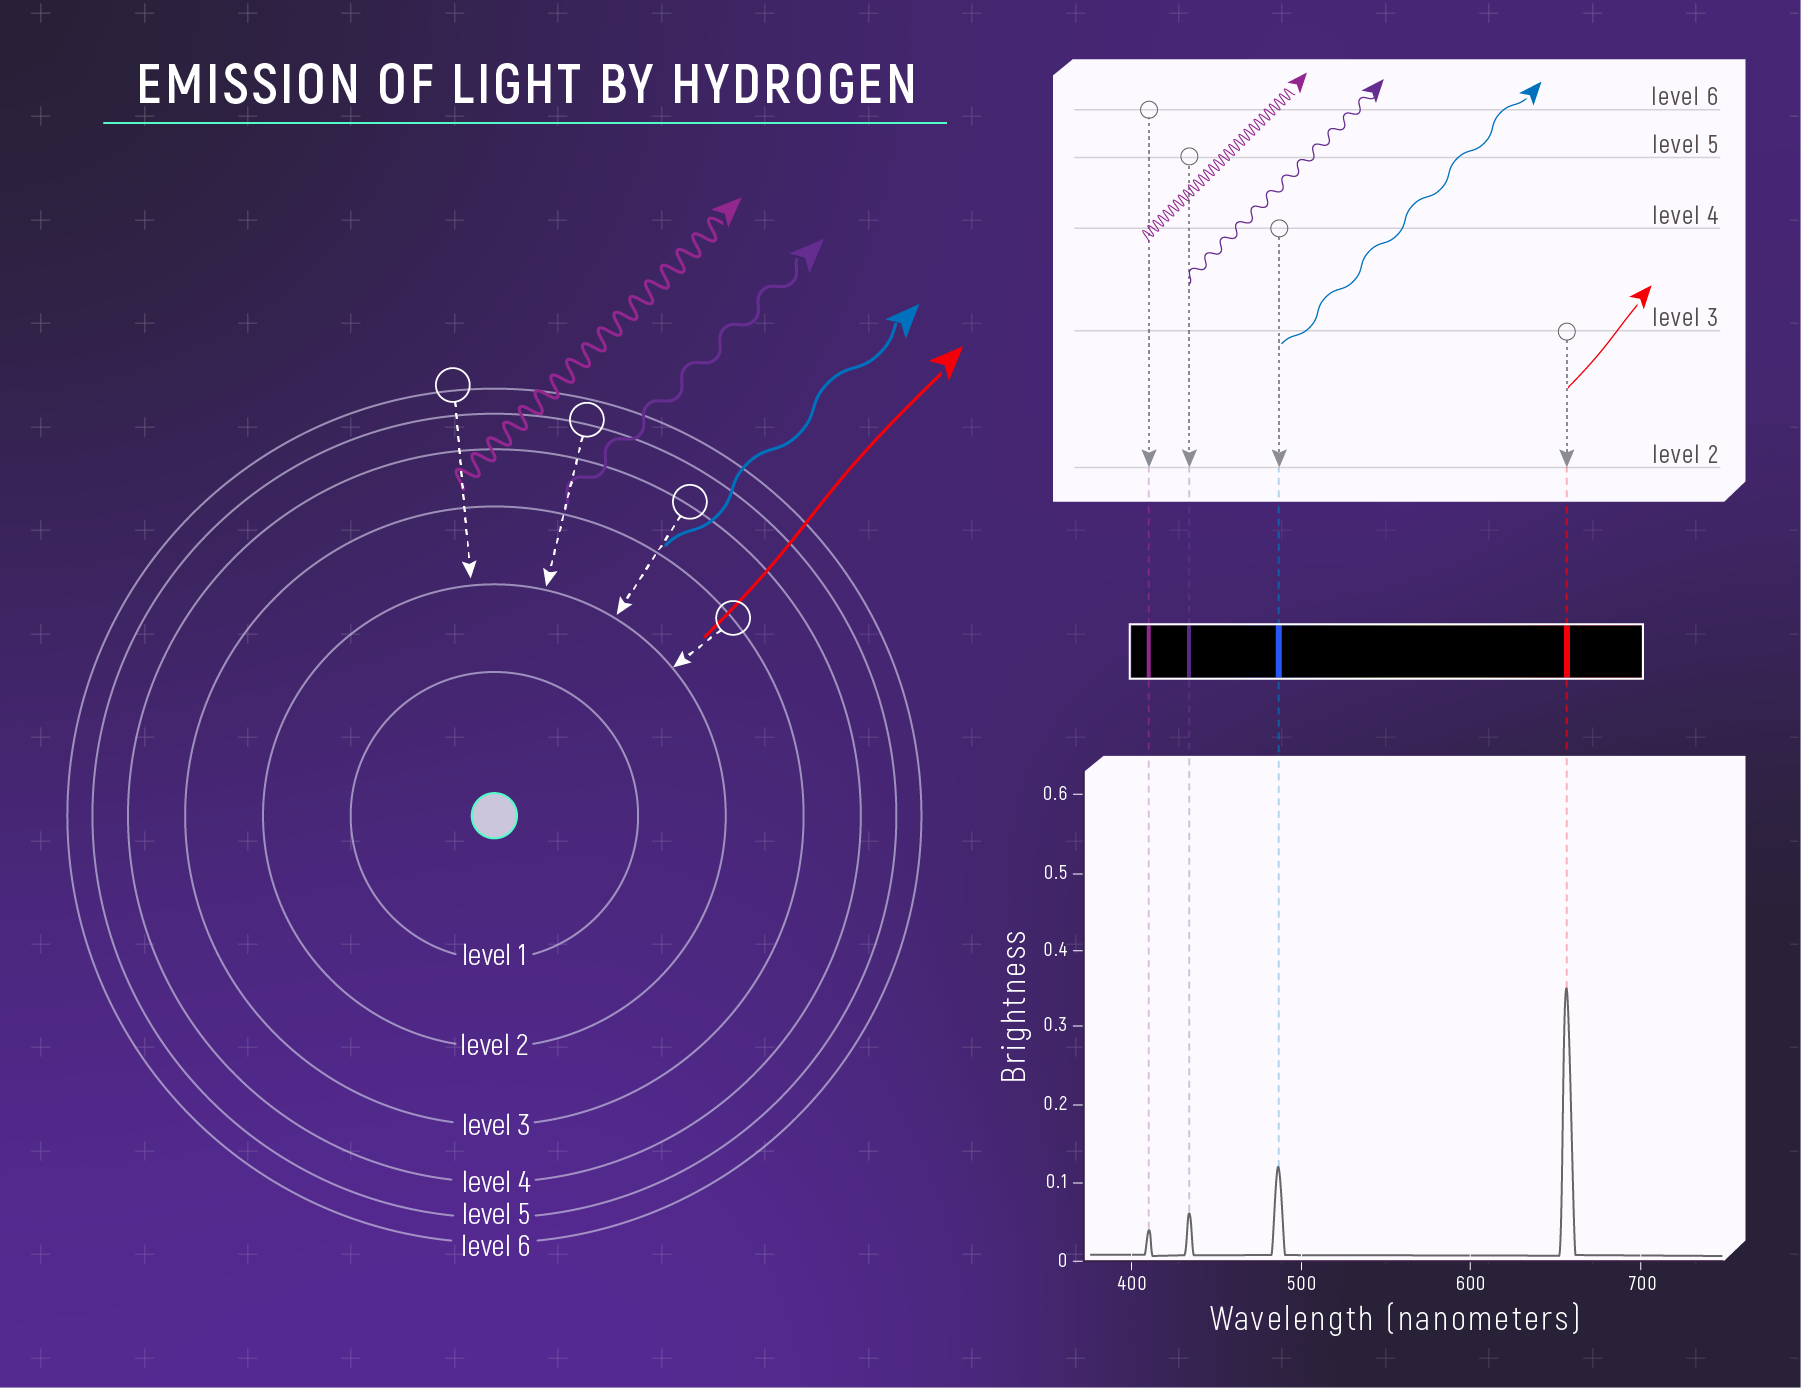
The Balmer Series (Visible Lines)
Transitions ending at n = 2 produce visible light:
| Transition | Wavelength | Color | Name |
|---|---|---|---|
| 3 → 2 | 656 nm | Red | Hα |
| 4 → 2 | 486 nm | Blue-green | Hβ |
| 5 → 2 | 434 nm | Violet | Hγ |
| 6 → 2 | 410 nm | Violet | Hδ |
Hα is the famous red hydrogen line — why nebulae glow pinkish-red.
Worked Example: Calculating Hα
Problem: Calculate the wavelength when a hydrogen electron drops from n=3 to n=2.
\[E_3 = -\frac{13.6}{9} = -1.51 \text{ eV}\] \[E_2 = -\frac{13.6}{4} = -3.4 \text{ eV}\]
\[E_{photon} = E_3 - E_2 = -1.51 - (-3.4) = 1.89 \text{ eV}\]
\[\lambda = \frac{1240}{1.89} = 656 \text{ nm}\]
Quick Check: Hydrogen Transitions
Which transition produces the shortest wavelength (highest energy) photon?
- n = 2 → n = 1
- n = 3 → n = 2
- n = 4 → n = 3
- n = 5 → n = 4
Largest energy gap → highest energy photon → shortest wavelength.
Quick Check: Why Discrete Lines?
Spectral lines are discrete (specific wavelengths only) because:
- Telescopes can only detect certain wavelengths
- Atoms can only absorb red, green, and blue light
- Electrons in atoms can only occupy specific quantized energy levels
- Light travels at a constant speed
Part 3: Stellar Classification
OBAFGKM
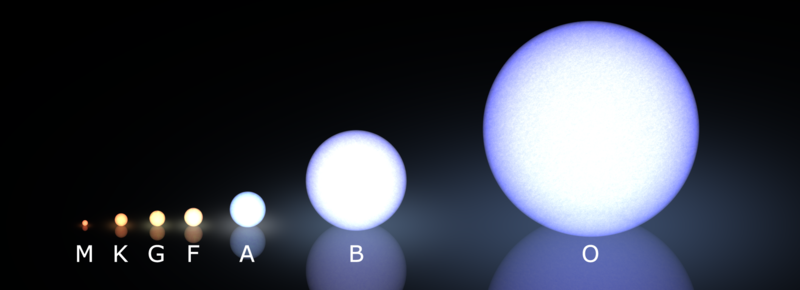
The OBAFGKM Sequence
O - B - A - F - G - K - M
Stars classified by surface temperature:
O = hottest (blue) → M = coolest (red)
Mnemonic: “Oh Be A Fine Girl/Guy, Kiss Me”
Spectral Types
| Type | Color | Temperature | Features |
|---|---|---|---|
| O | Blue | 30,000–50,000+ K | Ionized helium |
| B | Blue-white | 10,000–30,000 K | Neutral helium |
| A | White | 7,500–10,000 K | Strongest H lines |
| F | Yellow-white | 6,000–7,500 K | H + metals |
| G | Yellow | 5,000–6,000 K | Ca, Fe (Sun!) |
| K | Orange | 3,500–5,000 K | Strong metals |
| M | Red | 2,500–3,500 K | Molecular bands |
Real Stellar Spectra
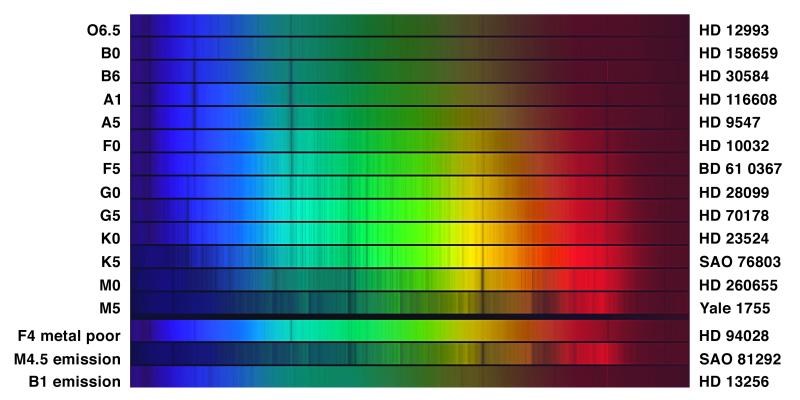
Challenge: Which spectrum shows the strongest hydrogen (Balmer) lines? Why that one and not the hottest?
Quick Check: Spectral Types
A star’s spectrum shows strong calcium and iron lines but no helium lines. Which spectral type is most consistent?
- O or B
- A
- G or K
- This can’t be determined from spectral lines
Helium requires very high temperatures to excite — no He lines rules out O and B. Strong metal lines point to cooler stars (G or K).
Why Do H Lines Peak at A Stars?
Hydrogen is the most abundant element everywhere.
Yet H lines are strongest in A stars (~10,000 K), not the hottest.
Why?
The Ionization Physics
Too Hot (O, B)
H is ionized — no bound electron to absorb.
Too Cool (K, M)
H electrons in ground state — can’t absorb Balmer (need n=2).
Just Right (A)
H neutral + electrons excited to n=2 → maximum Balmer absorption!
Quick Check: Why Weak H in O Stars?
Hydrogen absorption lines are weak in O-type stars because:
- O stars contain very little hydrogen
- O stars are so hot that hydrogen is mostly ionized
- O stars are too cool to excite hydrogen
- O stars have thick atmospheres that block H lines
Observable → Model → Inference
The astronomer’s chemical lab:
Observable: A star’s spectrum shows dark lines at 656 nm, 486 nm, 434 nm, plus lines at 393/397 nm.
Model: Each element absorbs at unique wavelengths (quantum mechanics). OBAFGKM classifies stars by which lines dominate.
Inference: Hydrogen and calcium are present. The line strengths indicate ~10,000 K → A-type star.
No sample. No visit. Just photons and pattern matching — from any distance.
Key Takeaways
Kirchhoff’s Laws: Hot dense → continuous; hot thin → emission; cool gas in front → absorption.
Each element has unique spectral lines — match the pattern, identify the element.
Energy is quantized: Electrons occupy discrete levels → discrete lines.
Hydrogen: \(E_n = -13.6/n^2\) eV. Balmer series (to n=2) gives visible lines.
OBAFGKM: Hot (O, blue) to cool (M, red). H lines peak at A stars due to ionization physics.
Coming Up: The Doppler Effect
Next lecture: What happens when spectral lines shift?
Motion causes Doppler shifts → reveals velocities
- Stellar wobbles → exoplanets
- Galaxy rotation → dark matter
Reading: Lecture 10 Reading Companion
Demos: Spectral Lines Lab | Blackbody Radiation
Numerical Verification
Calculating hydrogen spectral lines from first principles
Hydrogen Energy Levels: Full Calculation
The energy level formula: \(\quad E_n = -\dfrac{13.6 \text{ eV}}{n^2}\)
Calculate the first five levels:
| n | Calculation | Energy (eV) |
|---|---|---|
| 1 | \(-13.6/1^2\) | -13.60 eV |
| 2 | \(-13.6/2^2\) | -3.40 eV |
| 3 | \(-13.6/3^2\) | -1.51 eV |
| 4 | \(-13.6/4^2\) | -0.85 eV |
| 5 | \(-13.6/5^2\) | -0.54 eV |
Why Negative Energies?
Convention: A free electron at rest has \(E = 0\).
- Negative energy = bound to the atom (need to ADD energy to escape)
- \(E = 0\) = barely escaped, no kinetic energy
- Positive energy = escaped with kinetic energy to spare
Ionization energy = energy needed to go from \(E_n\) to \(E = 0\)
From ground state: \(E_{\text{ionize}} = 0 - (-13.6) = 13.6\) eV
Hα Calculation: Complete
Transition: \(n = 3 \to n = 2\) (electron falls from level 3 to level 2)
Step 1: Calculate energy difference
\[\Delta E = E_3 - E_2 = (-1.51 \text{ eV}) - (-3.40 \text{ eV}) = +1.89 \text{ eV}\]
Positive because the electron releases energy (emits a photon)
Hα Calculation: Wavelength
Step 2: Convert energy to wavelength — Using \(E = hc/\lambda\), so \(\lambda = hc/E\)
The convenient form: \(\quad \lambda = \dfrac{1240 \text{ eV·nm}}{E \text{ (eV)}}\)
\[\lambda = \frac{1240 \text{ eV·nm}}{1.89 \text{ eV}} = 656.1 \text{ nm}\]
Unit check: \(\frac{\text{eV·nm}}{\text{eV}} = \text{nm}\) ✓
Hα = 656 nm — the famous red hydrogen line! (Lab reference: 656.28 nm)
Calculating the Entire Balmer Series
Transitions to \(n = 2\) — our predictions:
| Transition | \(\Delta E\) (eV) | Calculation | Predicted λ | Measured λ |
|---|---|---|---|---|
| 3→2 (Hα) | \(-1.51-(-3.40) = 1.89\) | \(1240/1.89\) | 656 nm | |
| 4→2 (Hβ) | \(-0.85-(-3.40) = 2.55\) | \(1240/2.55\) | 486 nm | |
| 5→2 (Hγ) | \(-0.54-(-3.40) = 2.86\) | \(1240/2.86\) | 434 nm | |
| 6→2 (Hδ) | \(-0.38-(-3.40) = 3.02\) | \(1240/3.02\) | 411 nm |
| Transition | \(\Delta E\) (eV) | Calculation | Predicted λ | Measured λ |
|---|---|---|---|---|
| 3→2 (Hα) | \(-1.51-(-3.40) = 1.89\) | \(1240/1.89\) | 656 nm | 656.3 nm |
| 4→2 (Hβ) | \(-0.85-(-3.40) = 2.55\) | \(1240/2.55\) | 486 nm | 486.1 nm |
| 5→2 (Hγ) | \(-0.54-(-3.40) = 2.86\) | \(1240/2.86\) | 434 nm | 434.0 nm |
| 6→2 (Hδ) | \(-0.38-(-3.40) = 3.02\) | \(1240/3.02\) | 411 nm | 410.2 nm |
We just predicted the exact colors of starlight from an equation on a blackboard.
Every value matches the lab measurement within 1%.
The Lyman Series: UV Lines
Transitions to \(n = 1\) (ground state):
Lyman-α (2→1):
\[\Delta E = E_2 - E_1 = (-3.40) - (-13.60) = 10.2 \text{ eV}\]
\[\lambda = \frac{1240 \text{ eV·nm}}{10.2 \text{ eV}} = 121.6 \text{ nm}\]
This is far-ultraviolet! (Absorbed by Earth’s atmosphere)
Astronomers need space telescopes to see Lyman-α from cosmic sources.
Series Limit and Ionization
What happens as n → ∞? For the Balmer series (transitions to \(n = 2\)):
\[\Delta E_{\text{max}} = E_\infty - E_2 = 0 - (-3.40) = 3.40 \text{ eV}\]
\[\lambda_{\text{min}} = \frac{1240}{3.40} = 365 \text{ nm}\]
365 nm is the “series limit” — the shortest Balmer wavelength.
Photons shorter than this ionize the atom from \(n = 2\)!
Ionization Energies by Level
| Starting Level | Energy (eV) | Ionization Energy | Photon λ to ionize |
|---|---|---|---|
| n = 1 (ground) | -13.60 | 13.6 eV | < 91 nm (far-UV) |
| n = 2 | -3.40 | 3.4 eV | < 365 nm (UV) |
| n = 3 | -1.51 | 1.51 eV | < 821 nm (IR) |
Excited atoms are easier to ionize!
An H atom with an electron in \(n = 3\) can be ionized by infrared light.
Deeper Dive
The Rydberg formula and other elements
The Rydberg Formula
A single formula for all hydrogen wavelengths:
\[\frac{1}{\lambda} = R_H \left( \frac{1}{n_f^2} - \frac{1}{n_i^2} \right)\]
Where:
- \(R_H = 1.097 \times 10^7\) m⁻¹ (Rydberg constant)
- \(n_f\) = final level (lower)
- \(n_i\) = initial level (higher)
Different series:
- \(n_f = 1\): Lyman series (UV)
- \(n_f = 2\): Balmer series (visible)
- \(n_f = 3\): Paschen series (IR)
Rydberg Example: Hα
\[\frac{1}{\lambda} = R_H \left( \frac{1}{2^2} - \frac{1}{3^2} \right)\]
\[= 1.097 \times 10^7 \text{ m}^{-1} \left( \frac{1}{4} - \frac{1}{9} \right) = 1.097 \times 10^7 \text{ m}^{-1} \left( \frac{5}{36} \right)\]
\[= 1.524 \times 10^6 \text{ m}^{-1}\]
\[\lambda = \frac{1}{1.524 \times 10^6 \text{ m}^{-1}} = 6.56 \times 10^{-7} \text{ m} = 656 \text{ nm}\]
Where Does 13.6 eV Come From?
Bohr model derivation (simplified):
Balance Coulomb force with centripetal acceleration: \(\quad \dfrac{e^2}{4\pi\epsilon_0 r^2} = \dfrac{m_e v^2}{r}\)
Quantize angular momentum: \(\quad m_e v r = n\hbar \quad \text{where } \hbar = h/2\pi\)
Solving these together gives:
\[E_n = -\frac{m_e e^4}{8\epsilon_0^2 h^2} \times \frac{1}{n^2}\]
The constant evaluates to 13.6 eV.
Other Elements: Scaling
For hydrogen-like ions (one electron, nuclear charge \(Z\)): \(\quad E_n = -\dfrac{13.6 \text{ eV} \times Z^2}{n^2}\)
| Ion | Z | Ground state energy | Ionization energy |
|---|---|---|---|
| H | 1 | -13.6 eV | 13.6 eV |
| He⁺ | 2 | -54.4 eV | 54.4 eV |
| Li²⁺ | 3 | -122.4 eV | 122.4 eV |
More protons → electron bound more tightly → higher ionization energy.
Multi-Electron Atoms: Complications
For atoms with multiple electrons:
- Electrons shield each other from the nucleus
- Energy levels don’t follow simple \(1/n^2\) pattern
- Each element has a unique energy level structure
- This is why each element has unique spectral lines!
The uniqueness of spectra is a feature, not a bug.
It’s what allows us to identify elements across the universe.
Why “Metals” in Astronomy?
Astronomical definition of “metal”: Anything heavier than helium!
Why this weird definition?
- H and He are ~98% of ordinary matter
- Everything else is trace amounts
- Spectroscopist’s view: H lines, He lines, and “all the rest”
Metallicity = fraction of elements heavier than He
- Sun: ~2% metals (by mass)
- Old stars: <0.1% metals
- Young stars: up to ~3% metals
Yes, this means oxygen is a “metal” and carbon is a “metal.” Chemists love this about us.
Questions?
Spectral lines are chemical fingerprints.
Quantum mechanics explains why they’re discrete.
![]()
ASTR 101 - Lecture 9 - Dr. Anna Rosen