Spoiler Alert: The Universe Is Weird
How Do We Know What We Know?
When you look up at the night sky,
what do you see?
What do you assume you’re seeing?
0–1 min. Let this sit for 5 seconds in silence.
Don’t answer out loud. Just let students look.
Prompt: “Write 2–3 words: what you see, and what you’re assuming.”
Then advance to the video.
The Cosmic Treasure Chest
1–3 min. Play video without introduction.
Made from over 1,100 images captured by NSF-DOE Vera C. Rubin Observatory. Begins with two galaxies, zooms out to reveal 10 million galaxies—roughly 0.05% of the 20 billion Rubin will capture.
After video (THE REVEAL): “Those aren’t ALL stars. Those are galaxies. Every single point of light is a galaxy—each one containing hundreds of billions of stars. And we’re going to learn how to read them.”
Today Is a Trailer: Learning Objectives
By the end of today, you can…
- State the course thesis: pretty pictures → measurements → models → inferences
- Name the 4 direct observables: brightness, position, wavelength, timing
- Explain why light matters: wavelength + lookback time
Fast. Say the “trailer” speech verbally here if you want.
Today’s Roadmap
- The thesis (what this course is really about)
- The “four observables” constraint
- Spoiler reel: Measure → Infer → Physics
- Decoder ring: prediction → test → revise
Focus on: recognition, not mastery.
One pass now; we’ll return to each piece slowly.
Don’t read the small text on this infographic. It’s a map, not a quiz.
Point once to each region (quick tour):
- Left: “The Inference Pipeline”
- These are the only four kinds of things we can directly measure from far away: brightness, position, wavelength, timing.
- Everything else we talk about in astronomy is built from these + physics.
- Middle: the telescope
- Telescopes don’t “take pictures” the way your phone does.
- They collect photons and turn them into numbers: counts, angles, spectra, time series.
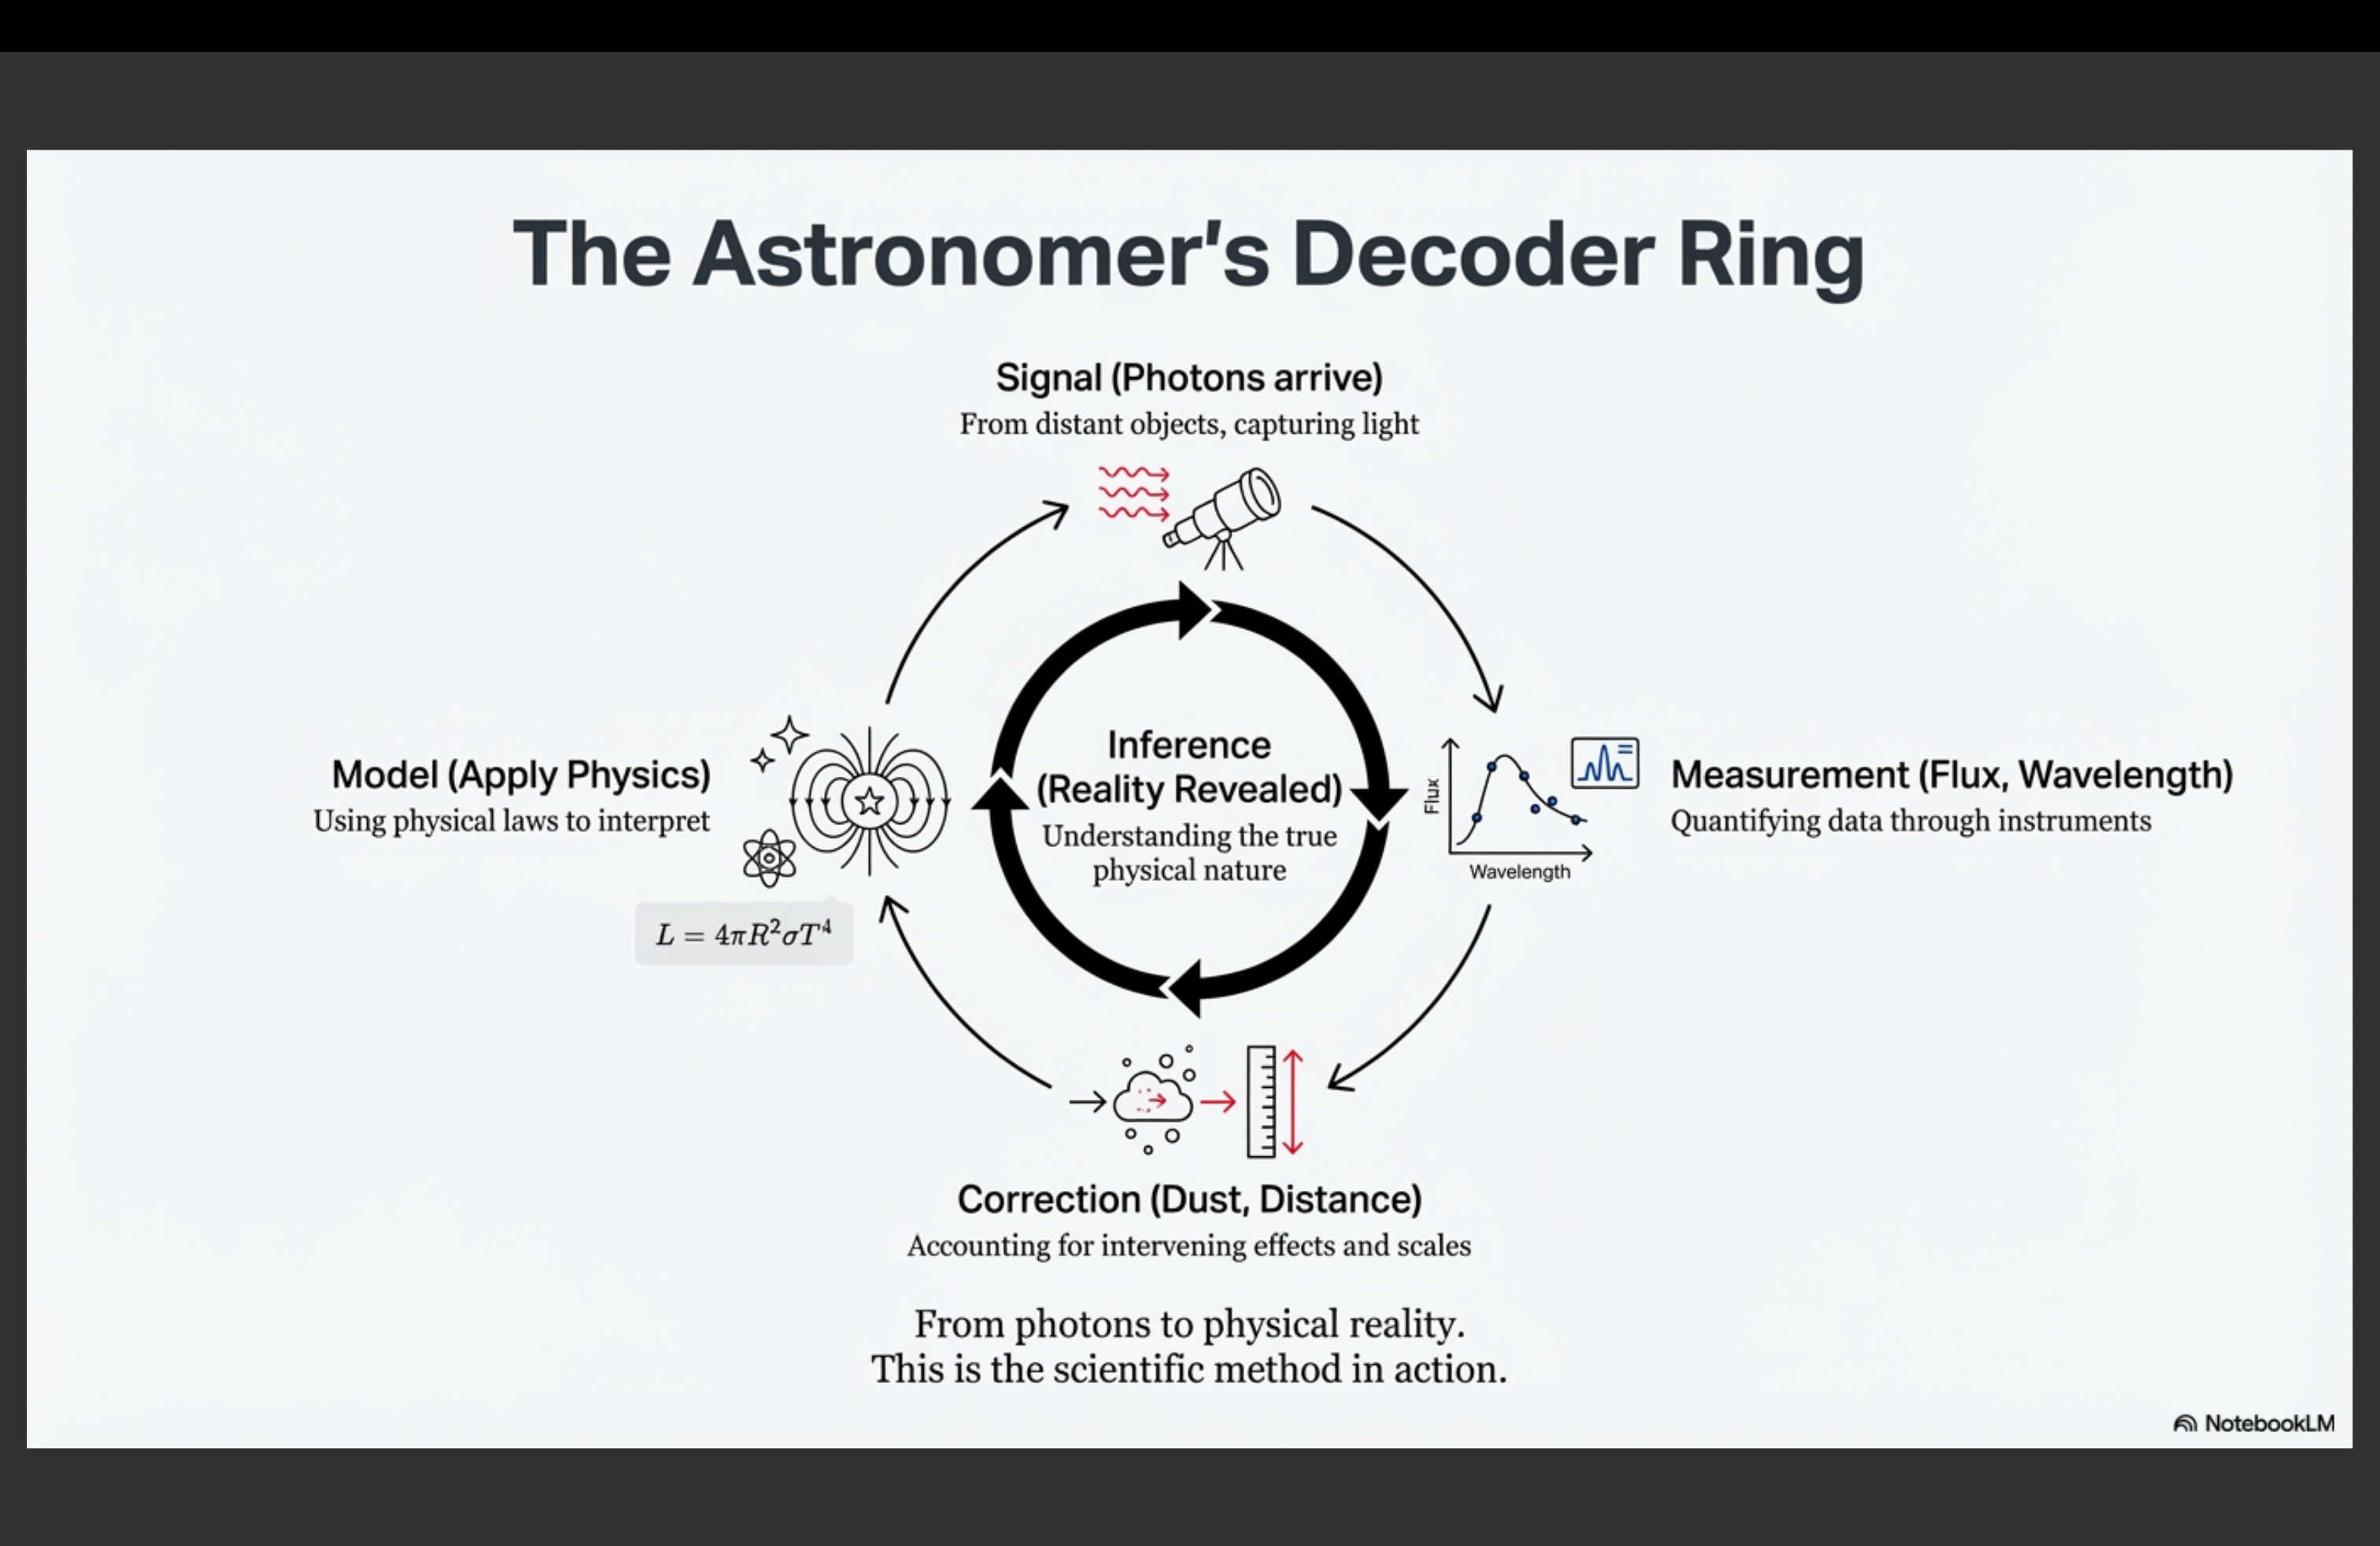
- Right: “The Decoder Ring”
- The decoder ring is the move we repeat all semester: signal → measurement → model → inference.
- The key promise of the course: we’ll make the “model” step explicit, so you can see what assumptions are being made.
- Bottom: two ideas to tag for later
- Wavelength is physics: different wavelengths show different temperatures/processes.
- Distance is a time dial: because light takes time to travel, looking farther means looking farther into the past.
Close the slide with: “Today is just the trailer. If you recognize these ingredients when they show up later, you’re doing it right.”
NASA Astrophysics Three Big Questions
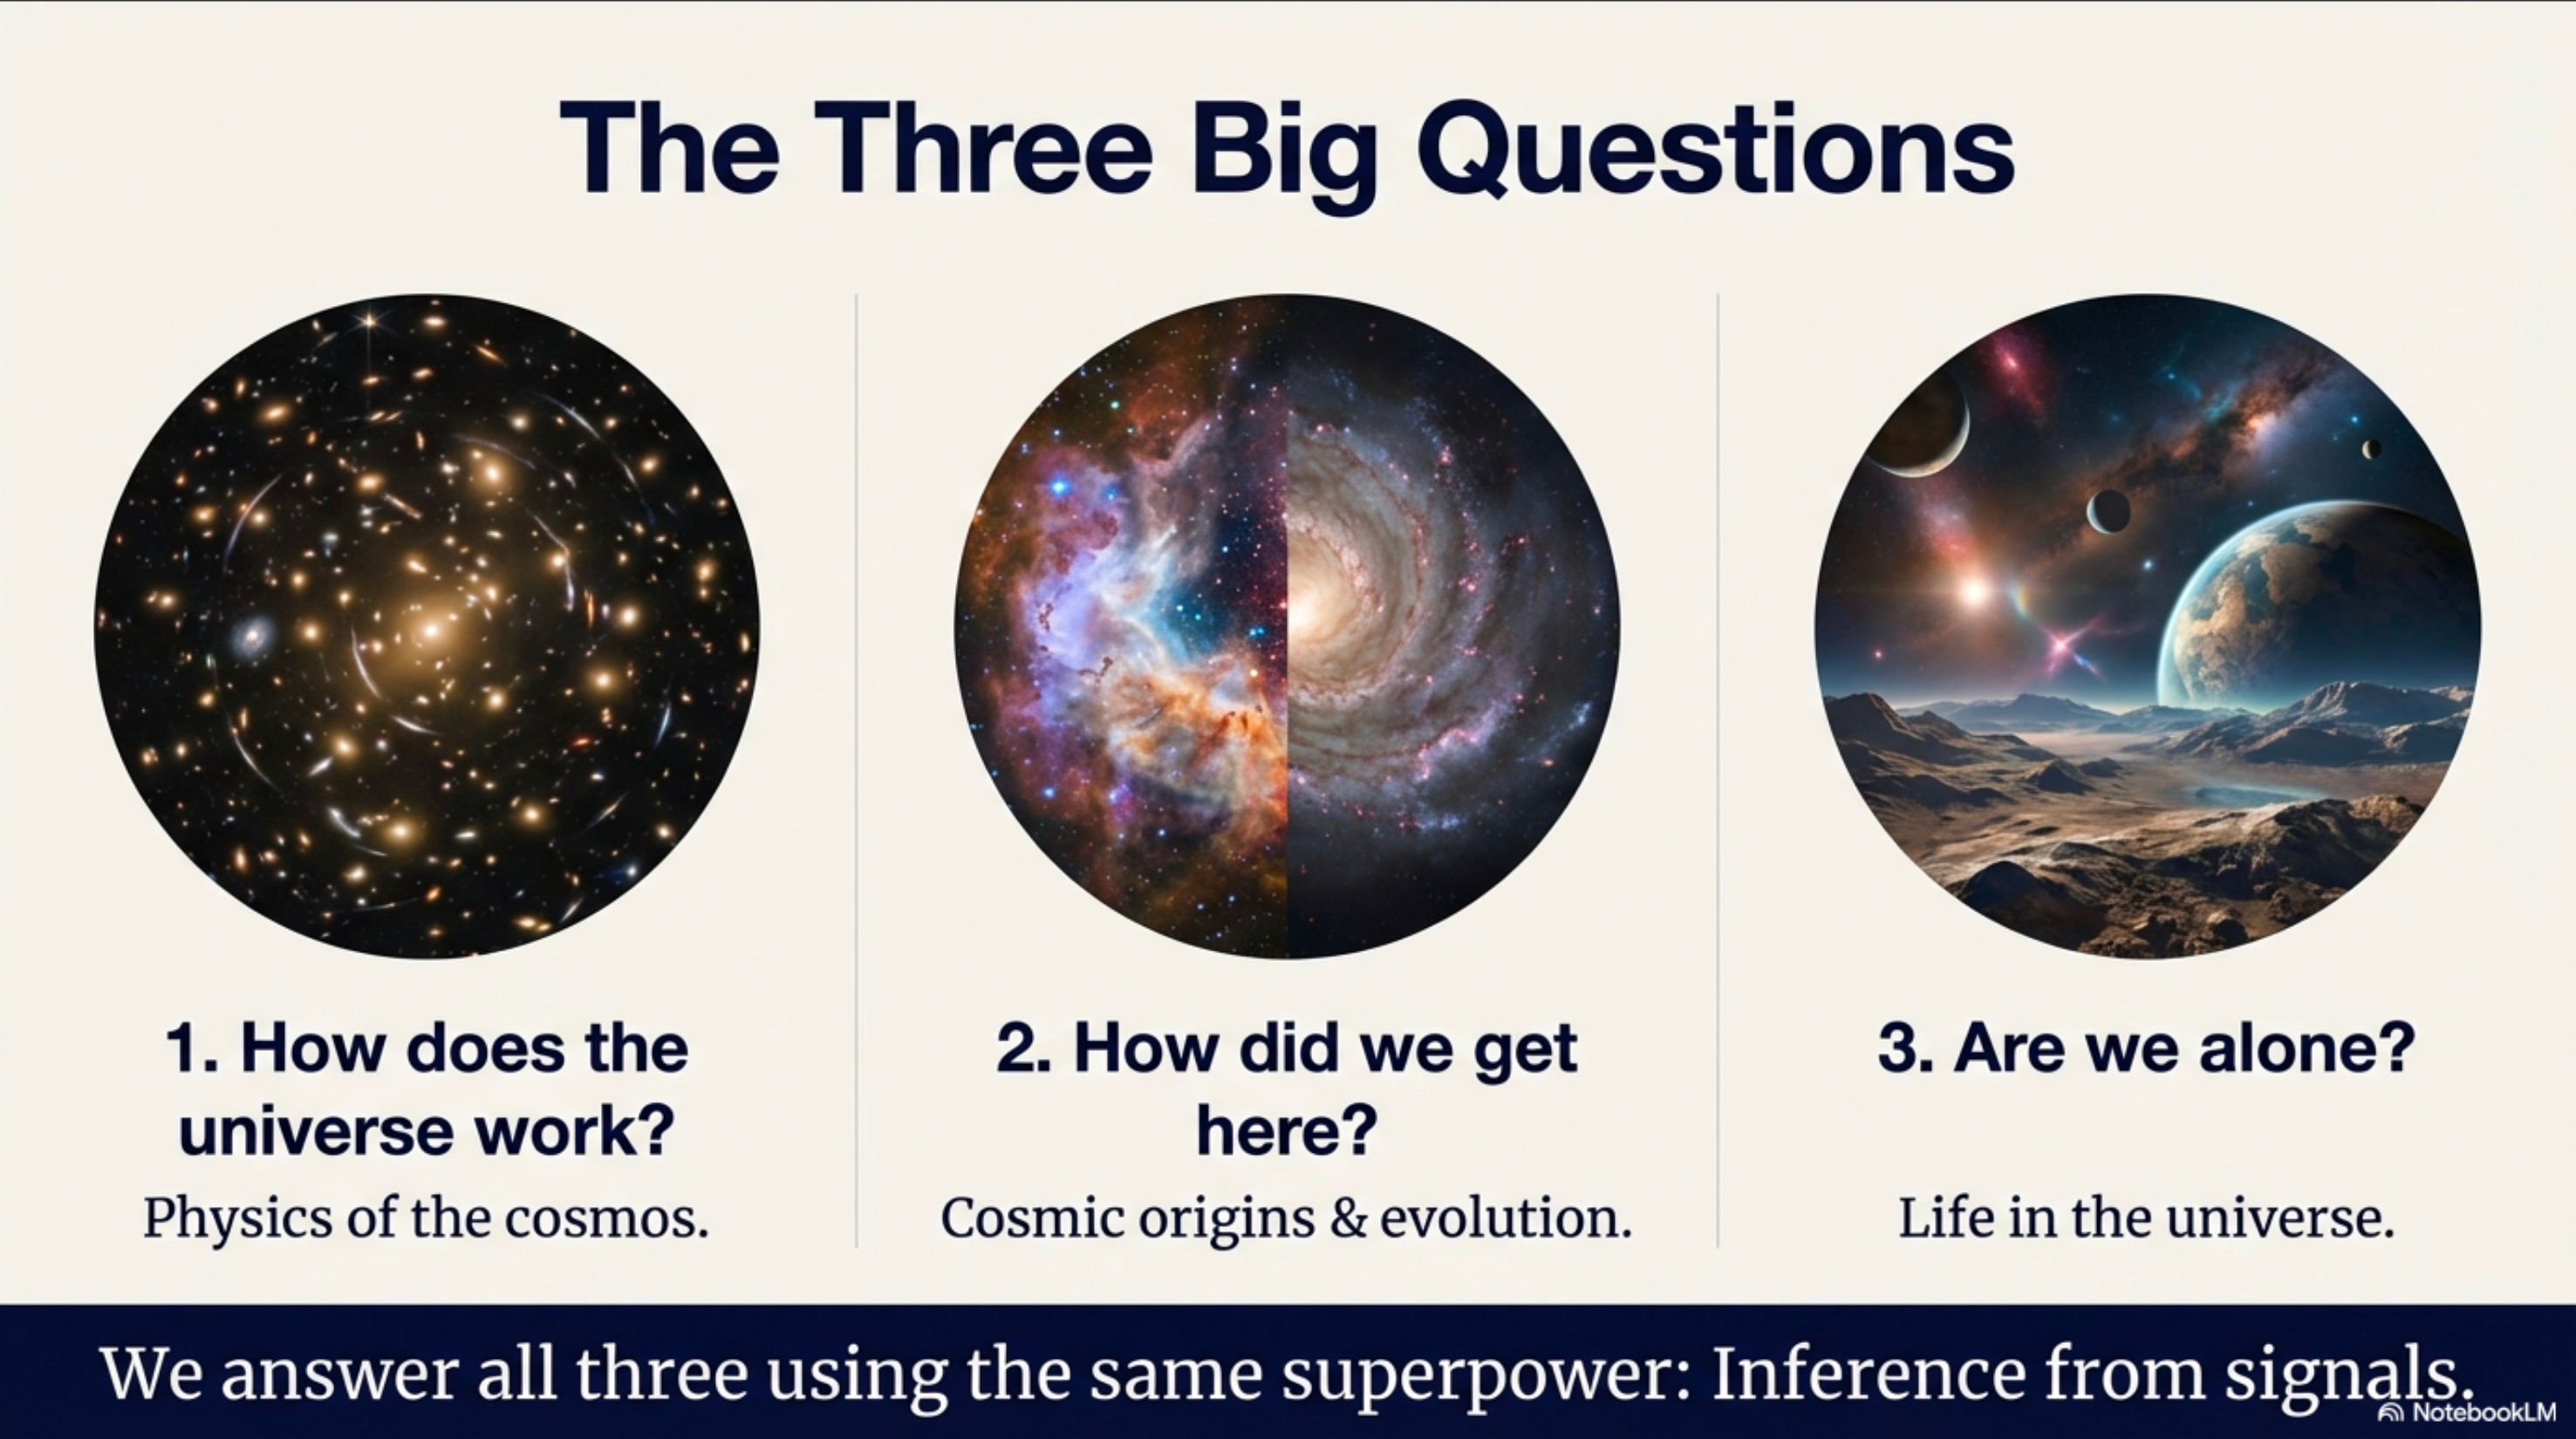
Pick one: which question are you most curious about?
Quick hand poll, then: “Same method every time: Measure → Infer → model-check.”
Tell students to chat with a neighbor, and call on a few students.
Astronomy is about inferring physical reality from constrained measurements
We cannot touch the stars; we can only decode the light they send us.
Measure
What do we directly observe?
Infer
Turn signals into physical claims.
Balance
What relationships must hold (and why)?
Evolve
How do systems change with time?
10–20 seconds. “Today we mostly live in Measure/Infer. Balance/Evolve is where we’re headed once we have tools.”
The “Impossible” Knowledge Problem
We claim to know real physical things…
- The Sun’s surface temperature is about 5,800 K
- The universe is about 13.8 billion years old
- You are made of stellar debris
But we have never touched the evidence.
Keep it tight.
“None of those came from direct contact: no thermometers in stars, no tape measures to galaxies.”
Bridge question: “So what did we actually measure, and what model makes the inference legitimate?”
How We Turn Light Into Reality
Pretty Pictures Aren’t the Point. They’re data.
Pretty pictures → measurements → models → inferences
An inference = a conclusion about something we can’t directly access, using what we can measure + a physical model.
A scientific model = a mathematical relationship that encodes physical assumptions and connects observables to inferred quantities.
Point forward: “Next we name what we can actually measure directly (only four kinds of things).”
The Four Things We Can Actually Measure (Directly)
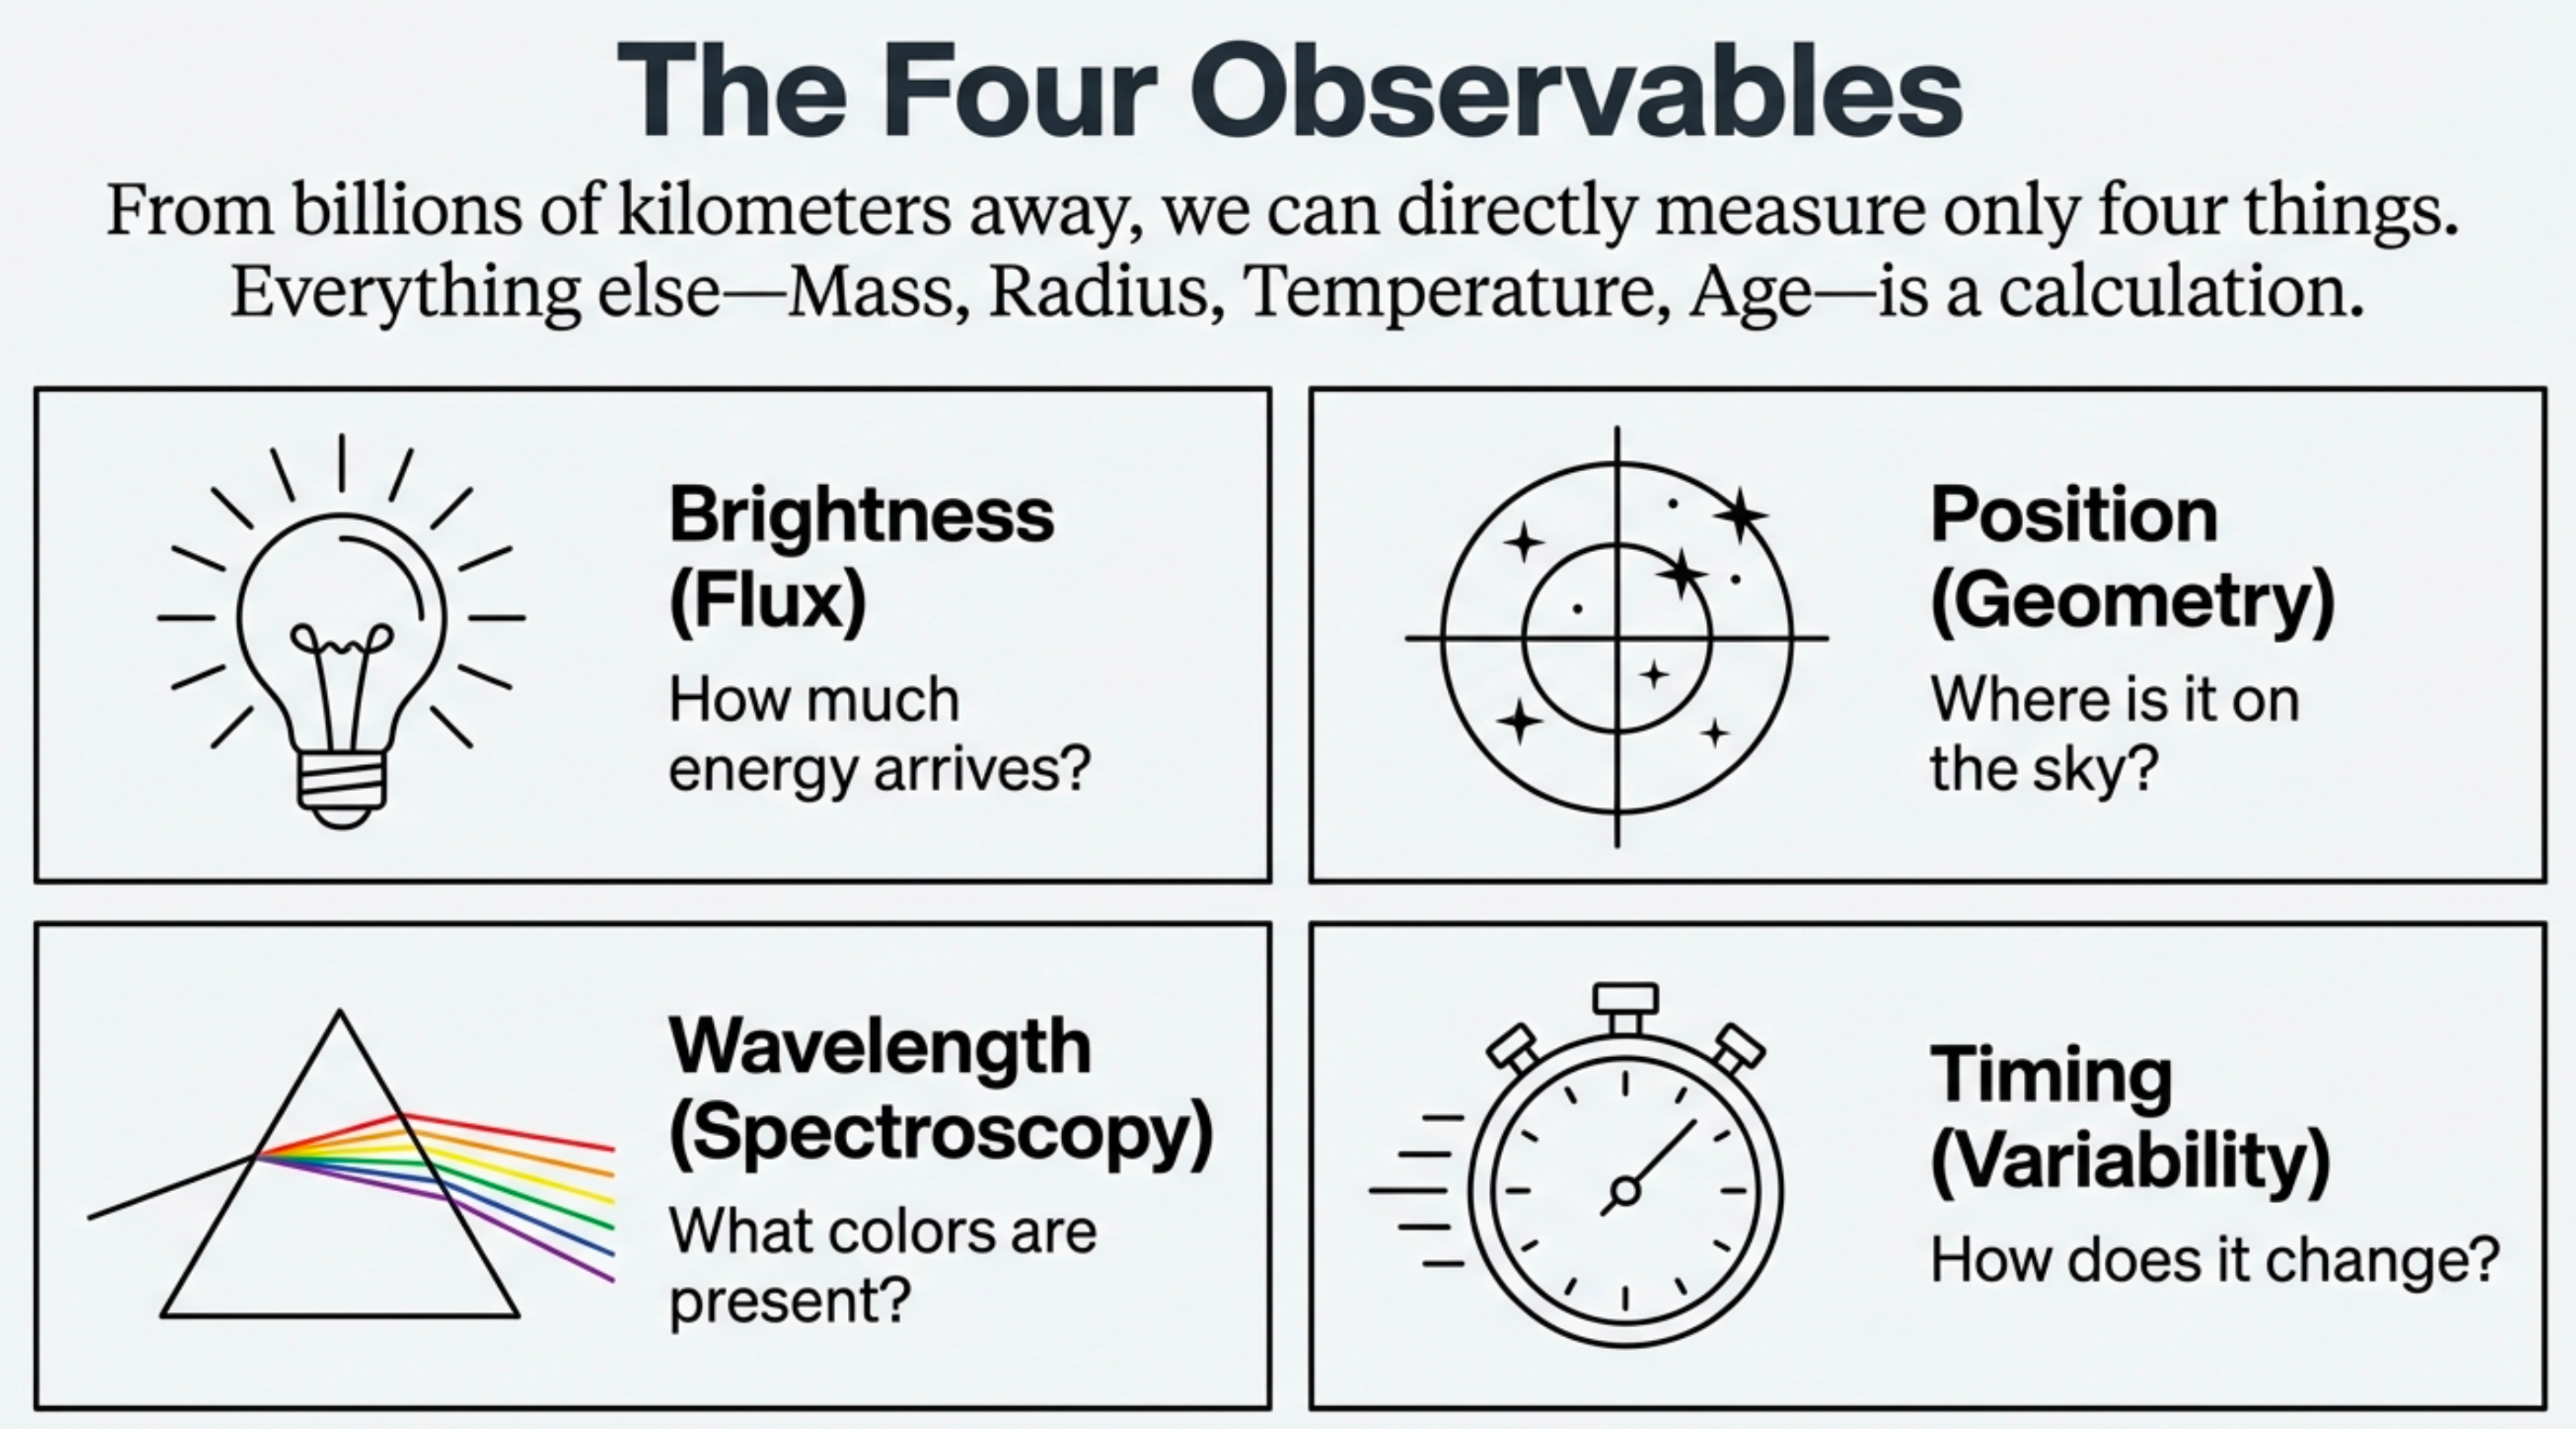
Direct observables (inputs):
- Brightness (flux)
- Position (angles + changes)
- Wavelength (spectrum/color)
- Timing (variability)
Everything else is inferred using physics.
4–6 min.
These four are the only “inputs” the universe gives us.
Don’t over-explain yet—just name them and point to each icon in the figure.
If you want a one-liner to land: “Everything else we care about is a calculation.”
Models Are the Bridge (“Decoder Ring”)
Pretty pictures → measurements → models → inferences
What we can directly measure:
- Brightness
(flux) - Position
(angles + changes) - Wavelength (spectrum/color)
- Timing (variability)
What a model does:
- A model is a mathematical relationship that encodes physical assumptions.
- It’s the “decoder ring” that turns an observable into a physical claim.
Without models, astronomy is just a catalog of points of light.
6–7 min.
Say explicitly: “An inference is only as strong as the model that connects what we measured to what we’re claiming.”
Concrete anchor (optional, don’t derive): the inverse-square law connects measured flux to luminosity and distance: \(F = L/(4\\pi d^2)\).
Prediction: How Do We Know the Sun’s Temperature?
The Sun’s surface temperature is about 5,800 K.
Based on the “four observables,” how did astronomers figure this out?
Commit to one answer before we move on:
- Sent a thermometer on a spacecraft
- Measured the wavelength/spectrum of sunlight
- Calculated from the Sun’s size and distance
- Estimated based on “how hot it looks”
~7–8 min. Give ~45 seconds. Don’t reveal yet.
Prompt: “Temperature is not one of the four observables. So which observable could possibly connect to temperature?”
Prediction Reveal: Temperature Is Inferred from Spectrum
- Measure: the spectrum/color of sunlight (brightness vs. wavelength)
- Infer: the Sun’s surface temperature (~5,800 K)
- Physics: blackbody/Wien-type models connect peak wavelength to temperature
Temperature is never directly measured.
~8–9 min.
Land the punchline: “We didn’t stick a thermometer in the Sun. We measured wavelength and used physics to infer temperature.”
If you want one sentence to repeat all semester: “Observable → model → inference.”
The Six Core Quantities We Infer
| What we infer | We measure | Model “bridge” (examples) |
|---|---|---|
| Distance | brightness or position | inverse-square law or parallax geometry |
| Time | timing or distance | lookback time; evolution/expansion models |
| Speed | wavelength (shifts) | Doppler effect |
| Mass | position + timing (orbits) | gravity/orbital dynamics |
| Luminosity (energy output) | brightness + distance | \(L = 4\pi d^2 F\) \(d=\text{distance},~F=\text{flux}\) |
| Temperature | wavelength (spectrum/color) | blackbody/Wien-type models |
None of these are direct observables.
Every one is inferred.
~9–10 min.
Don’t ask them to memorize this today. Use it as a promise: “Every tool we learn this semester is a new, better bridge from the four observables to these quantities.”
If students ask about composition: acknowledge it’s also inferred from wavelength (spectral lines), but today’s “six” list is the course’s core quantity set.
Quick Check: What Can We Measure Directly?
Which can astronomers directly measure for a distant star?
7–8 min.
Give ~20–30 seconds: “Don’t overthink—what can we measure directly?”
Then confirm: apparent brightness is a direct measurement; temperature/mass/age are inferences.
Quick Check: The Six Quantities
Which list correctly names the six core physical quantities astronomers infer?
~10–11 min. Give ~30 seconds.
Correct: distance, time, speed, mass, luminosity, temperature.
If they ask about composition: it’s a major application of spectroscopy, but it is not part of the “six core quantities” list for this lecture’s LO.
From Observables to Patterns: The H–R Diagram
8–9 min. HR Diagram construction from Omega Centauri.
Watch what happens when astronomers sort stars by two observables: brightness and color. A pattern emerges.
The Hertzsprung-Russell diagram is one of astronomy’s greatest tools—and it’s built entirely from things we can measure. No magic. Just careful observation and pattern recognition.
Key message: Astronomers are pattern hunters. Sort the data, find the structure, discover the physics.
The Spoiler Reel: Watch the Inference Pattern
For each image, don’t memorize details—identify the move.
Measure
What do we directly observe?
Infer
What physical claim do we make?
Physics
What model makes it “legal”?
Why it matters later
Which future tool/idea does this set up?
9–10 min.
Orientation: “This is the repeatable structure for the whole course.”
Spoiler 1: Nebulae
![Annotated nebula image showing three labeled features: (1) Hydrogen-Alpha at 656.3 nm in red regions indicating ionized gas, (2) Doubly-ionized Oxygen [OIII] at 500 nm in blue-green regions indicating extremely low density, (3) Dark Lanes showing silhouettes of interstellar dust blocking the light.](../../../assets/images/module-01/forensic-analysis-of-a-nebula-nblm.png)
- Measure: colors at specific wavelengths
- Infer: composition + dust structure
- Physics: atoms emit/absorb at specific wavelengths (“fingerprints”)
- Why it matters later: spectral fingerprints let us map composition across space
10–12 min.
Measure: colors at specific wavelengths (e.g., red Hα; blue-green [OIII]).
Infer: hydrogen vs oxygen emission; dark lanes = dust blocking light.
Physics: atomic physics: discrete transitions → discrete wavelengths.
Key insight: Color isn’t decoration—it’s encoded physics.
11–13 min. Trifid and Lagoon Nebulae from Rubin Observatory.
Made from 678 exposures in just over seven hours. Point out:
- Rich reds and pinks = hydrogen-alpha emission (656 nm) — active star formation
- Blue and turquoise = reflected starlight and glowing oxygen ([OIII], 495–501 nm)
- Dark lanes and golden clouds = dense dust absorbing visible light
This is exactly what we just discussed: color = physics.
Quick Check: Why Specific Colors?
Why do nebulae glow at specific colors?
11–12 min.
Correct: each element has a unique set of wavelengths it can emit/absorb (a spectral fingerprint).
Spoiler 2: The Distance Ladder — How Far Is Far?
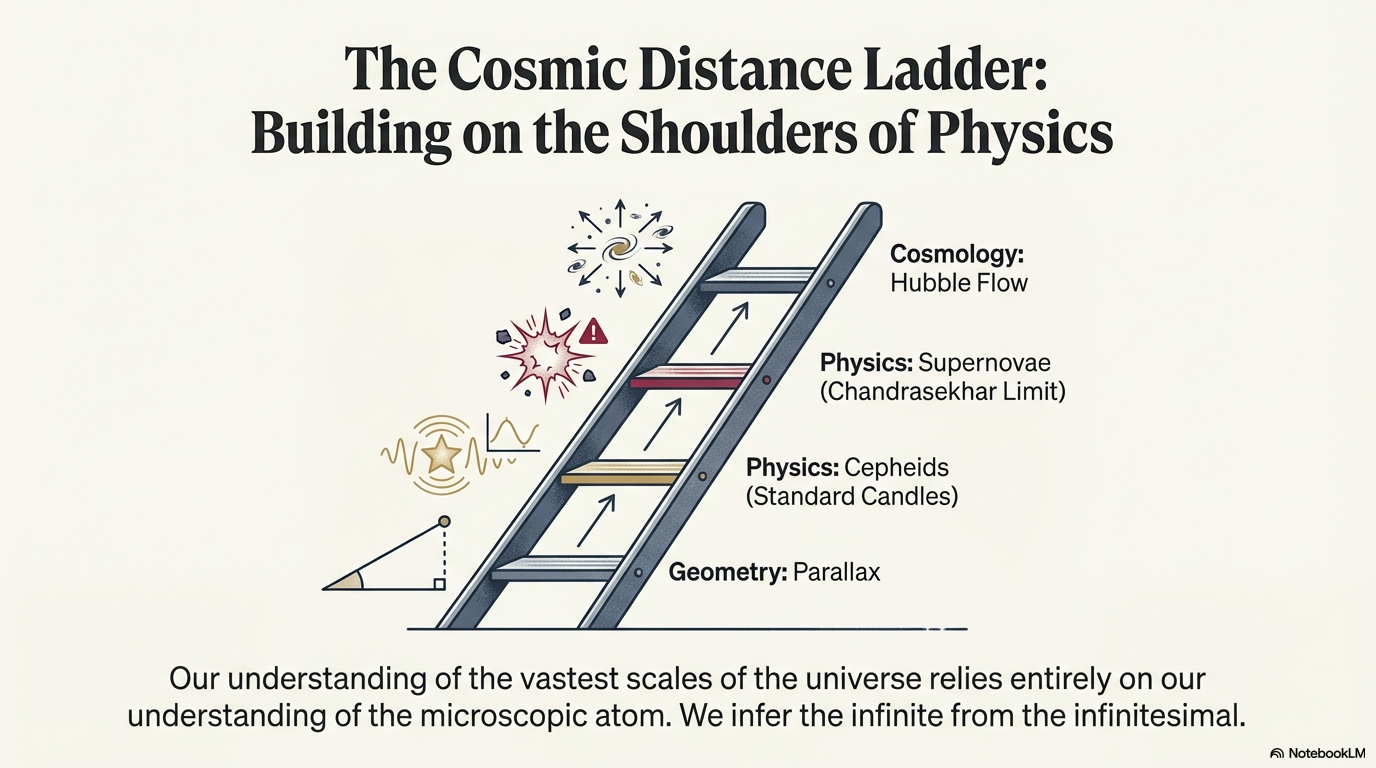
- Measure: apparent brightness (flux) of “milepost” objects
- Infer: distance far beyond geometry alone
- Physics: inverse-square law + standard candles
- Why it matters later: most cosmic distances rely on this ladder chain
12–14 min.
Measure: apparent brightness (flux) of objects whose true luminosity we can determine (“standard candles”).
Infer: distances much farther than parallax can reach.
Physics: inverse-square law: \(F = L / (4\\pi d^2)\).
Key insight: Distance is inferred from brightness.
Standard Candles: Measure \(F\), Know \(L\), Infer \(d\)
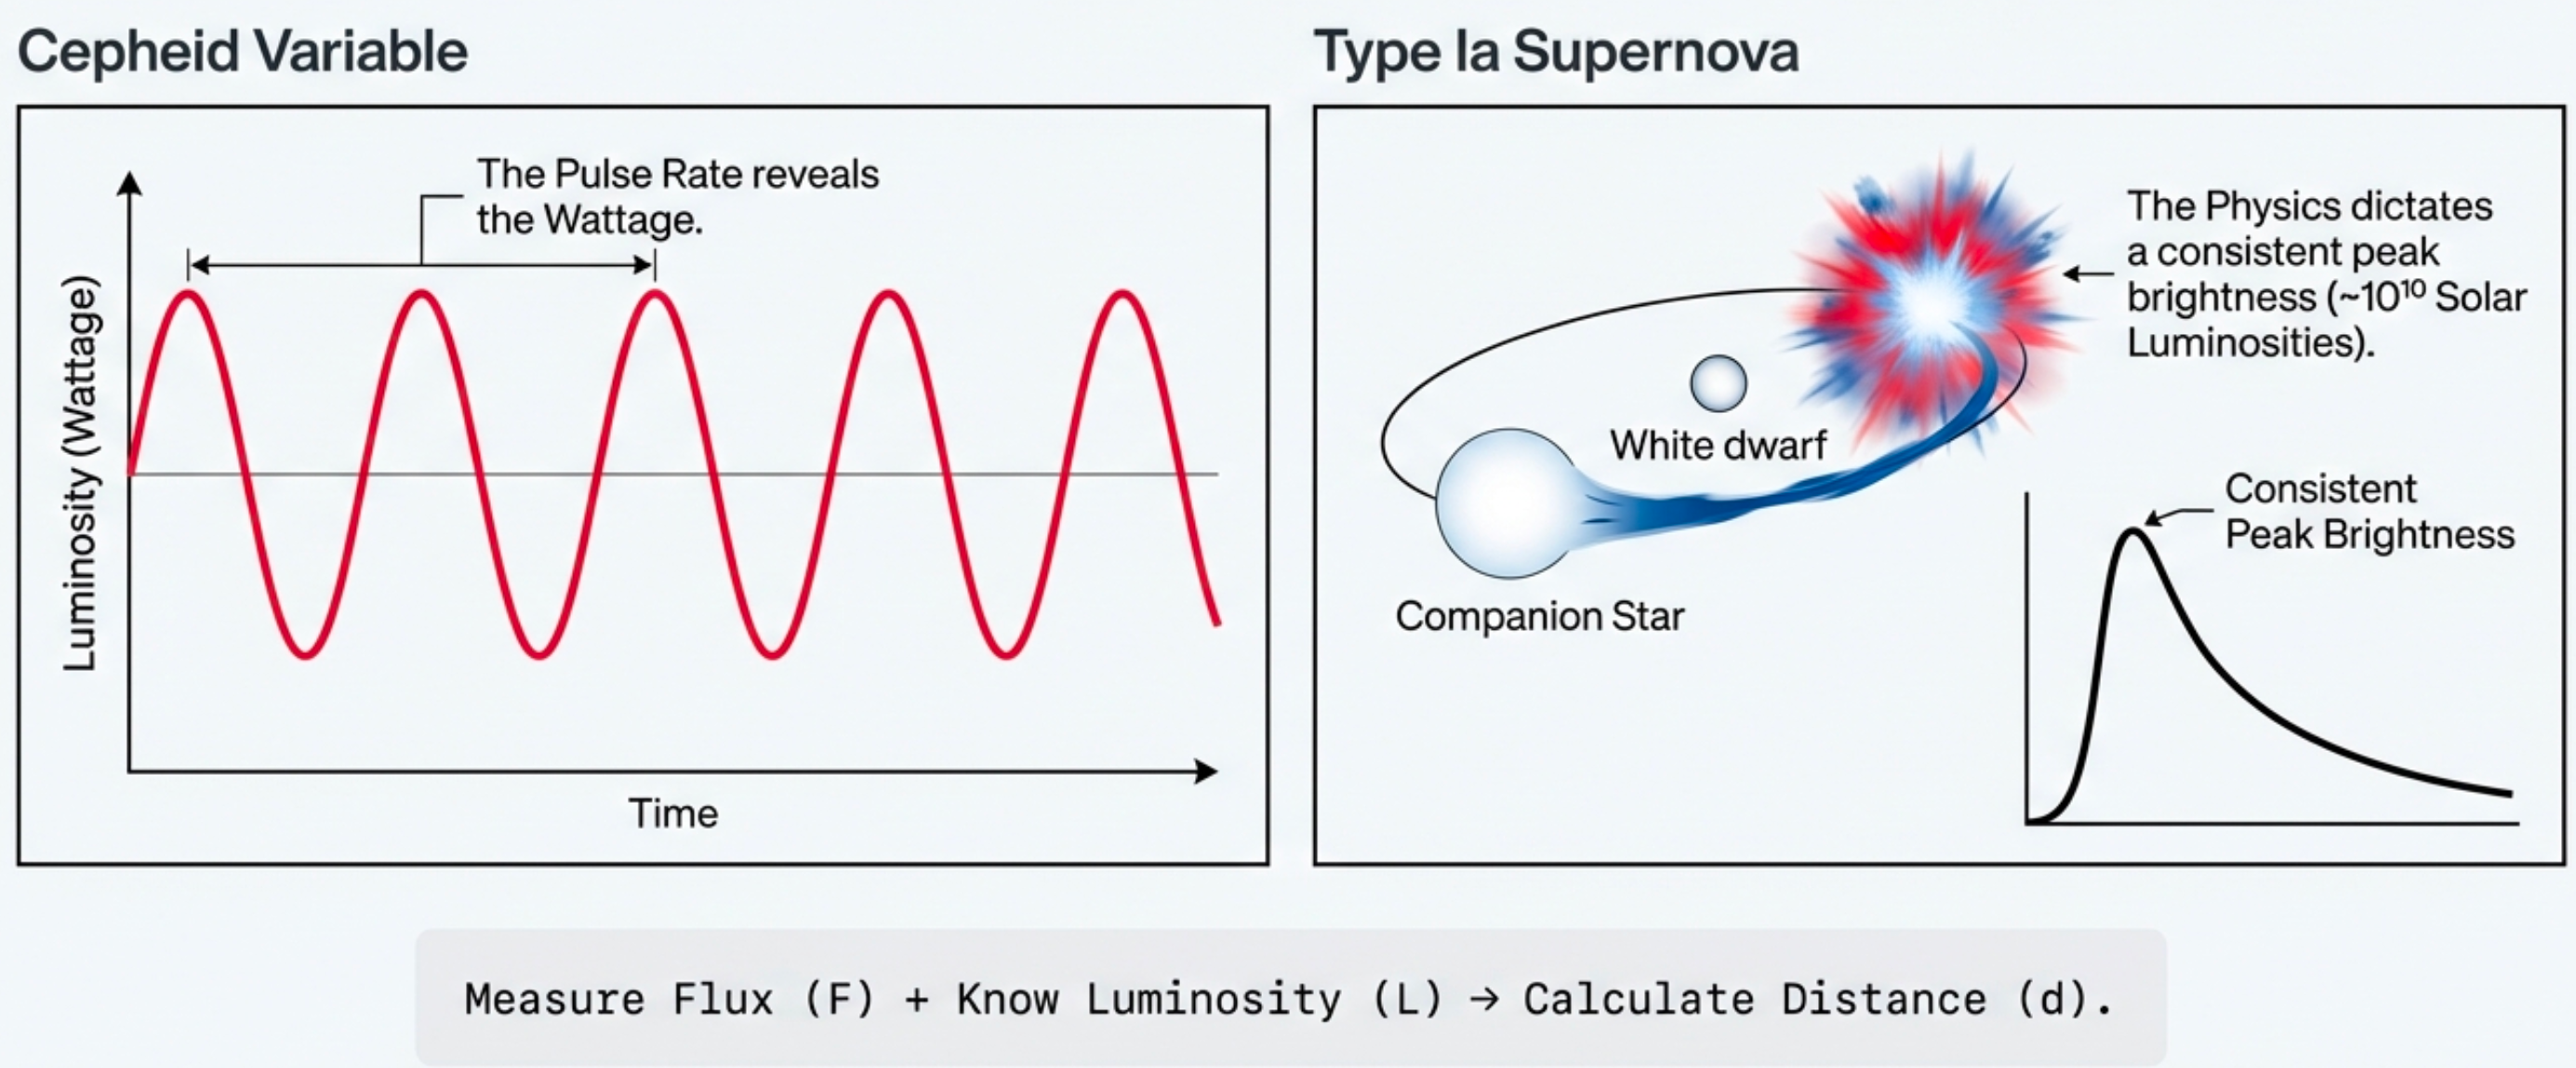
- Measure: flux \(F\)
- Model: \(F = \dfrac{L}{4\pi d^2}\)
- Infer: distance \(d\)
A dim nearby source can look like a bright distant one — models break the tie.
14–15 min.
Cepheids pulse with period related to luminosity. Type Ia supernovae have consistent peak brightness.
Measure flux + know luminosity → calculate distance.
15–17 min. 46 pulsating RR Lyrae stars from Rubin Observatory.
Watch the stars pulse. RR Lyrae are standard candles — their pulsation period tells us their intrinsic luminosity.
Over the next 10 years, Rubin will detect up to 100,000 of these stars extending more than a million light-years away, mapping the outer reaches of our Galaxy.
This is the cosmic distance ladder in action. Measure how bright they appear, know how bright they are, calculate how far.
Spoiler 3: Origin of the Elements
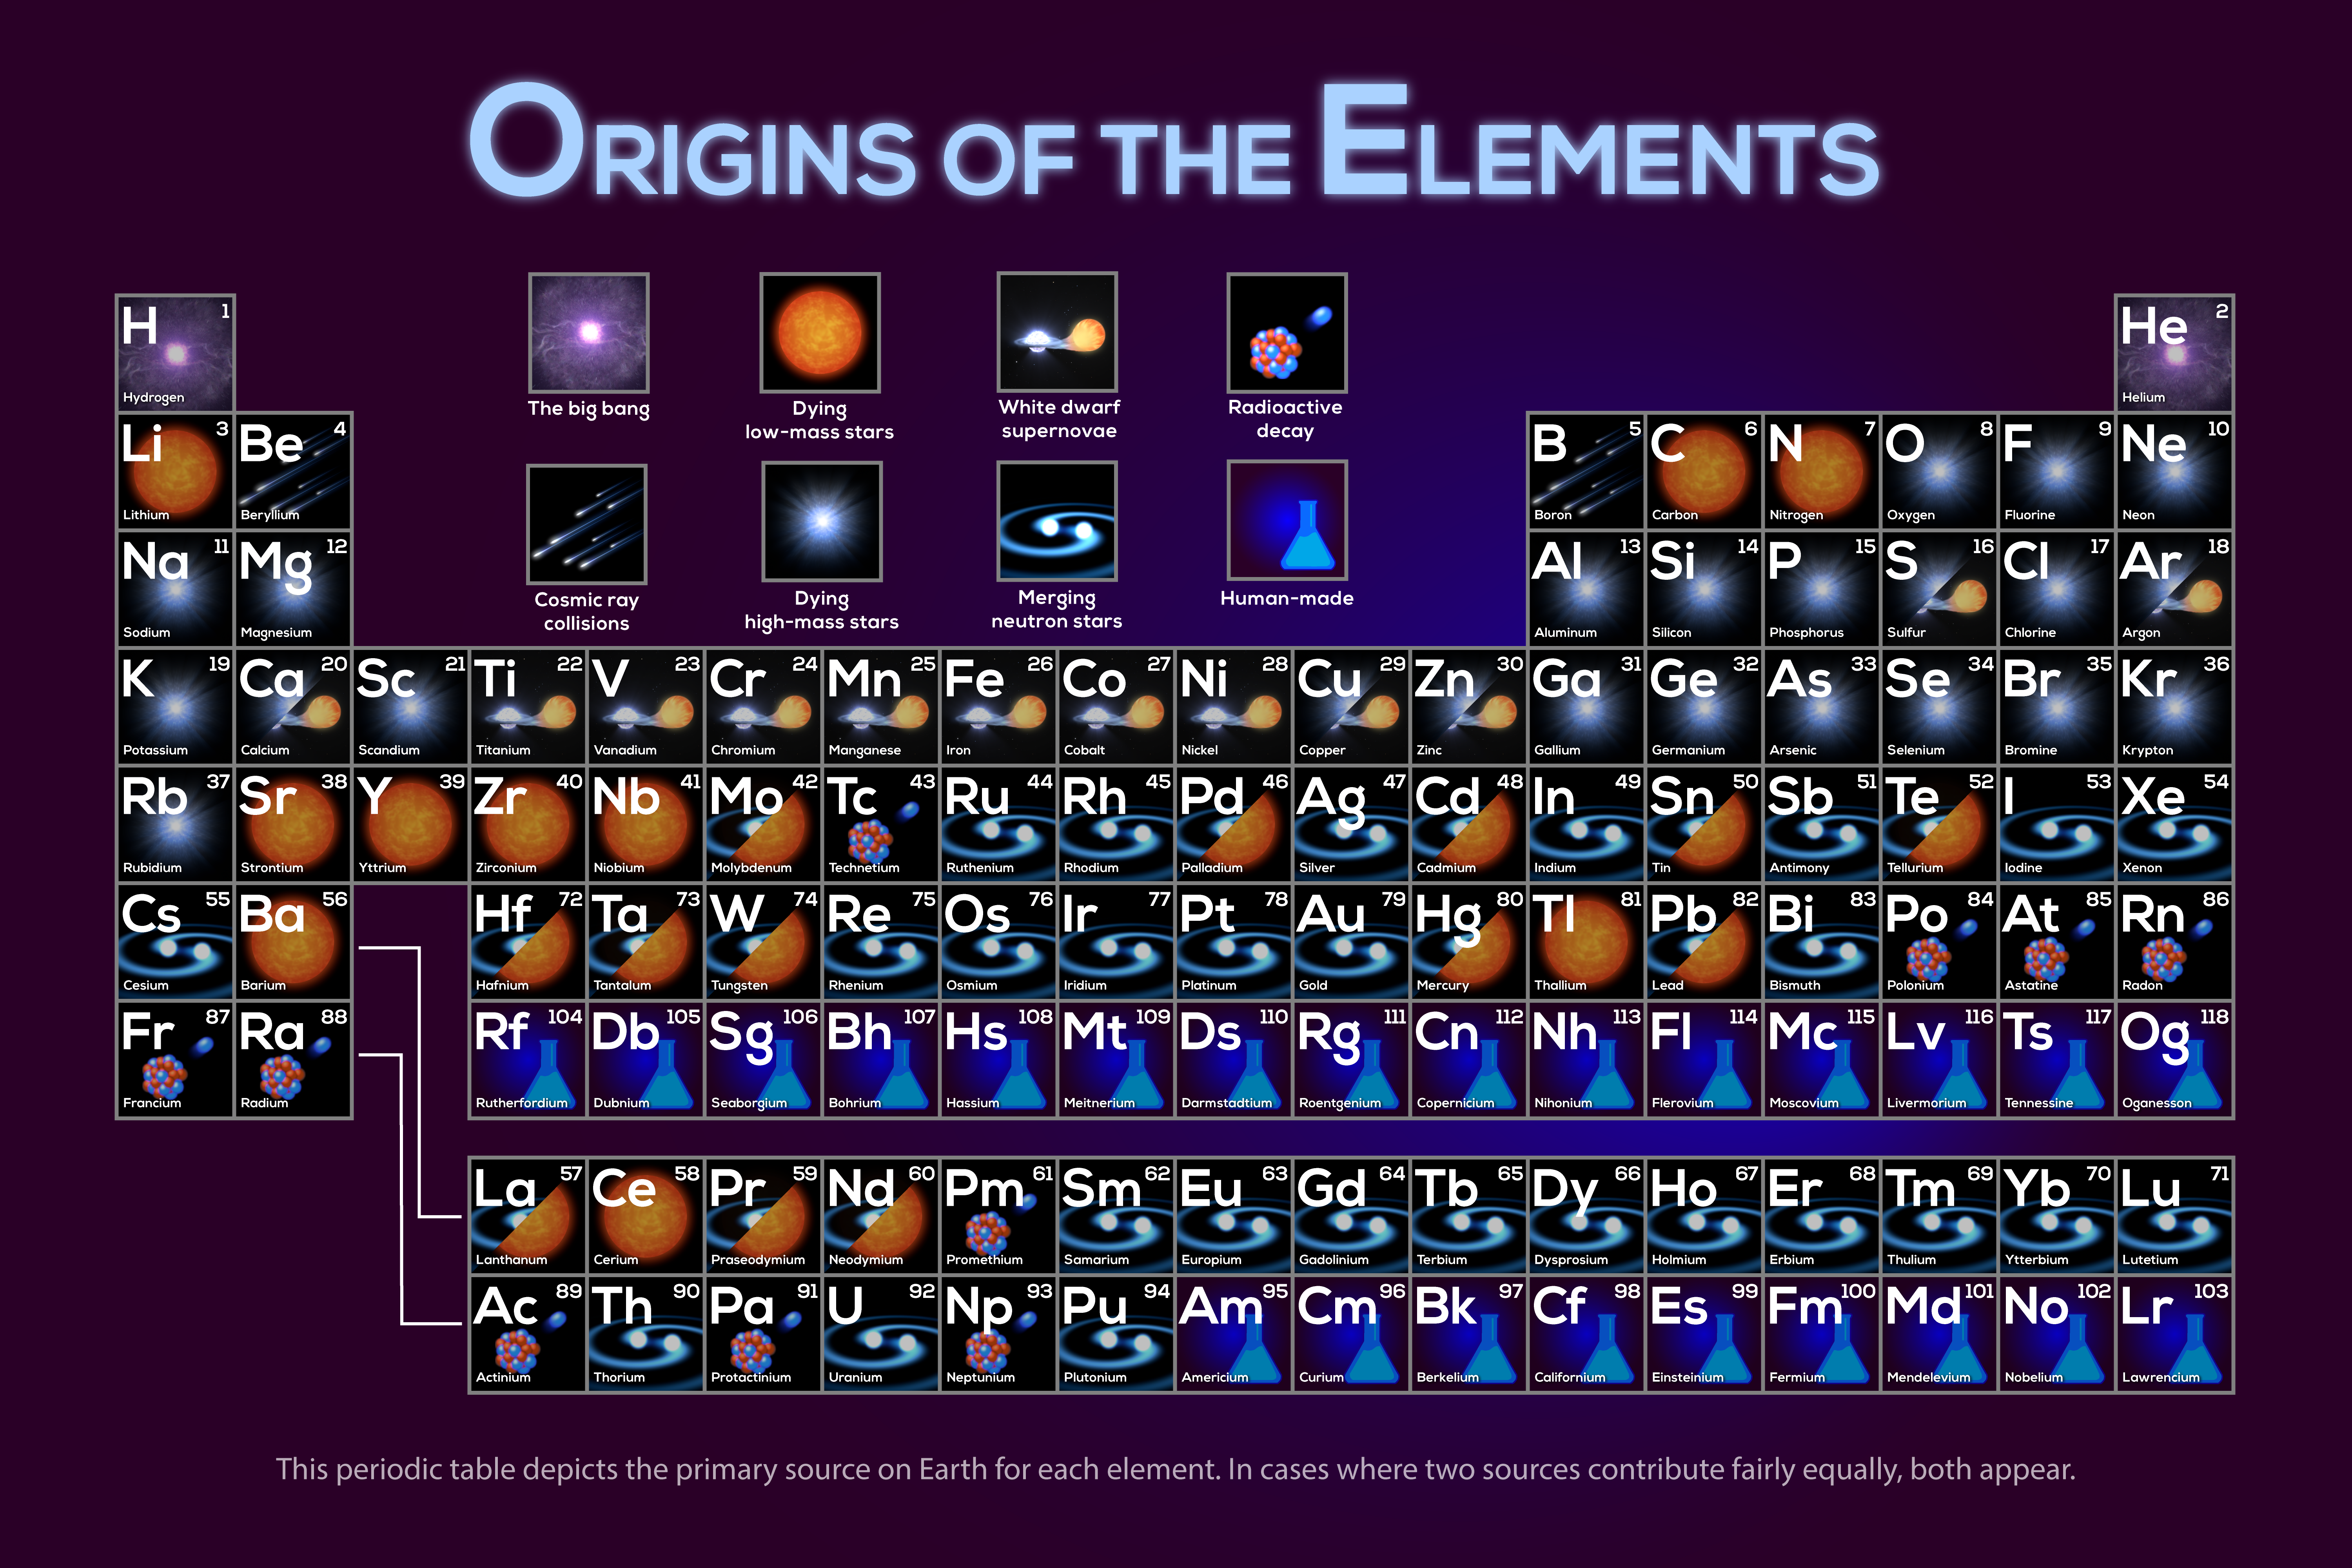
- Measure: element fingerprints in spectra
- Infer: where the elements were made (“cosmic ovens”)
- Physics: nuclear reactions have specific products
- Why it matters later: “starstuff” is an inference we can test with spectra
15–17 min.
Measure: Spectral fingerprints.
Infer: The periodic table is a fossil record of cosmic processes.
Physics: Nuclear reactions have specific products.
Key insight: Stars don’t just shine—they manufacture atoms. You are starstuff.
Spoiler 4: Spectroscopy
- Measure: brightness as a function of wavelength (a spectrum)
- Infer: temperature, composition, and motion
- Physics: quantized energy levels → specific wavelengths
- Why it matters later: spectroscopy is the “master key” we’ll keep using
17–19 min.
CRITICAL SLIDE — EXACT SCRIPT:
“This slide is one of the most important in the entire course. Spectroscopy is how astronomy stops being pictures and starts being physics. If one idea from today sticks, let it be this one.”
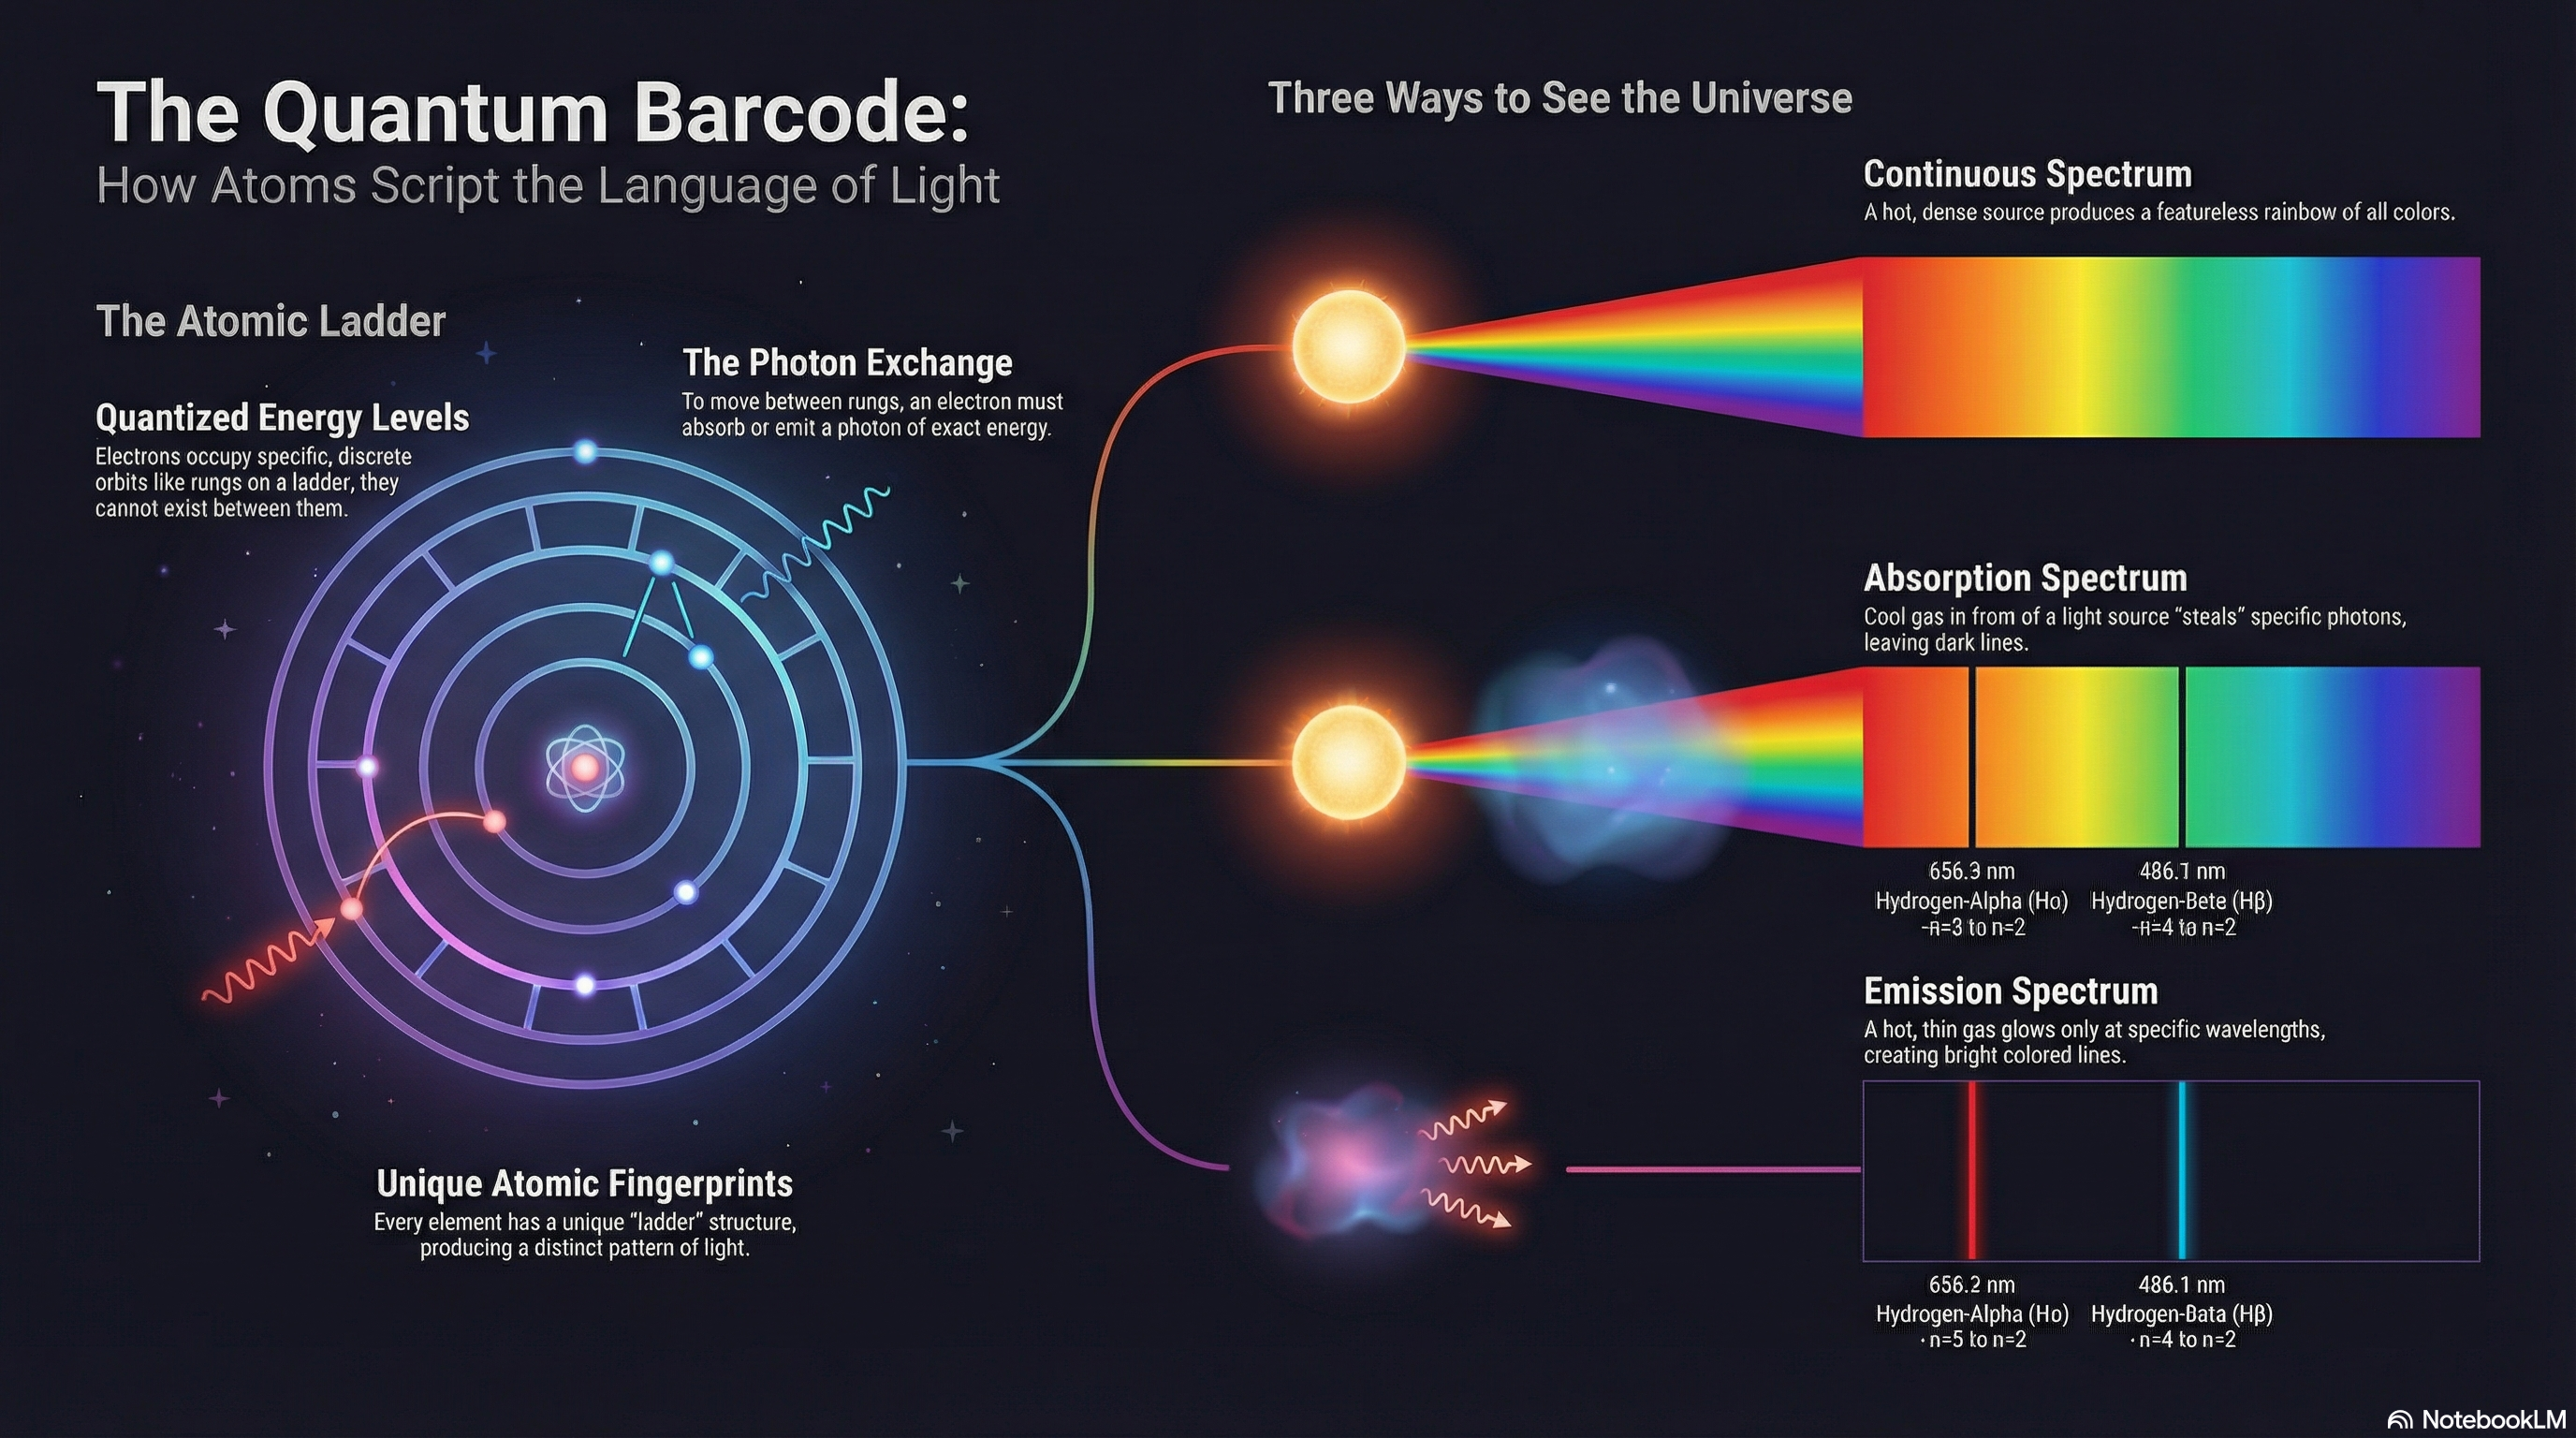
Spectroscopy: A Quantum Barcode
19–21 min.
Measure: Brightness vs. wavelength.
Infer: Temperature, composition, velocity.
Physics: Atoms have quantized energy levels. Electron jumps → photons at exact wavelengths.
A prism transforms one brightness into thousands of data points.
Quick Check: What Does “Temperature” Really Come From?
A headline says: “Scientists measure the temperature of a distant star.”
What did they most directly measure?
~1 min.
Now this is fair: we’ve introduced spectra as “brightness vs wavelength.”
Land: temperature is an inference; wavelength/spectrum is the measurement channel that carries temperature information.
Spoiler 5: The EM Spectrum
- Measure: photons across many wavelengths
- Infer: physical conditions (especially temperature/energy scale)
- Physics: photon energy depends on wavelength \[E \propto \frac{1}{\lambda}\]
- Why it matters later: different telescopes see different physics, not “better pictures”
24–26 min.
Measure: Photons across all wavelengths.
Infer: Different wavelengths = different temperatures.
Physics: Hotter → shorter wavelength.
Key insight: The EM spectrum is a temperature ladder.
Prediction: Same Galaxy, Different Wavelength
You’re about to see the Whirlpool Galaxy (M51) at two wavelengths: visible light and radio (21-cm).
Prediction: Will the two images look the same?
~26 min. Give ~30 seconds to commit.
Prompt: “Same object, two wavelengths. Do you expect the same structures to light up?”
Advance immediately to the reveal slide.
Spoiler 6: Same Galaxy, Different Physics
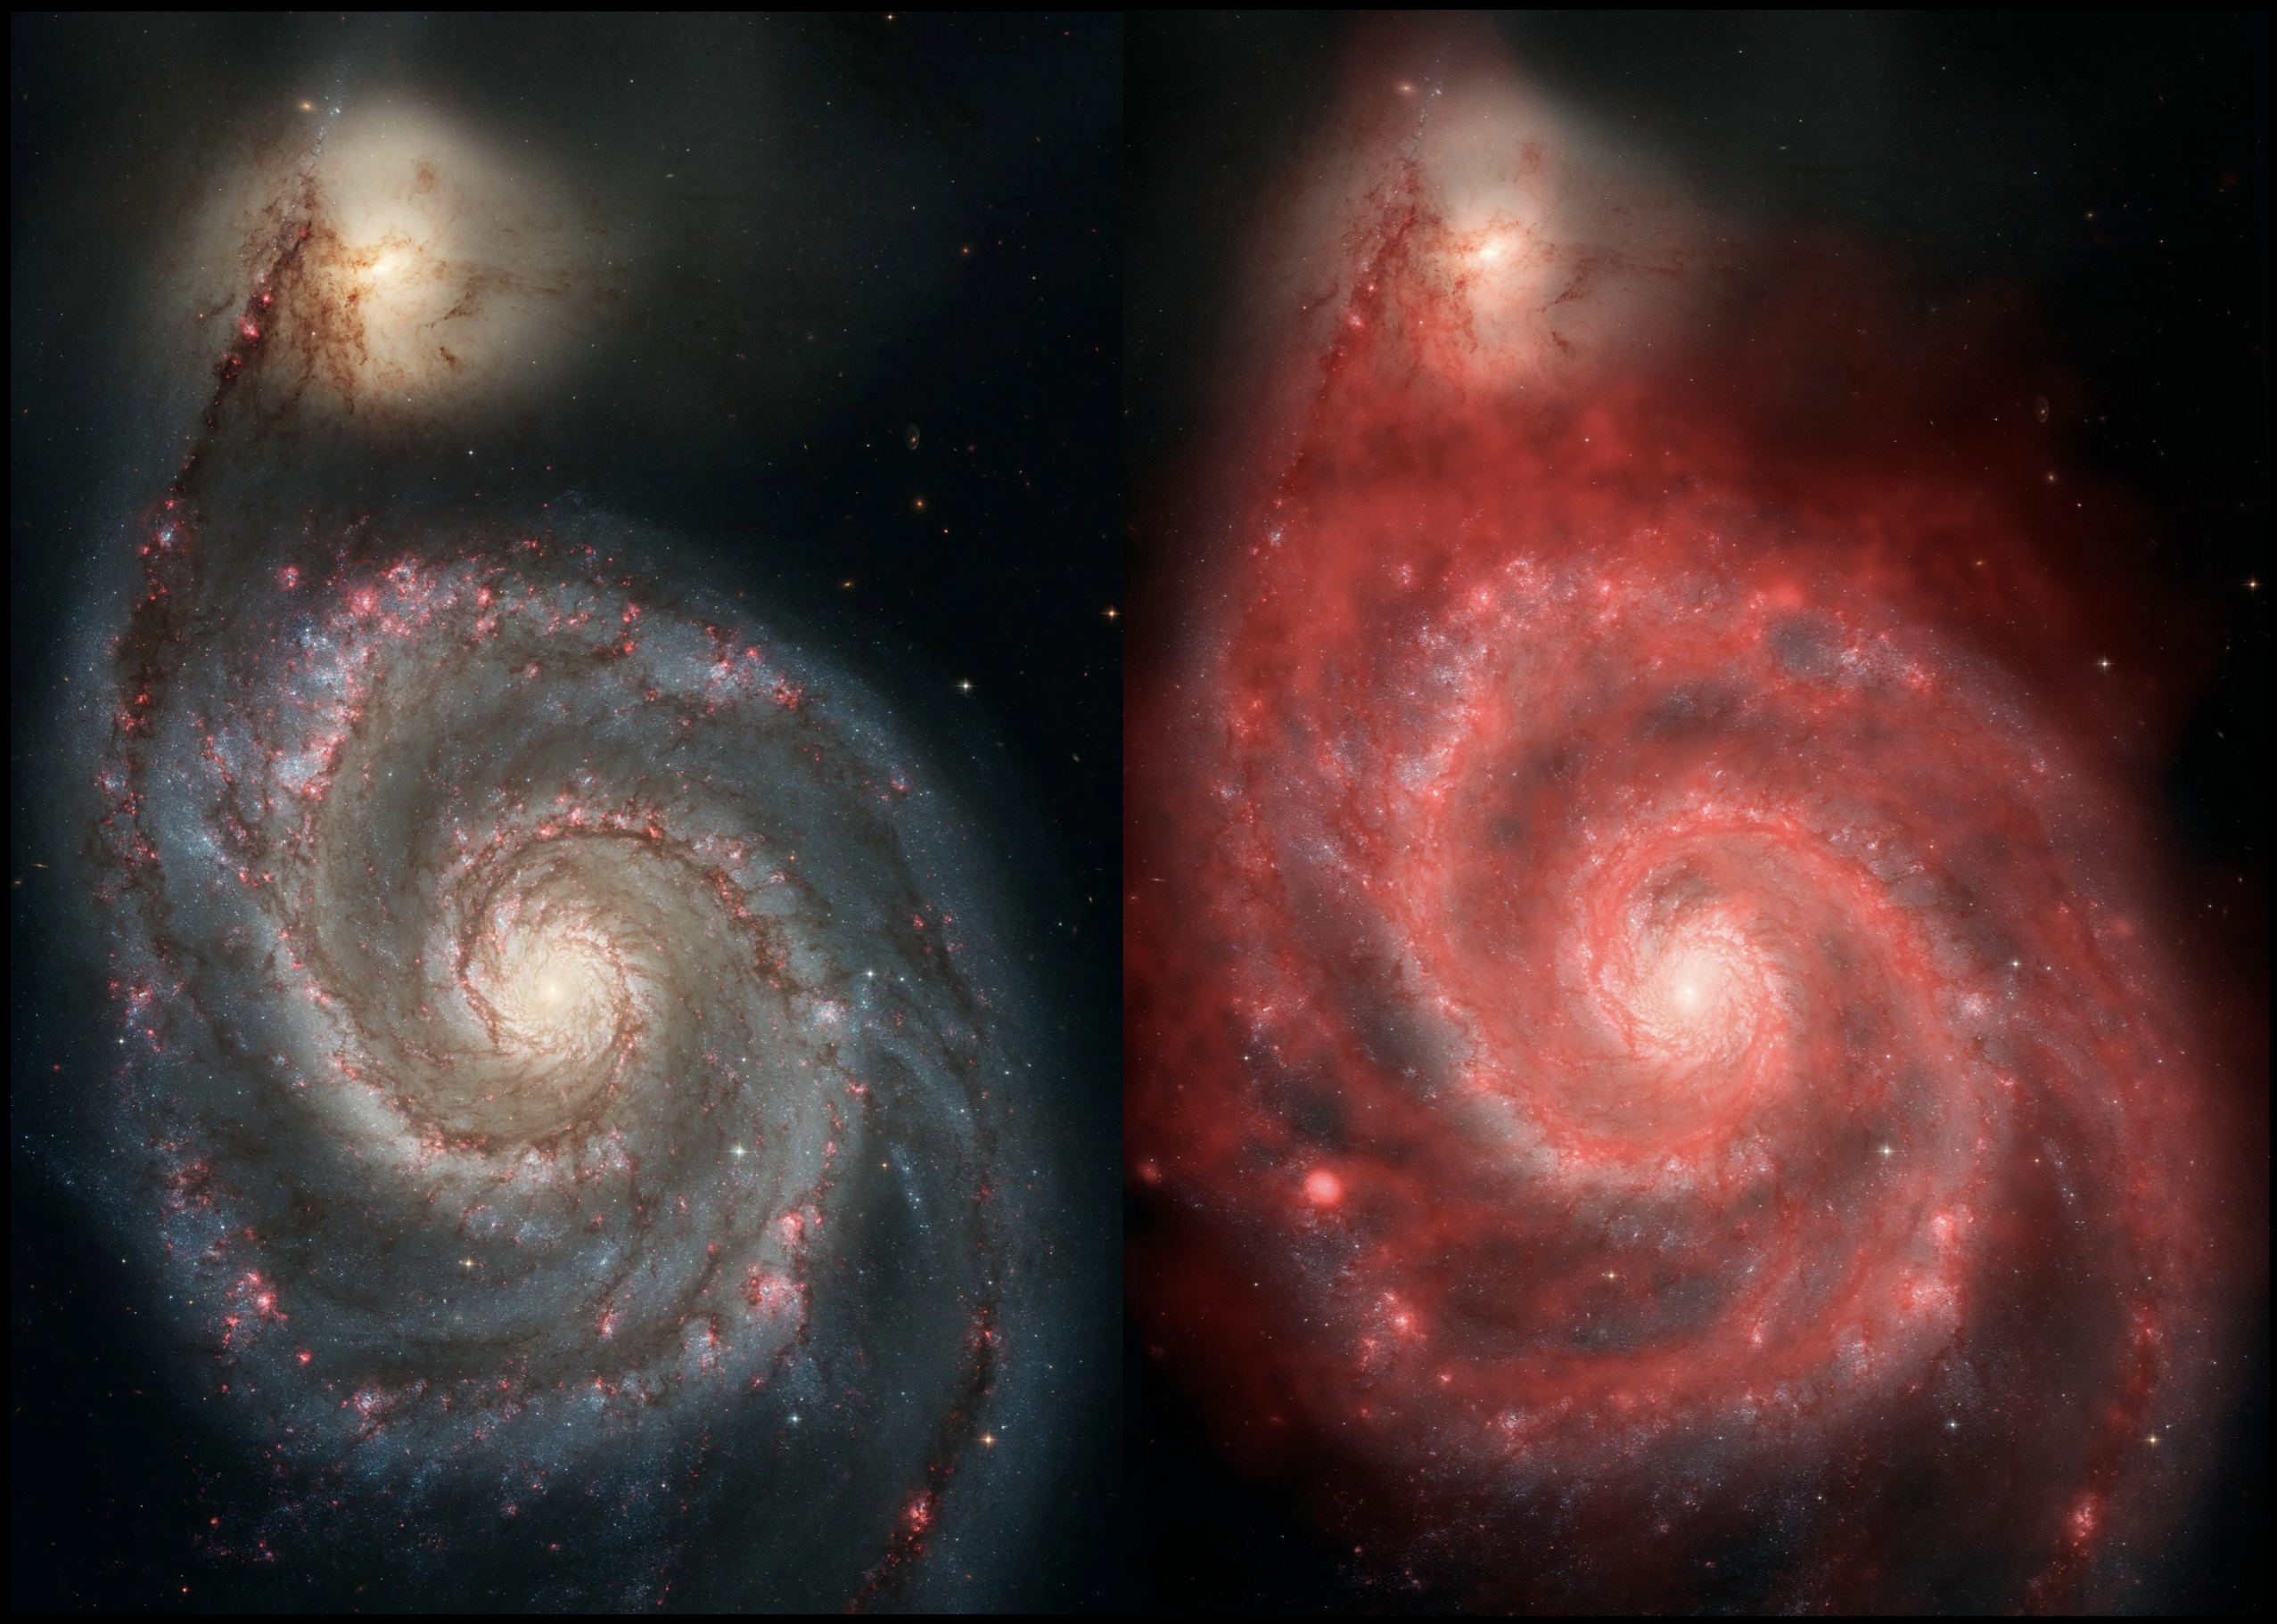
- Measure: optical starlight vs. 21-cm radio emission
- Infer: stars and cold gas live in different places
- Physics: different emission mechanisms dominate at different wavelengths
- Why it matters later: “same object” can mean many different datasets
26–28 min.
If you predicted “No,” you were right: the two images emphasize different physical components.
Left (optical): Stars and dust lanes. Right (radio/21-cm): Cold neutral hydrogen gas.
Key insight: Same object + different wavelength = different component visible.
Pattern Check: Can You Spot the Panel?
Pick one spoiler and say (to yourself):
Measure → Infer → Physics → Why it matters later.
If you can do this for even one example, you’re on track.
~28 min. Actual 20–30 second pause.
Don’t cold-call; this is consolidation, not assessment.
Spoiler 7: Infrared Beats Dust
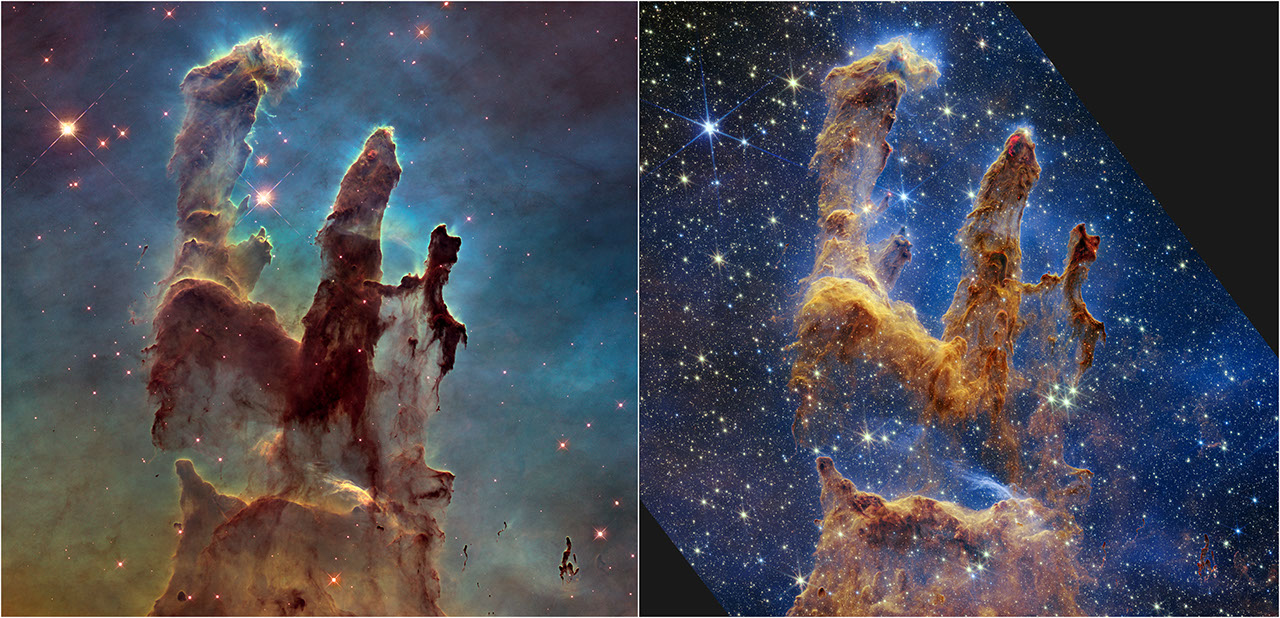
- Measure: optical vs. infrared views of the same region
- Infer: newborn stars can hide inside dusty clouds
- Physics: dust blocks/scatters short wavelengths more than long wavelengths
- Why it matters later: infrared is a star-formation detector
28–30 min.
Left (Hubble optical): Dark, opaque pillars. Right (JWST infrared): Thousands of hidden newborn stars.
Key insight: What you can’t see at one wavelength might be brilliant at another.
Spoiler 8: Many Windows, One Truth
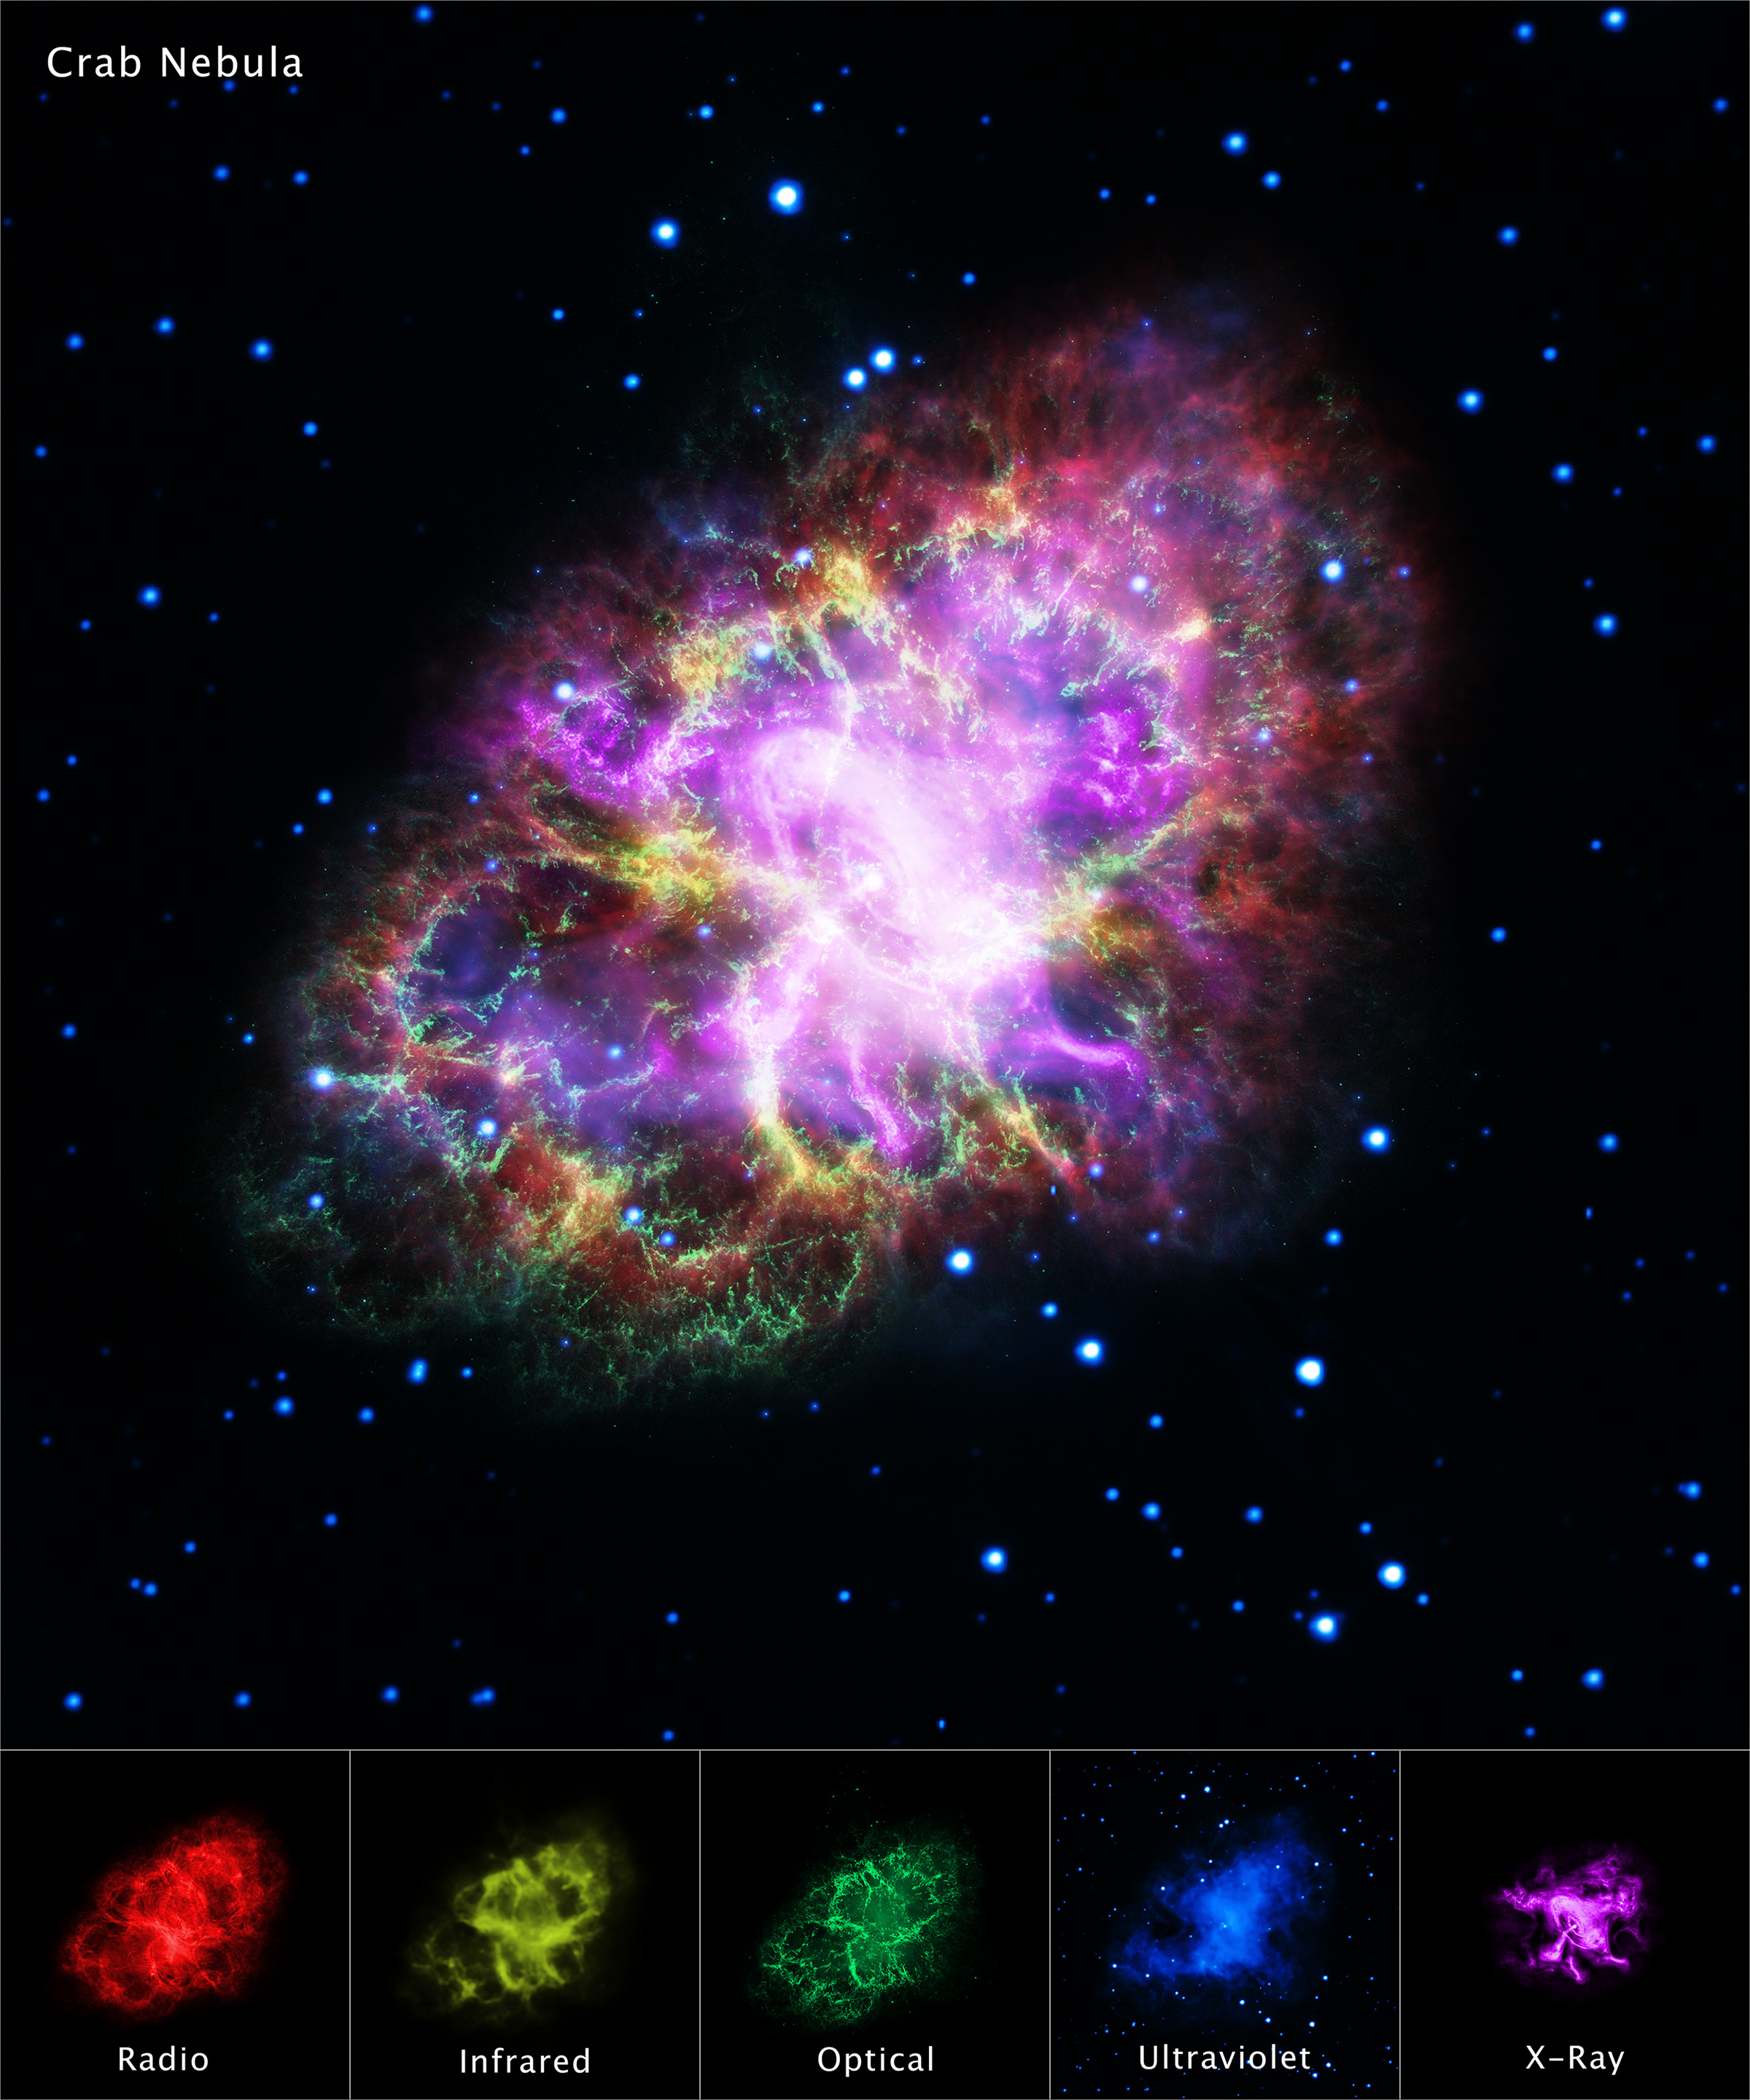
- Measure: the Crab Nebula at multiple wavelengths
- Infer: multiple components coexist (gas, dust, magnetic fields, hot plasma)
- Physics: different wavelengths trace different emission mechanisms
- Why it matters later: we need multi-wavelength “cross-checks,” not single pictures
30–32 min.
- Radio = magnetic fields
- Infrared = warm dust
- Optical = ionized gas from 1054 CE supernova
- X-ray = hot plasma and pulsar jets
Key insight: Only by combining wavelengths do we understand complex systems.
Spoiler 9: The Dark Universe
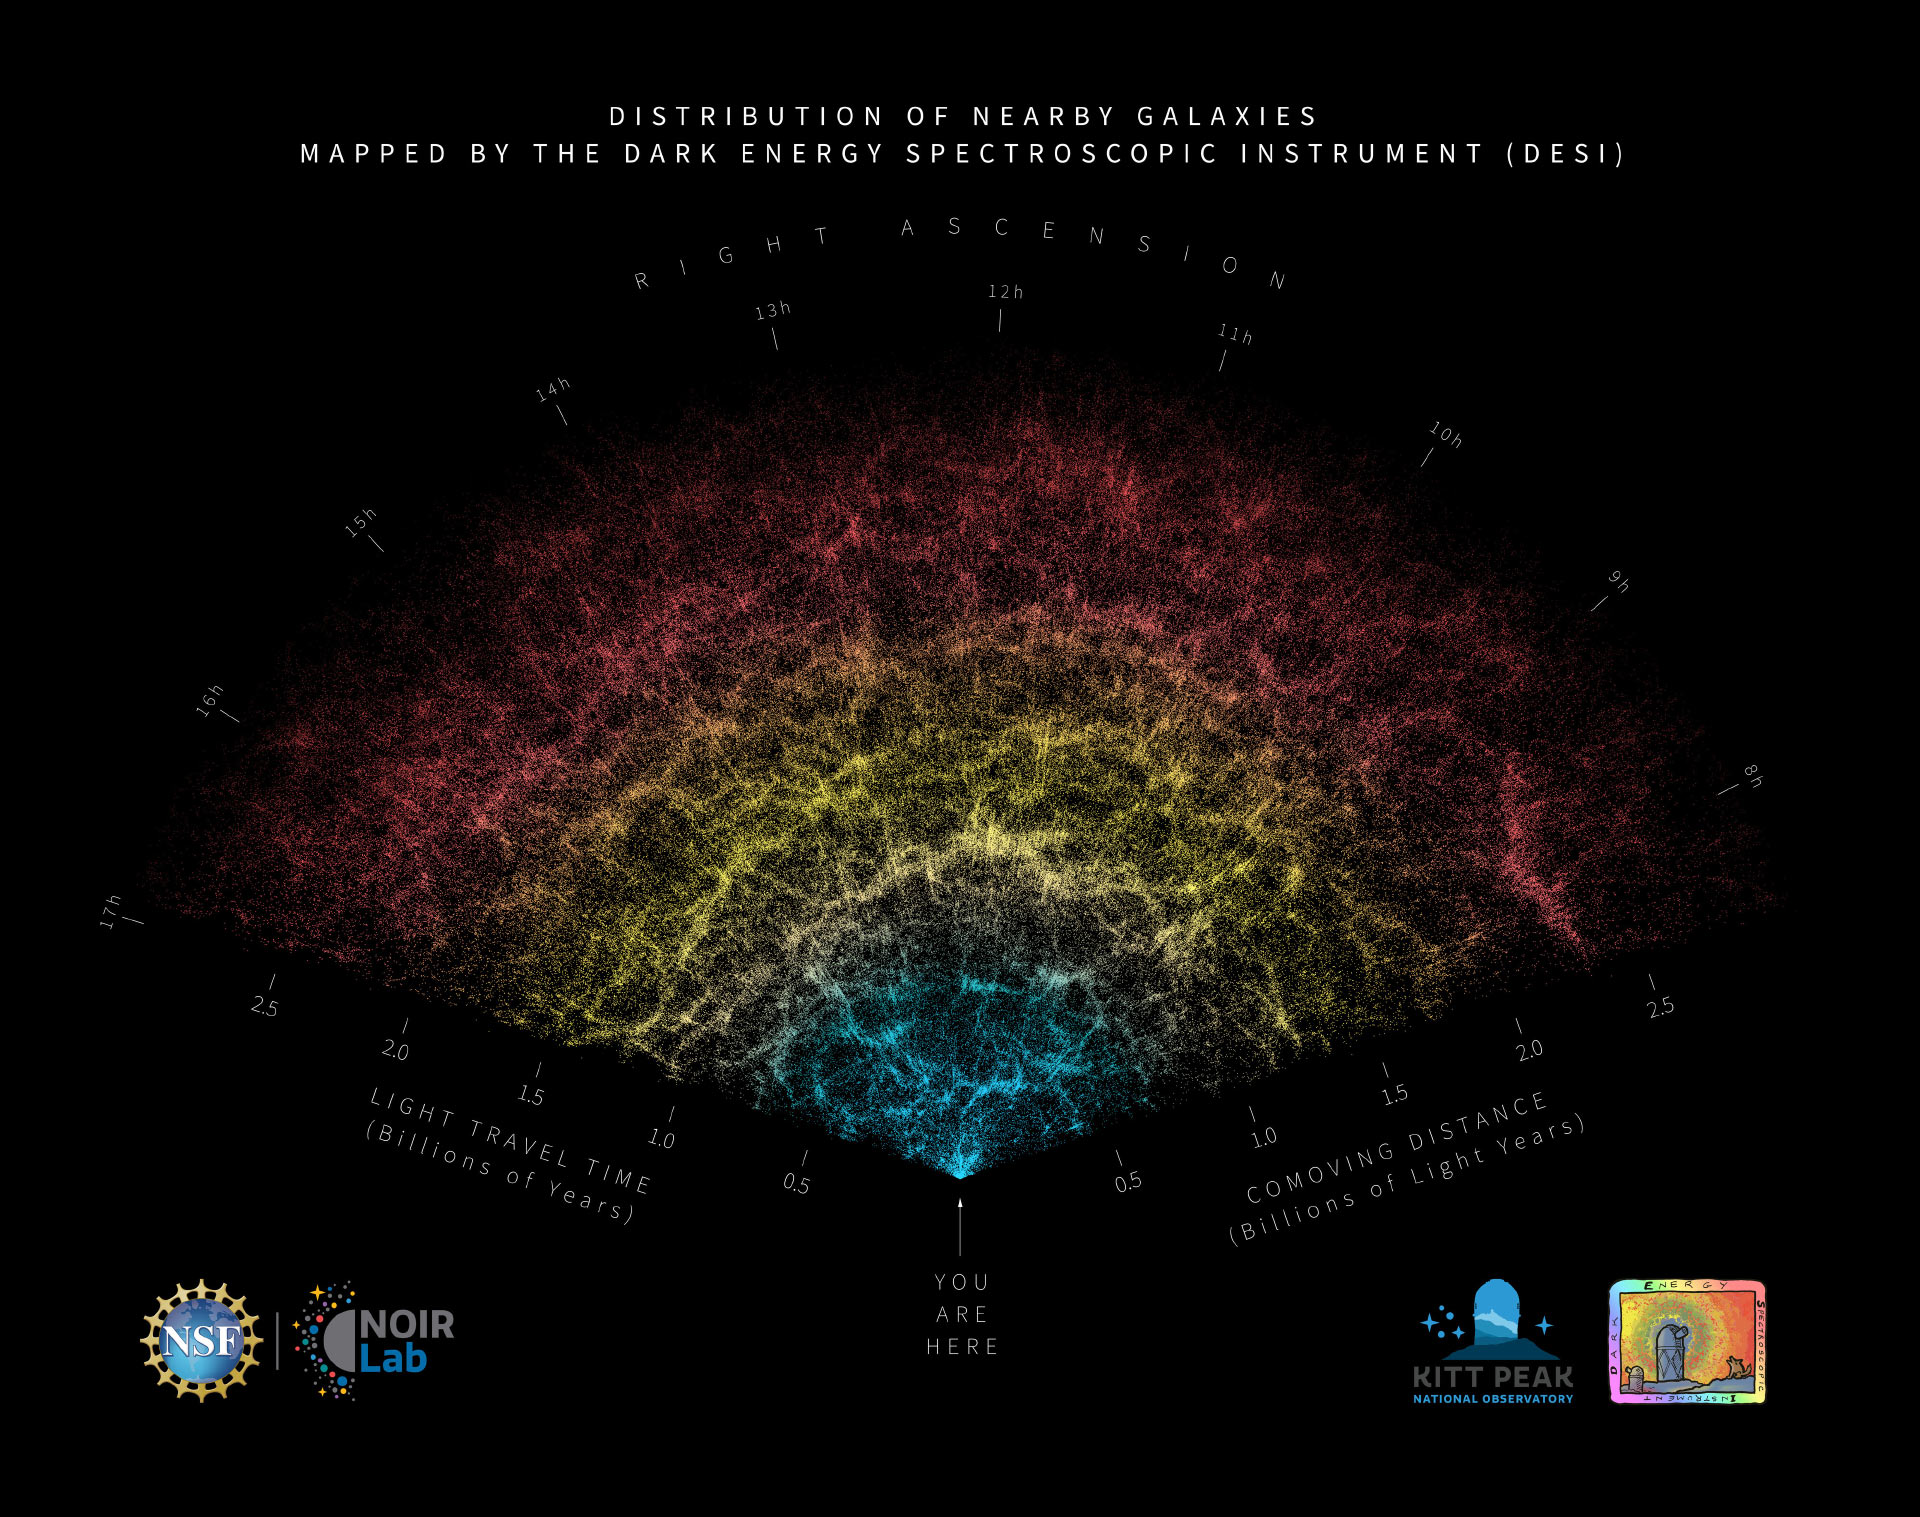
- Measure: velocities (from Doppler shifts)
- Infer: galaxies need more mass than we can see → dark matter
- Physics: gravity links orbital speed to mass \[v^2 = GM/r\]
- Why it matters later: the “missing mass” problem shapes modern cosmology
32–34 min.
Point first to: the filaments, then the voids.
Measure: Velocities via Doppler shifts (spectral lines shift → speeds).
Infer: There must be more mass than we can see (dark matter). In galaxies, rotation curves imply ~5–6× more mass than visible matter. At the largest scales, the cosmic web’s structure also points to invisible mass shaping gravity.
Physics: \(v^2 = GM/r\). Measure \(v\) and \(r\), solve for \(M\).
Cosmic recipe (today): 5% atoms • 27% dark matter • 68% dark energy.
Key insight: We don’t know what most of the universe is made of.
Spoiler 10: Cosmic History
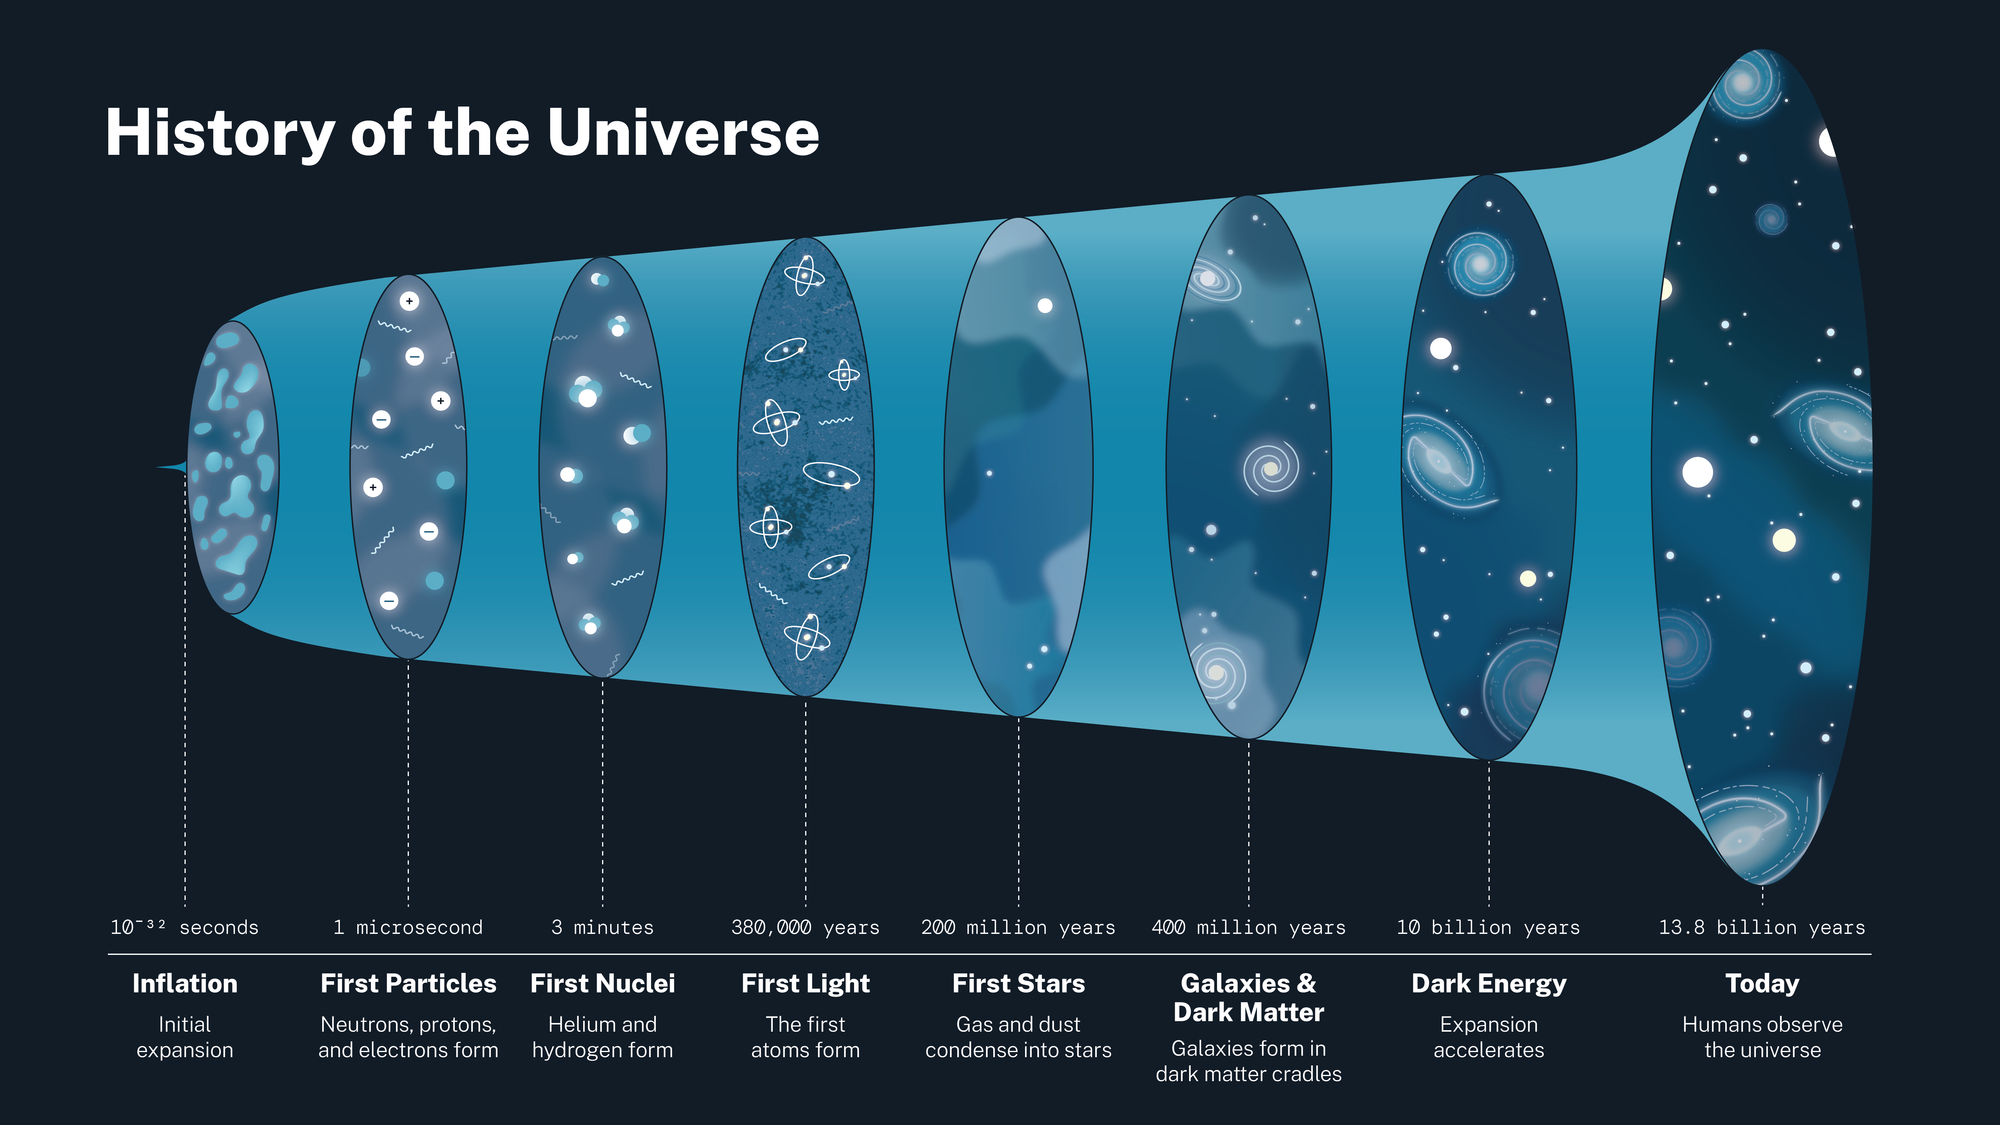
- Measure: distances + redshifts (recession speeds) of galaxies
- Infer: the universe’s age and that expansion is accelerating
- Physics: expansion models traced back to a common origin
- Why it matters later: surprise observations force model revision (dark energy is a placeholder name)
37–40 min.
Measure: Supernova brightness + redshift.
Infer: Universe is 13.8 Gyr old. Expansion is accelerating.
EXACT SCRIPT:
“This result was not predicted. The universe did something we didn’t expect, and cosmology had to revise its models. That’s not a failure of science — that’s how science works.”
Spoiler Reel Synthesis: The Pattern Repeats
Spoiler Reel Synthesis: The Pattern Repeats
Every spoiler followed the same structure: Measure → Infer → Physics.
Which observable appeared most often?
(Hint: it starts with “W”.)
40–41 min. SYNTHESIS MOMENT
Ask: “Which of the four observables kept showing up?” → Wavelength (spectrum).
Bridge: “Spectroscopy is the workhorse of astronomy. Now let’s connect two spoilers using one wavelength idea: Doppler shifts.”
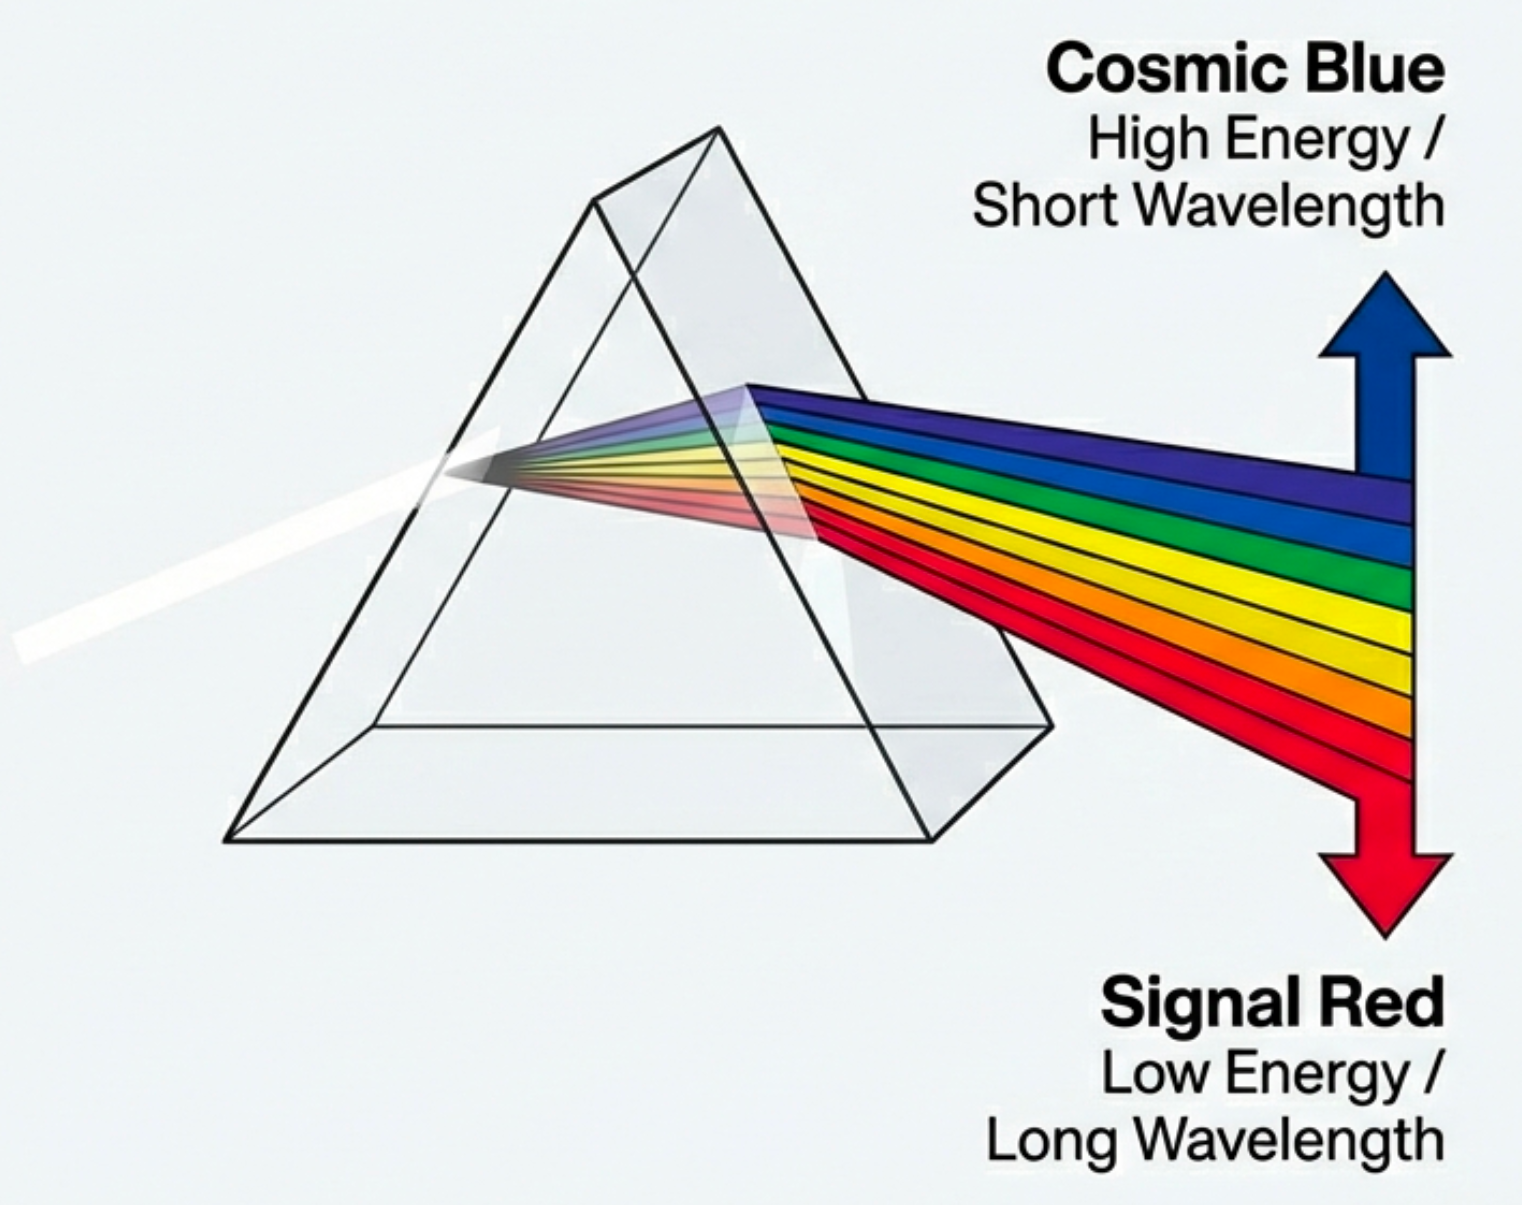
Doppler: The Fingerprint Shifts
Toward you → wavelengths compress (blueshift)
Away from you → wavelengths stretch (redshift)
The fingerprint stays the same — just shifted.
41–43 min. EXACT SCRIPT:
“The Doppler effect is hard. Many students try to avoid it. Don’t. This single idea powers huge parts of astronomy — dark matter, galaxy motion, and the expansion of the universe. You do not need to understand it today. You do need to recognize that it matters.”
Connecting the Dots: Doppler Shows Up Everywhere
Where Doppler Appears:
- Galaxy rotation curves → dark matter
- Cosmic expansion → accelerating universe
- Star wobbles → exoplanets
- Binary stars → masses
One idea. Many applications.
43–44 min.
Say: “You don’t need to understand Doppler today. You need to recognize that it matters—and that it’s a wavelength measurement.”
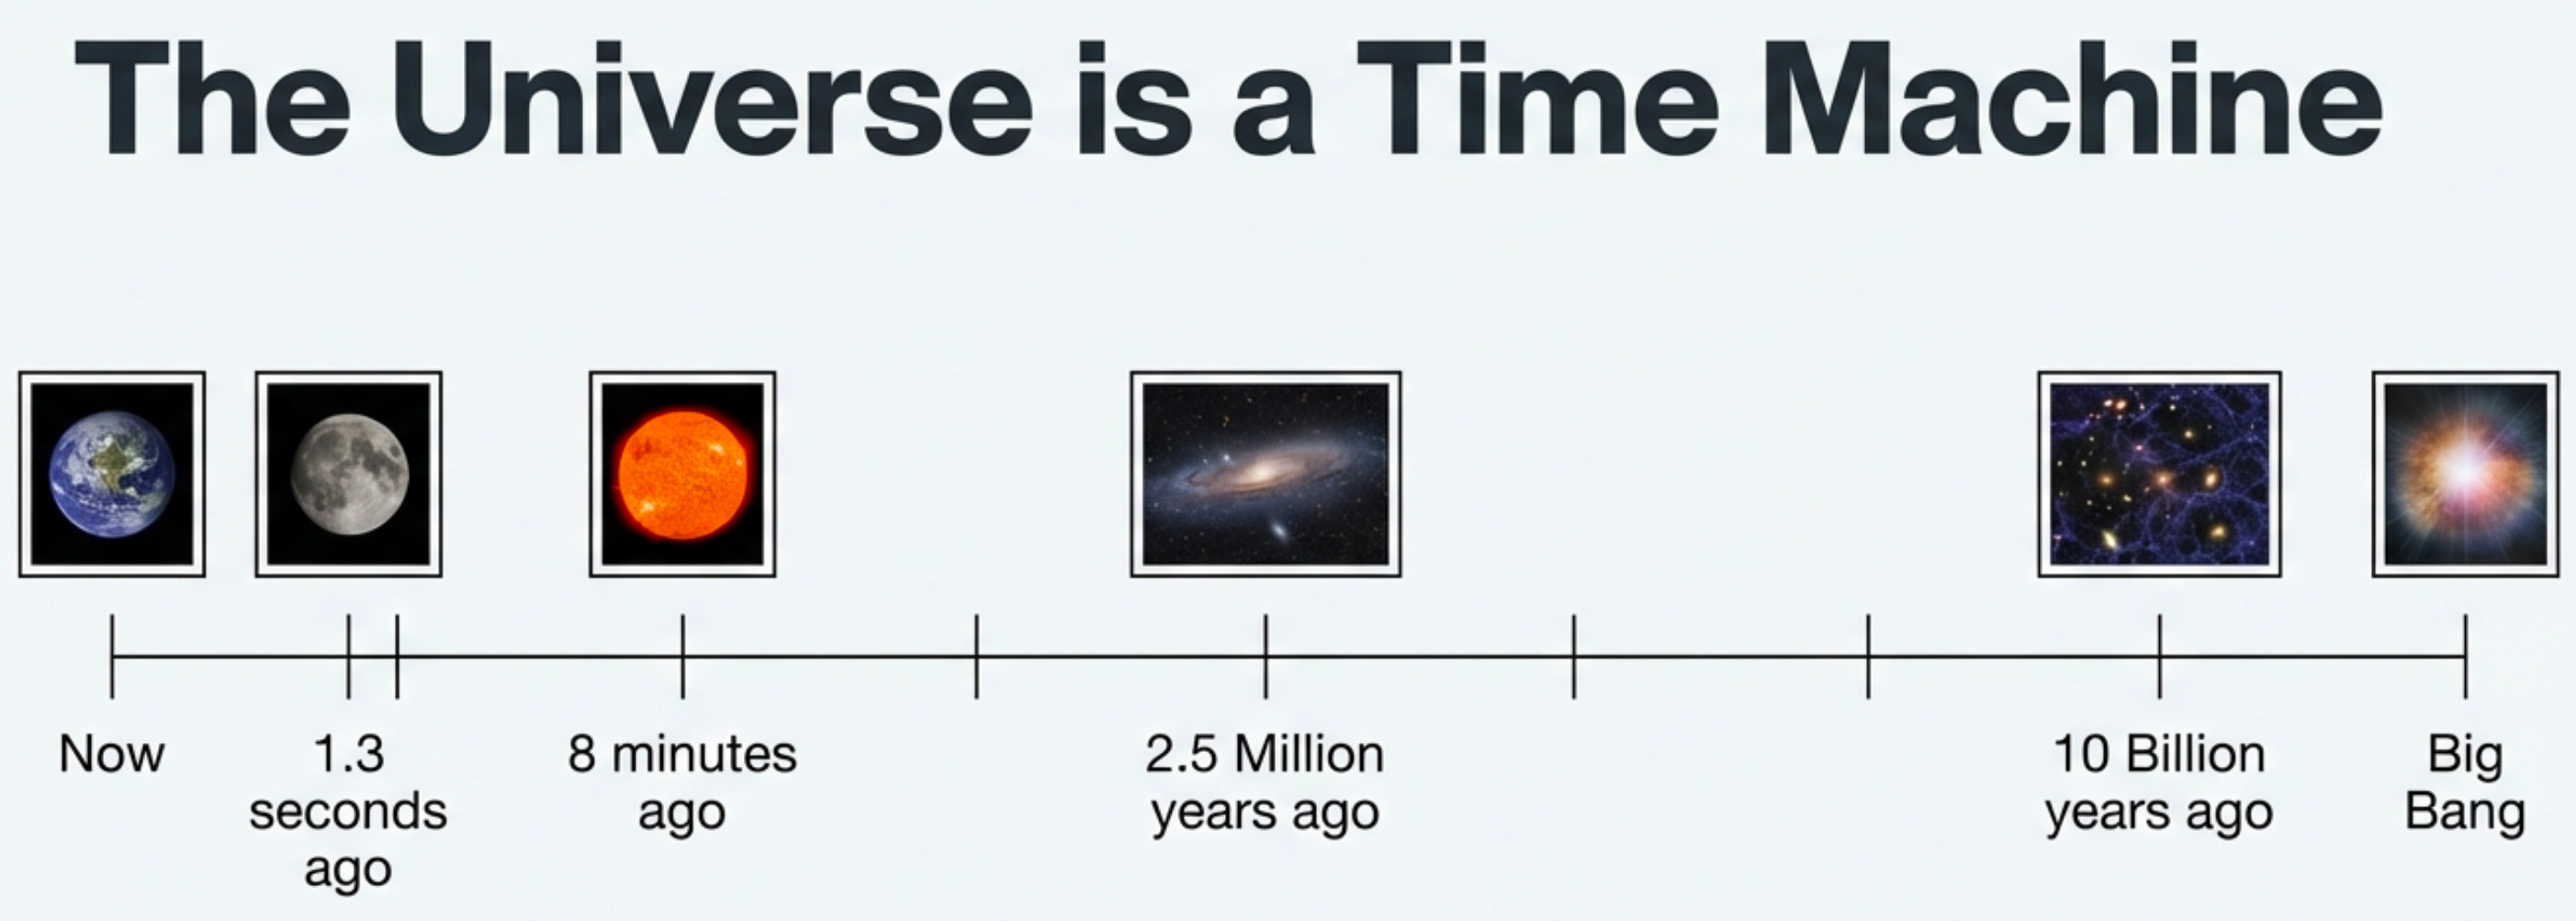
Lookback Time: Distance Is a Time Dial
| Object | You see it as it was… |
|---|---|
| The Moon | 1.3 seconds ago |
| The Sun | 8.3 minutes ago |
| Andromeda | 2.5 million years ago |
| Distant galaxies | billions of years ago |
Looking far away means looking into the past.
44–46 min.
Point first to “now,” then walk outward (Moon → Sun → Andromeda → distant galaxies).
Land: this isn’t a limitation—it’s a feature. Distance is a time dial.
Quick Check: Lookback Time
You observe a galaxy 100 million light-years away.
When did the light you’re seeing leave that galaxy?
~46 min. Give ~30 seconds.
Correct: 100 million light-years means the light traveled for 100 million years.
Orientation: The Wave Relation
\[c = \lambda \nu\]
- \(c\) = speed of light (constant)
- \(\lambda\) = wavelength
- \(\nu\) = frequency
~47 min. EXACT SCRIPT:
“When you see equations today, I’m not asking you to use them yet. Some equations are here just to show relationships. Others become tools later. Today, you’re just learning what exists — not how to wield it.”
Orientation note (for reference): Units check: wavelength (cm) × frequency (1/s) = cm/s = speed ✓. Longer wavelength ↔︎ lower frequency (inverse relationship). We’ll scaffold this fully in the Light & Spectra lectures.
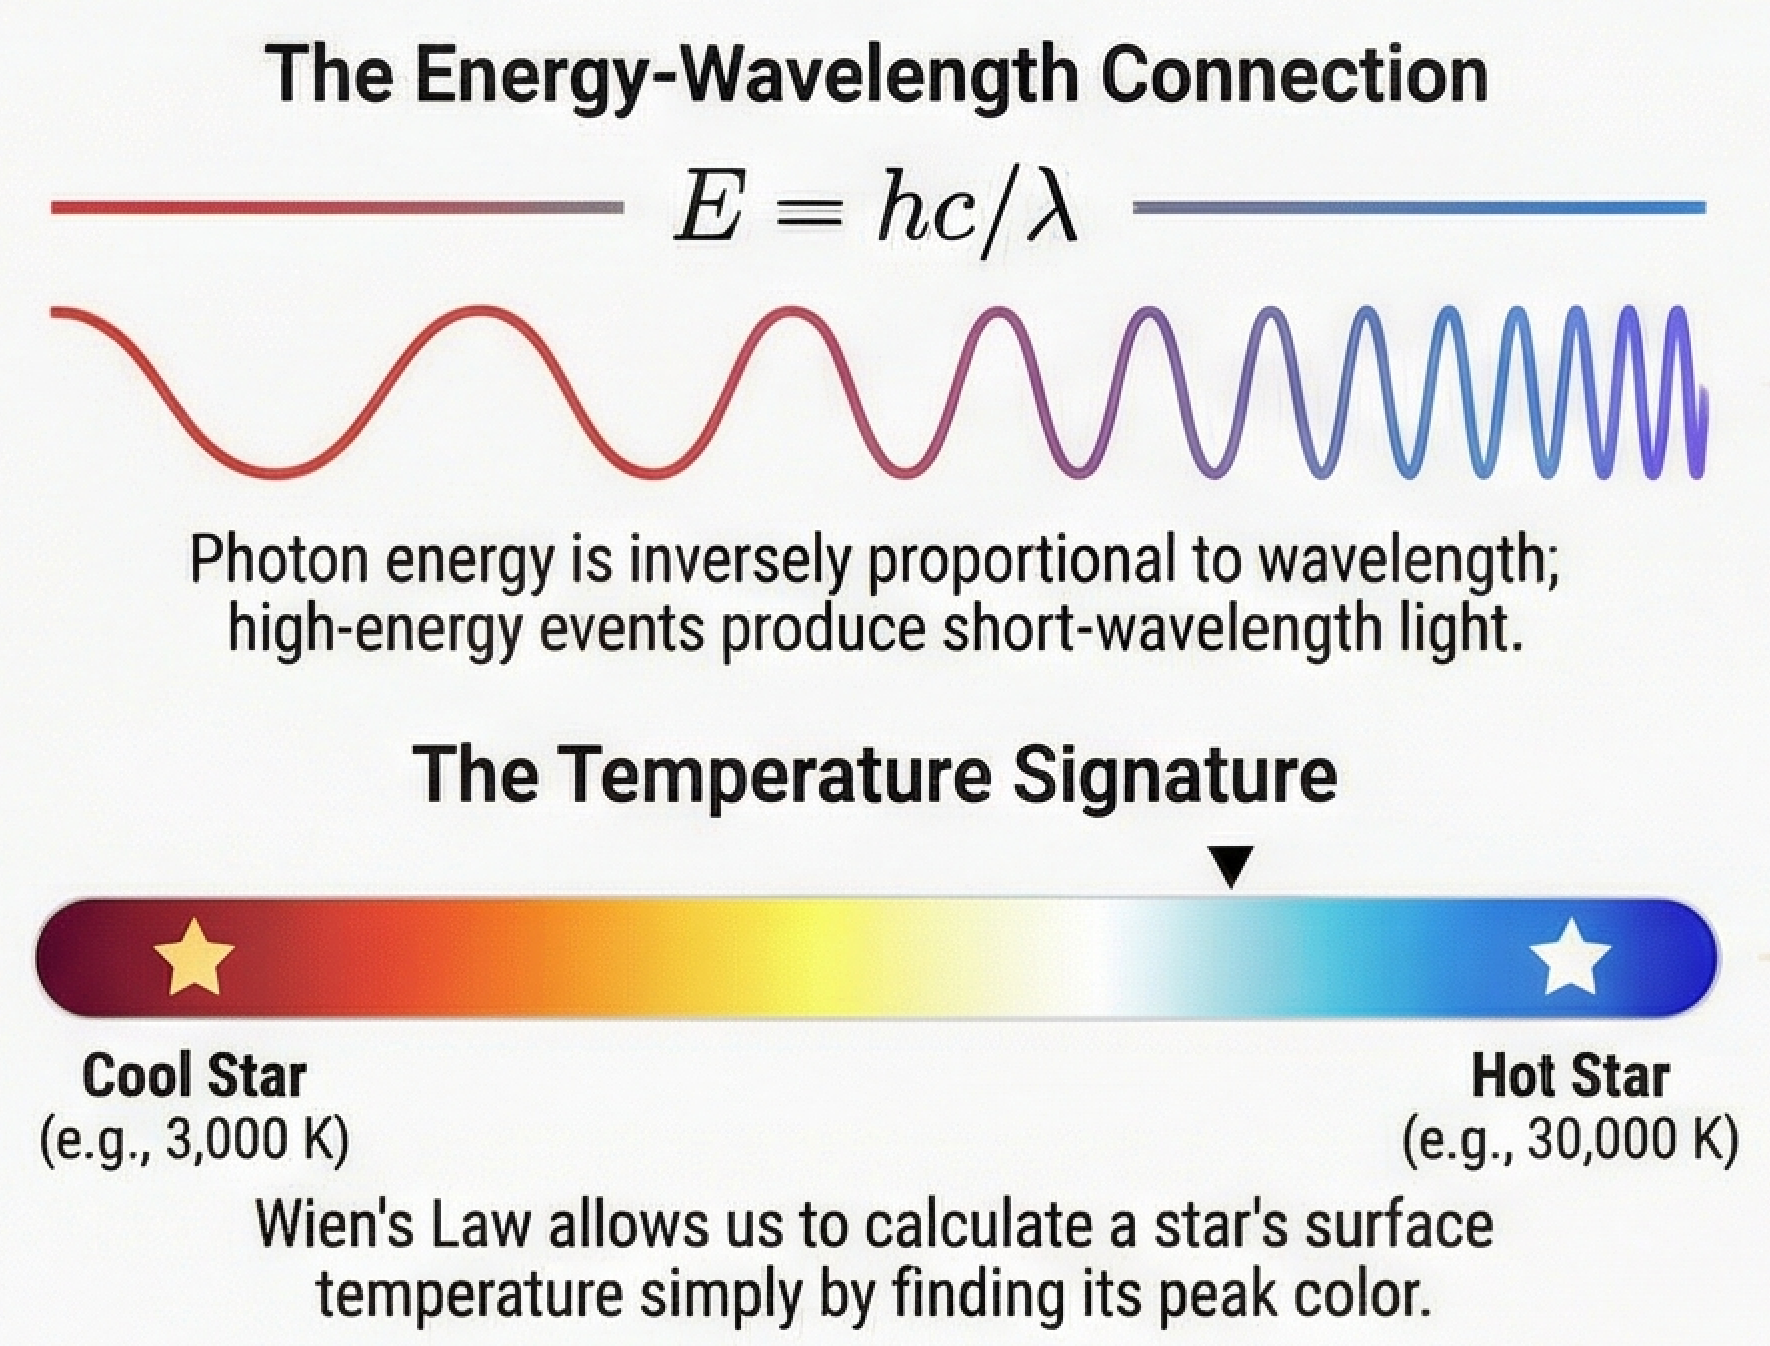
Orientation: Photon Energy
\[E = h\nu = \frac{hc}{\lambda}\]
- \(E\) = photon energy
- \(h\) = Planck’s constant
- Shorter \(\lambda\) → higher energy
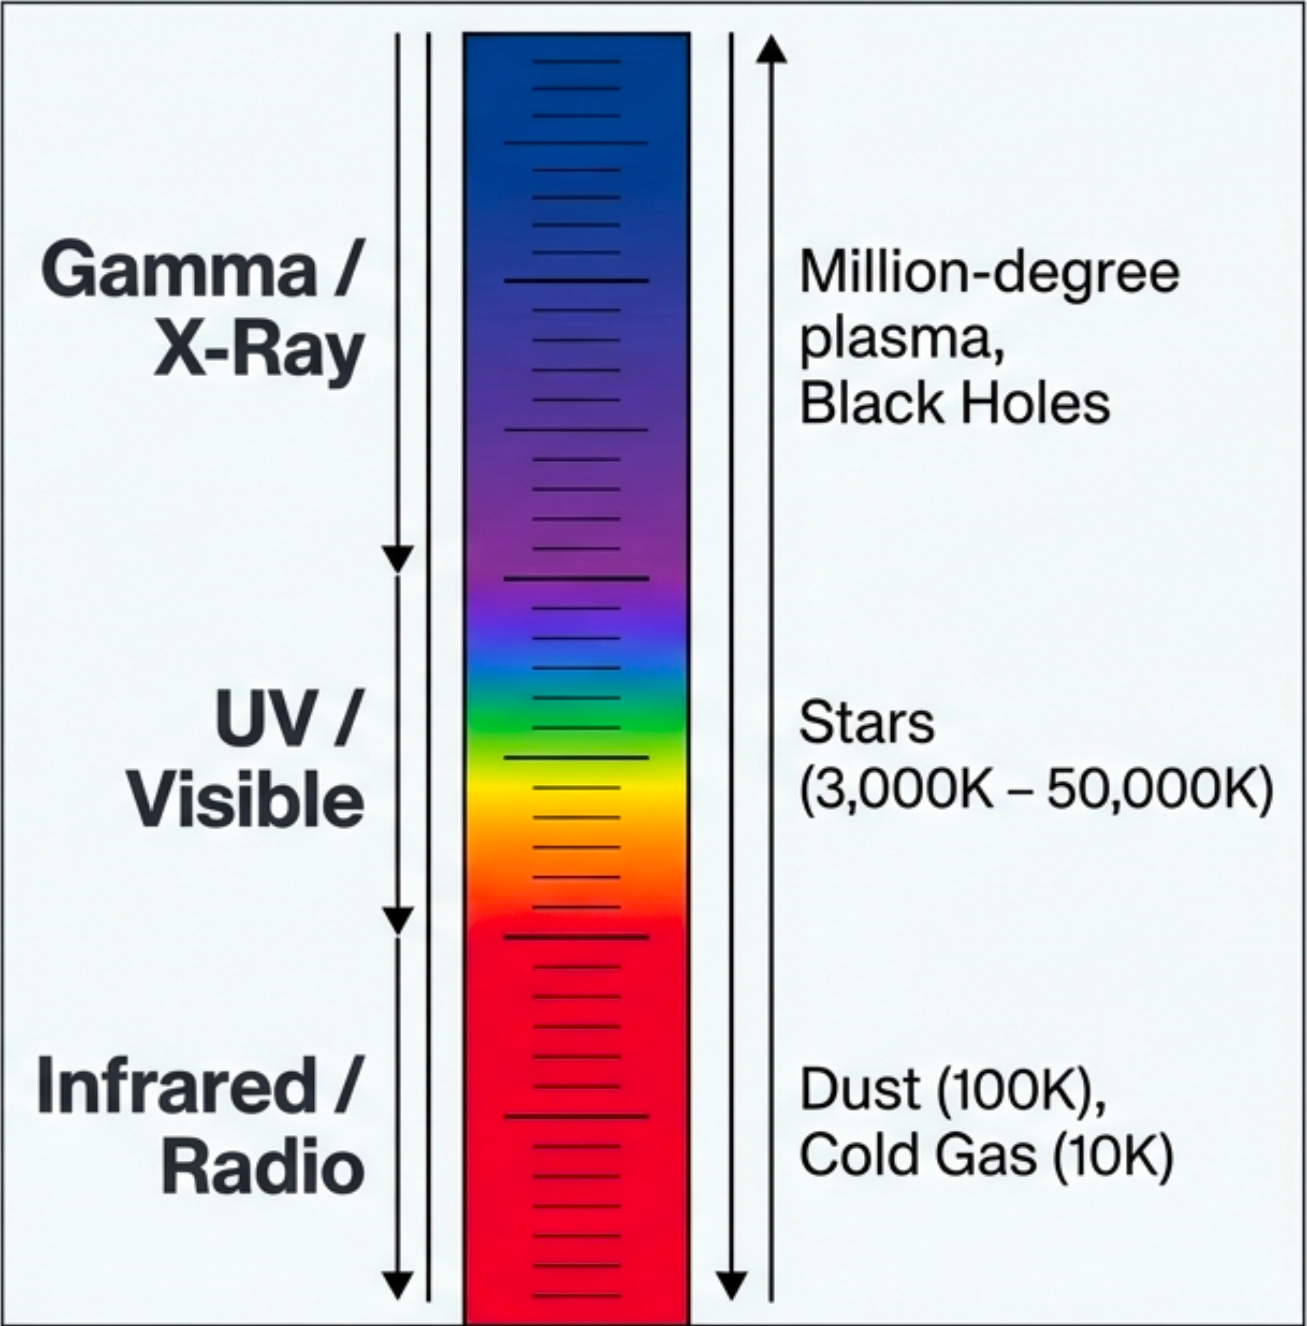
X-rays probe million-degree plasma. Radio probes cold gas.
~48 min. THE PUNCHLINE:
This is why different wavelengths reveal different physics. It takes hot, violent processes to produce high-energy (short-wavelength) photons.
- Radio photons: cold gas, magnetic fields
- Visible photons: stellar surfaces (~5000 K)
- X-ray photons: million-degree plasma, black hole accretion
Key insight: The EM spectrum isn’t arbitrary—it’s a temperature/energy ladder organized by physics.
Prediction: X-ray vs. Radio Energy
Compare: an X-ray photon (\(\lambda \approx 1\ \text{nm}\)) vs. a radio photon (\(\lambda \approx 1\ \text{m}\)). n = nano \(= 10^{-9}\)
How much more energy does the X-ray have?
~49 min. Give ~45 seconds.
Ratio reasoning: since \(E \\propto 1/\\lambda\), the energy ratio is the inverse wavelength ratio: \(1\\ \\text{m} / 1\\ \\text{nm} = 10^9\).
The Decoder-Ring Pipeline
Signal → Measurement → Model → Inference → Prediction → Test → revise
49–51 min.
Walk one concrete example through the pipeline (pick any spoiler).
Land: when tests fail, we revise models. That’s science.
What You Can Do Now
- Thesis: pretty pictures → measurements → models → inferences
- Observables: brightness, position, wavelength, timing
- Six quantities: distance, time, speed, mass, luminosity, temperature
- Spoiler panel: Measure → Infer → Physics → Why it matters later
- Lookback time: distance is a time dial
~1 minute. Read the list once, then say: “Recognition, not mastery.”
The Tools We Build Answer Big Questions
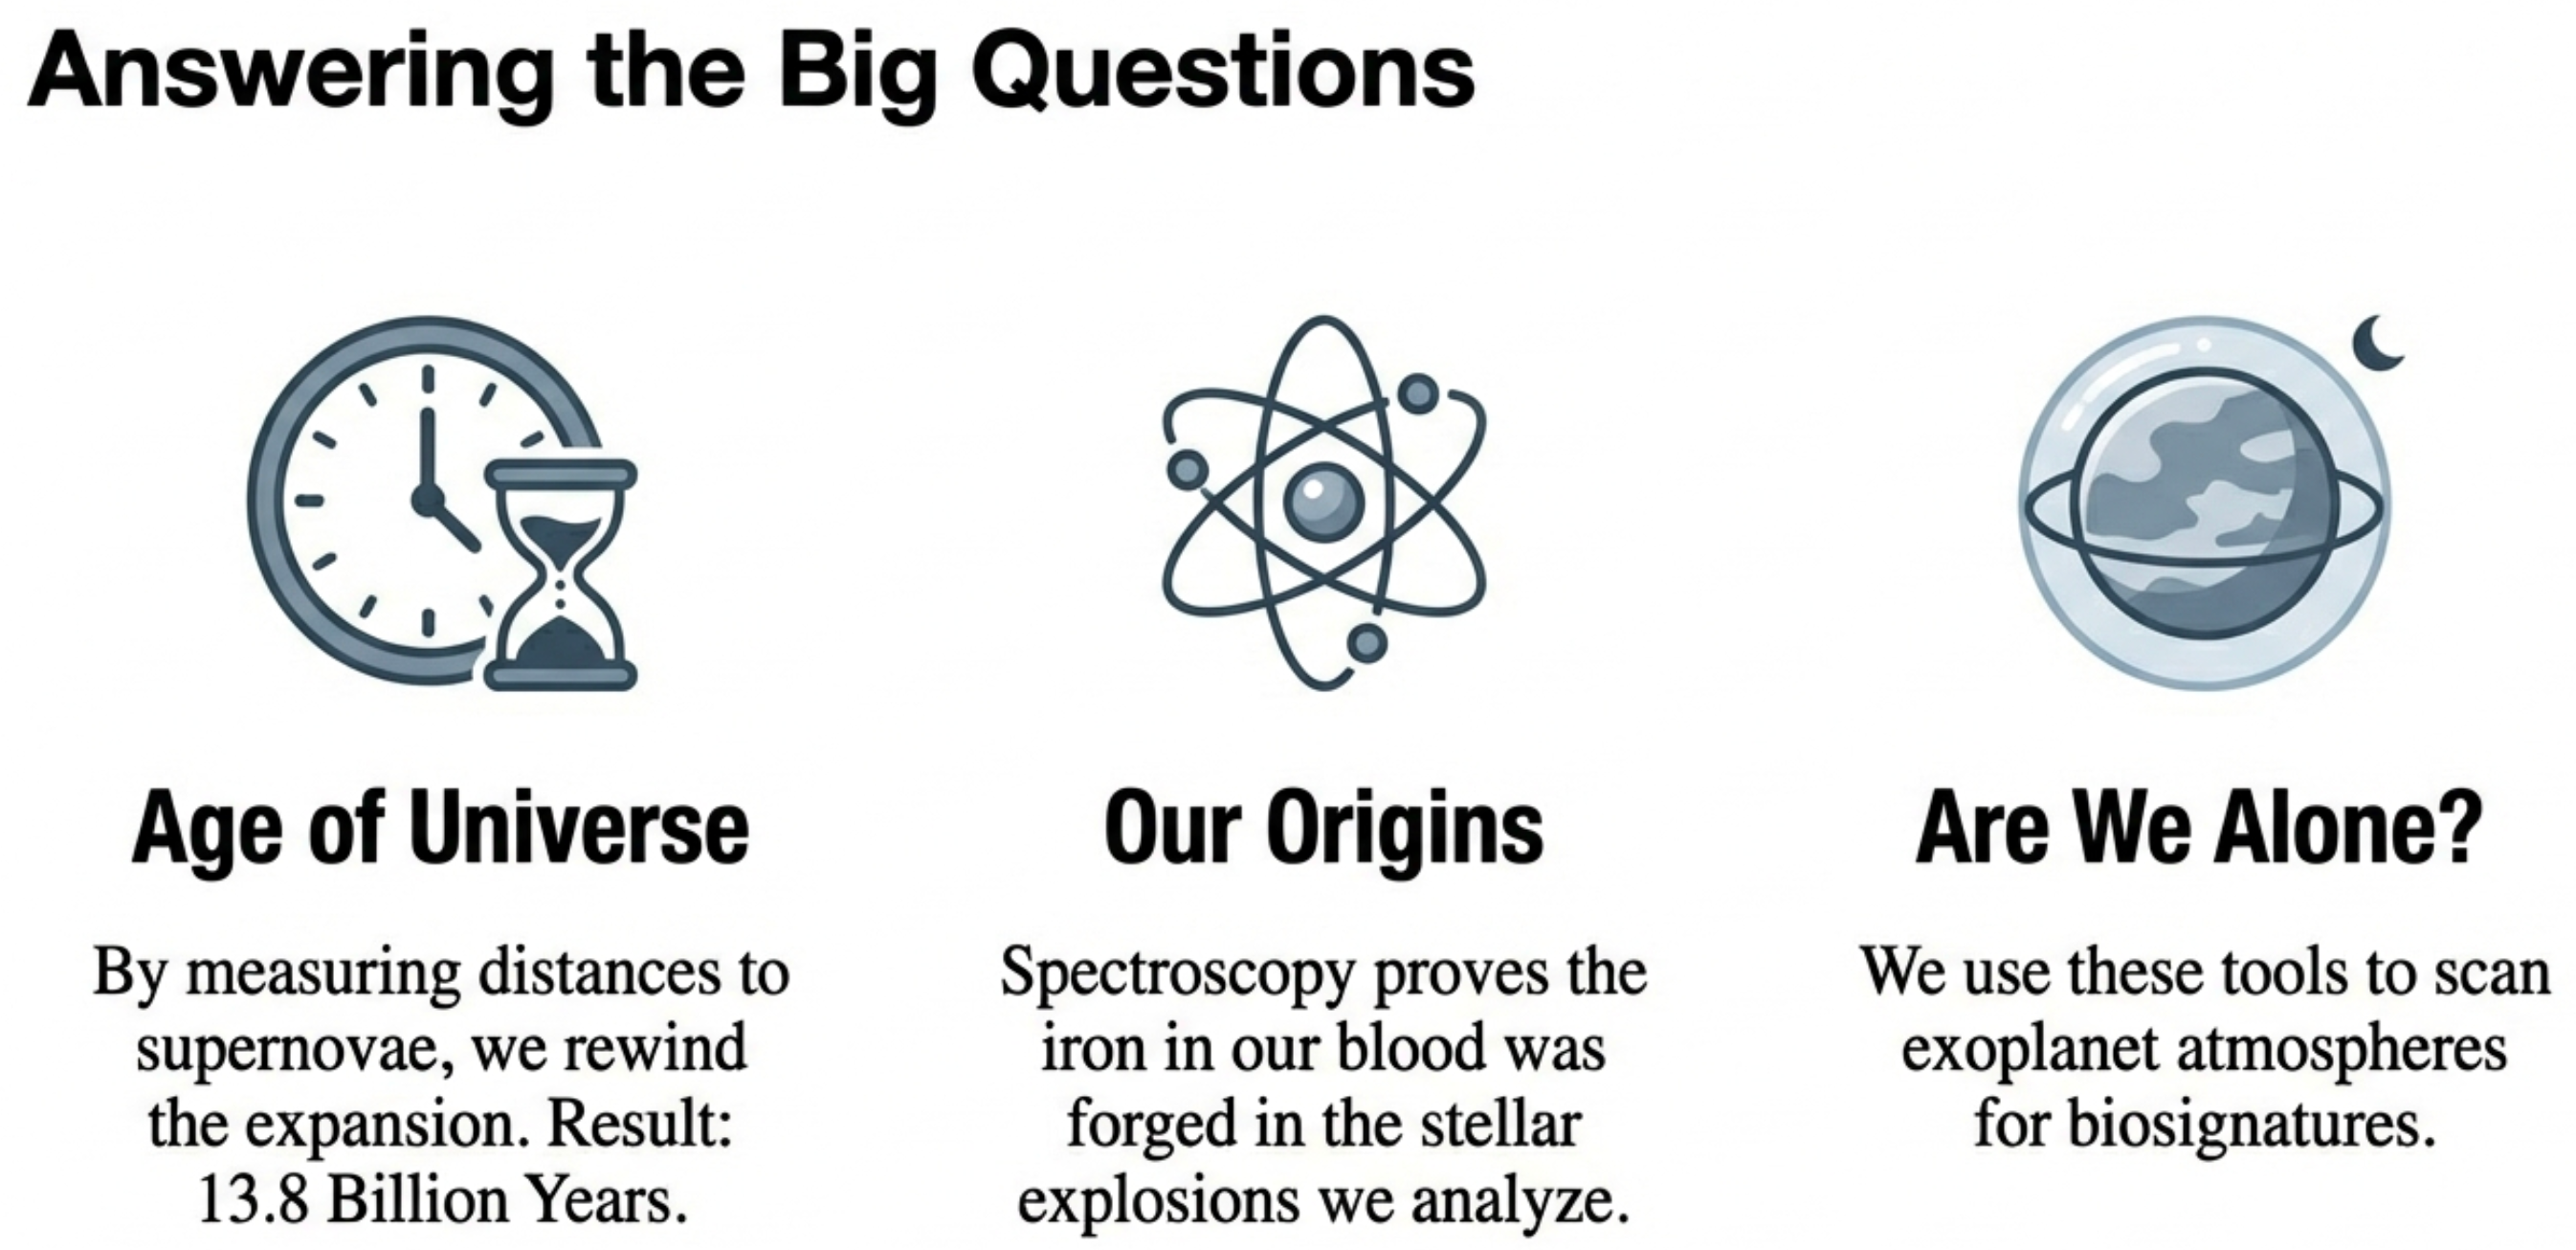
50–52 min. The tools we’ll learn answer humanity’s biggest questions:
- Distance measurements give the universe’s age
- Spectroscopy proves our stellar origins
- Atmospheric analysis searches for life
Recognition, not retention
Recognition, not retention.
You are not expected to remember details yet.
You are expected to recognize ideas when we return.
52–54 min. EXACT SCRIPT:
“If this felt overwhelming at moments, that’s a sign this worked. You are not expected to remember details yet. You are expected to recognize ideas when we return to them — and by the end of the semester, you’ll be able to say these things with confidence.”
Next Time: Math Boot Camp
Thursday: Math Boot Camp
- Scientific notation
- Orders of magnitude
- Dimensional analysis
- Ratio reasoning
The math is not the obstacle — it’s the microscope.
Questions?
Leave time for questions about the big picture.