Lecture 4 (Day 1):
Light as Information
Spectrum • Photons • Interactions • Temperature
Learning Objectives
By the end of today, you will be able to:
- Relate wavelength (\(\lambda\)), frequency (\(\nu\)), and photon energy (\(E\))
- Explain why the visible band is a tiny slice of the EM spectrum
- Describe the main ways light interacts with matter (absorb, emit, transmit, reflect/refract, scatter)
- Use Wien’s law to estimate temperature from a thermal spectrum’s peak
Read these aloud. Framing: this is “inference tool #1” for the course. Timing: ~2 min.
How can a rainbow tell you a star’s temperature?
Let this sit for 5 seconds. Today’s arc: what we measure (light) → what we infer (temperature) using a model (blackbody).
The Course Throughline
Today’s Piece
Measure → Infer → Balance → Evolve
- Measure: intensity vs wavelength (a spectrum)
- Infer: temperature (soon: composition)
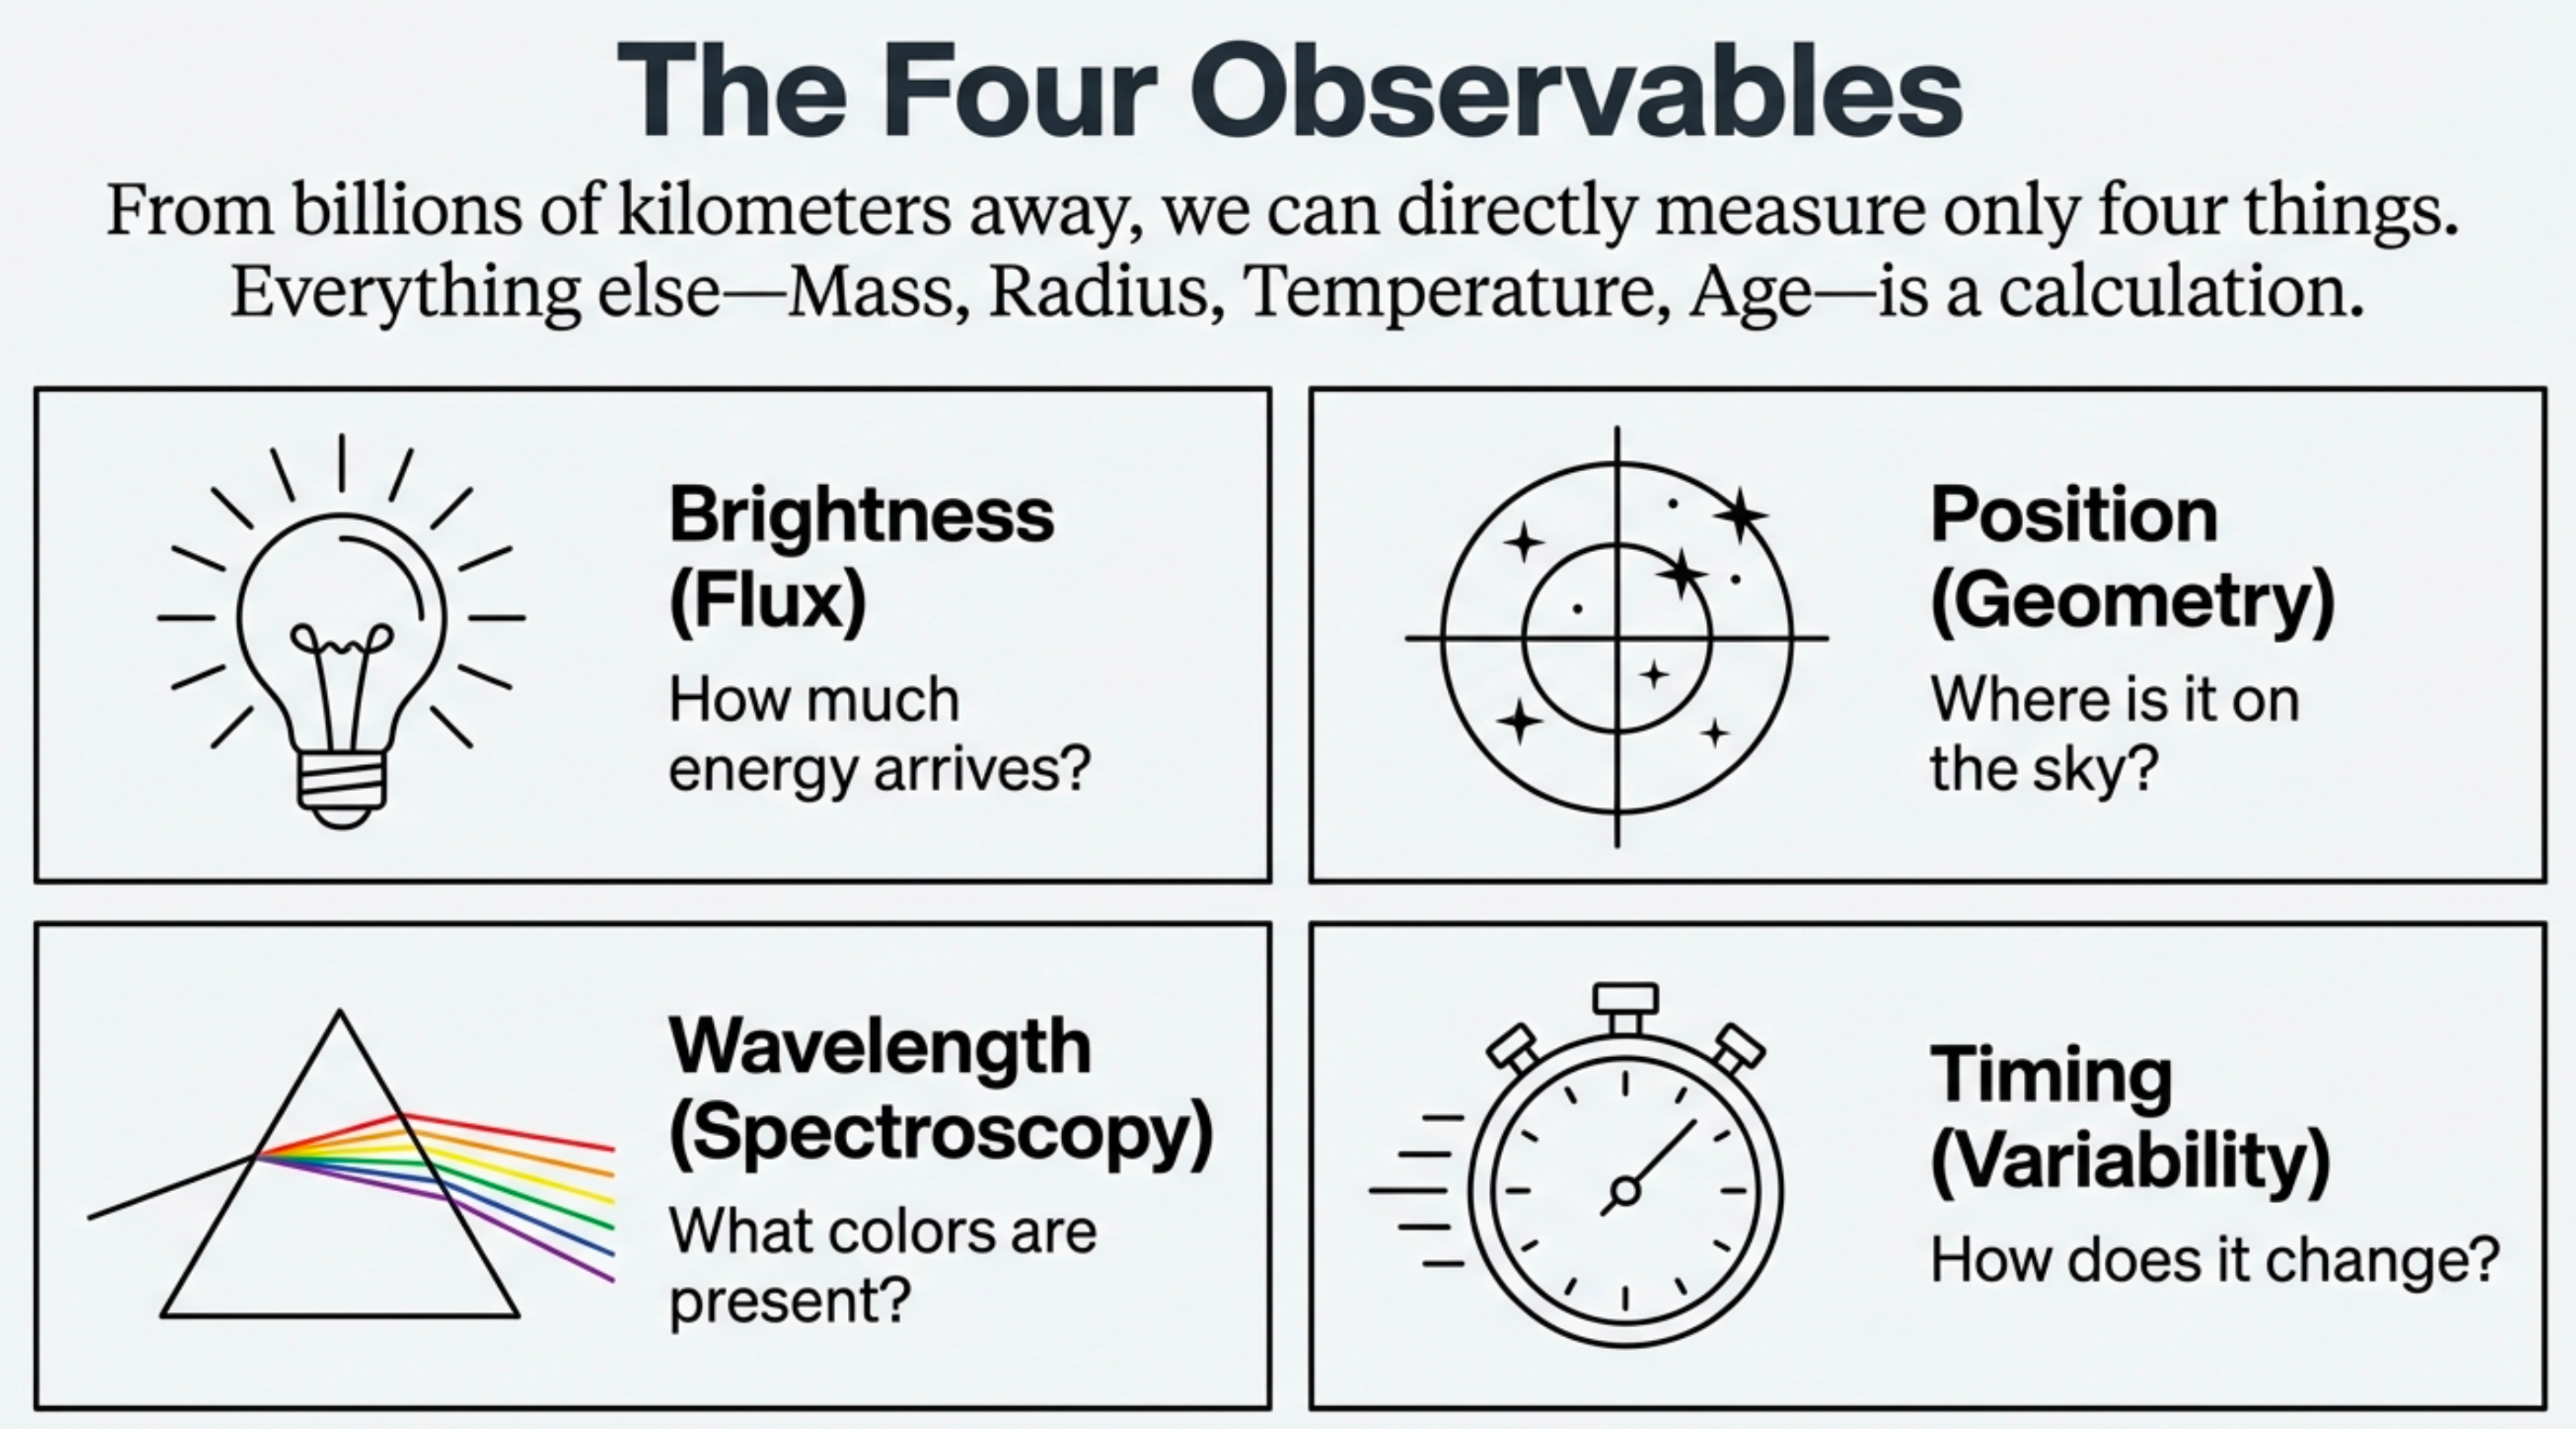
Point to Wavelength. Tie to Lecture 1: “we only measure four things”.
A “Pretty Picture” Is Still Data
Brightness patterns + color patterns = physics patterns.
Ask: What could color mean? (temperature, dust, emission lines) Today: temperature first.
Today’s Game Plan
We’re building inference tool #1:
- What light is (spectrum)
- How light carries energy (photons)
- How matter changes light (interactions)
- How color encodes temperature (blackbody + Wien)
End: quick demos (if time) to lock the intuition.
Set expectations: lots of short slides on purpose — one idea at a time. Pacing target (flexible): Part 1 (~15 min), Part 2 (~10 min), Part 3 (~15 min), Part 4 (~20 min), demos (~5–10 min).
The Wave Relation
The symbol \(c\) is the speed of light in vacuum.
\[ c = \lambda \nu \tag{1}\]
- In vacuum, \(c \approx 3\times10^{10}\ \mathrm{cm/s}\)
- Solve for wavelength: \(\lambda = c/\nu \;\Rightarrow\; \lambda \propto \nu^{-1}\)
- Solve for frequency: \(\nu = c/\lambda \;\Rightarrow\; \nu \propto \lambda^{-1}\)
- Negative exponents are a compact way to show “inverse” relationships; you can also write \(\lambda \propto 1/\nu\) or \(\nu \propto 1/\lambda\)
Units check quickly: [cm/s] = [cm][1/s]. Micro-prompt: “If wavelength doubles, what happens to frequency?”
Part 1: The Electromagnetic Spectrum
What kind of “messenger” is light?
What Is Light?
Wave Picture
Light is an electromagnetic wave.
Three related quantities:
- wavelength \(\lambda\) (distance between crests)
- frequency \(\nu\) (cycles per second)
- speed \(c\) (in vacuum)
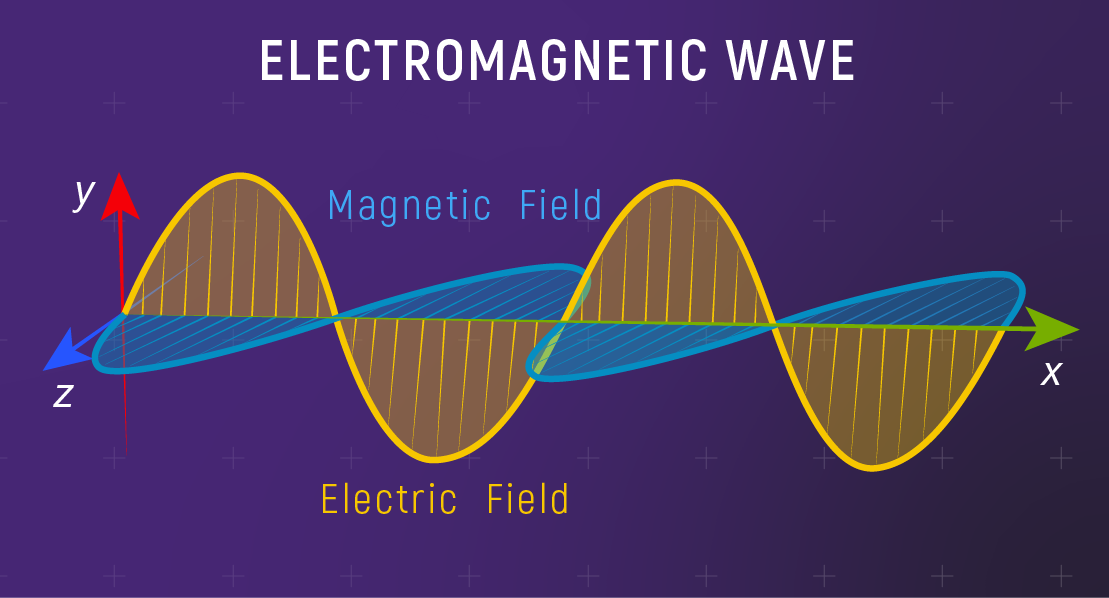
Keep it visual. Point out: E and B are perpendicular; propagation direction is perpendicular to both.
Mechanical Waves vs EM Waves
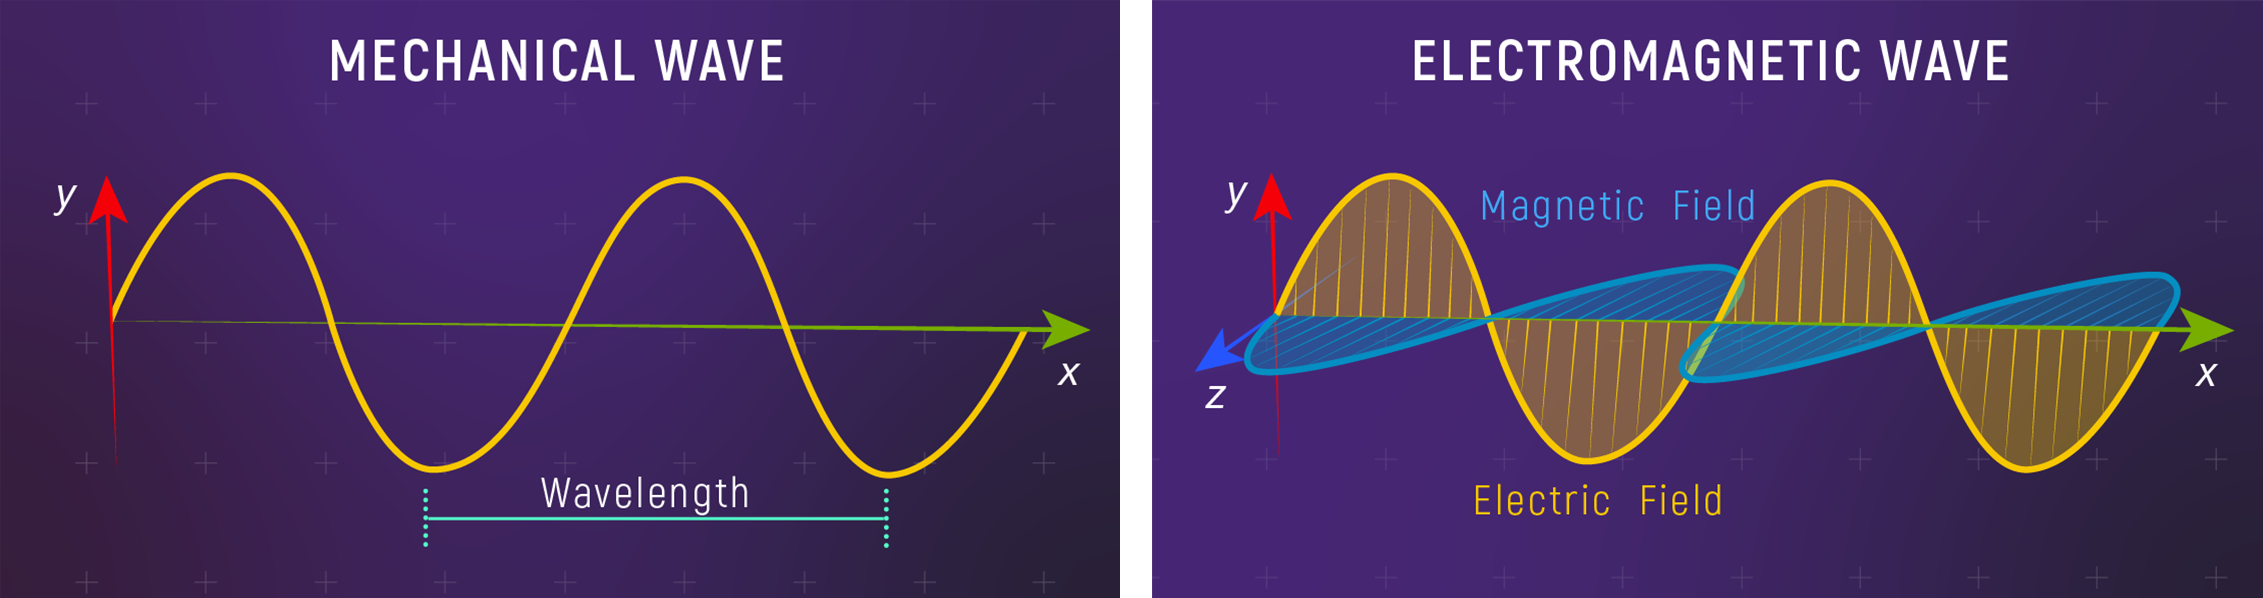
Mechanical waves need a medium.
EM waves don’t — that’s why light crosses the vacuum of space.
The Wave Relation
The symbol \(c\) is the speed of light in vacuum.
\[ c = \lambda \nu \tag{2}\]
- In vacuum, \(c \approx 3\times10^{10}\ \mathrm{cm/s}\)
- Solve for wavelength: \(\lambda = c/\nu \;\Rightarrow\; \lambda \propto \nu^{-1}\)
- Solve for frequency: \(\nu = c/\lambda \;\Rightarrow\; \nu \propto \lambda^{-1}\)
- Negative exponents are a compact way to show “inverse” relationships; you can also write \(\lambda \propto 1/\nu\) or \(\nu \propto 1/\lambda\)
Units check quickly: [cm/s] = [cm][1/s]. Micro-prompt: “If wavelength doubles, what happens to frequency?”
Units Sanity Check
Fast
If \(c = \lambda\nu\), then the units must satisfy:
\[[\mathrm{cm/s}] = [\mathrm{cm}]\,[\mathrm{s^{-1}}]\]
If the units don’t match, the physics can’t be right.
Tie back to Lecture 2: units are a “smoke detector.”
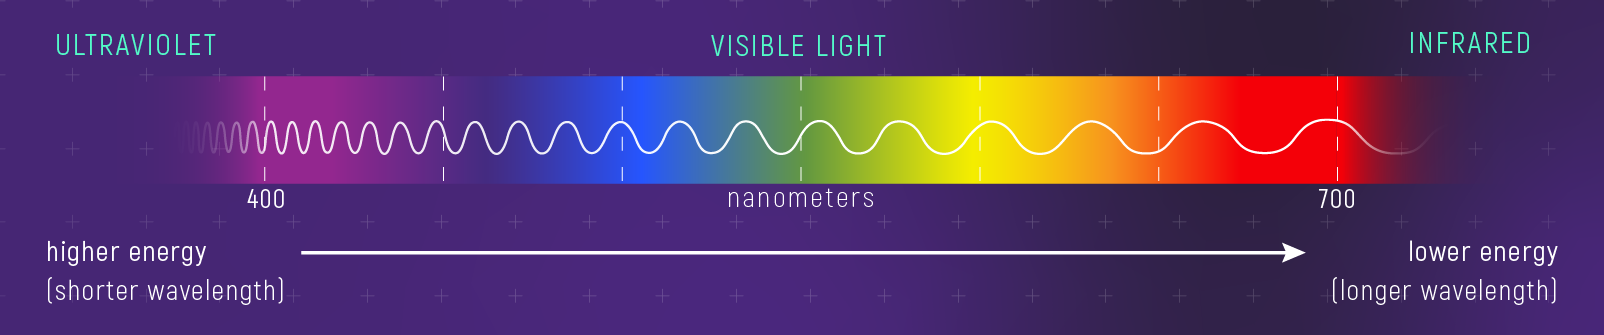
Wavelength Units
So We Speak the Same Language
Visible light is roughly:
- \(400\)–\(700\ \mathrm{nm}\)
Conversion: \(1\ \mathrm{nm}=10^{-7}\ \mathrm{cm}\).
Course convention: CGS (cm, s, erg, K).
Energy unit: \(1\ \mathrm{erg} = 1\ \mathrm{g\cdot cm^2/s^2}\).
Keep this fast. Students often get lost in unit switches; give them one anchor conversion.
🧠 Predict: No Calculator
If the wavelength doubles, the frequency…
Press C to reveal. Use it to reinforce inverse proportionality. Answer: halves.
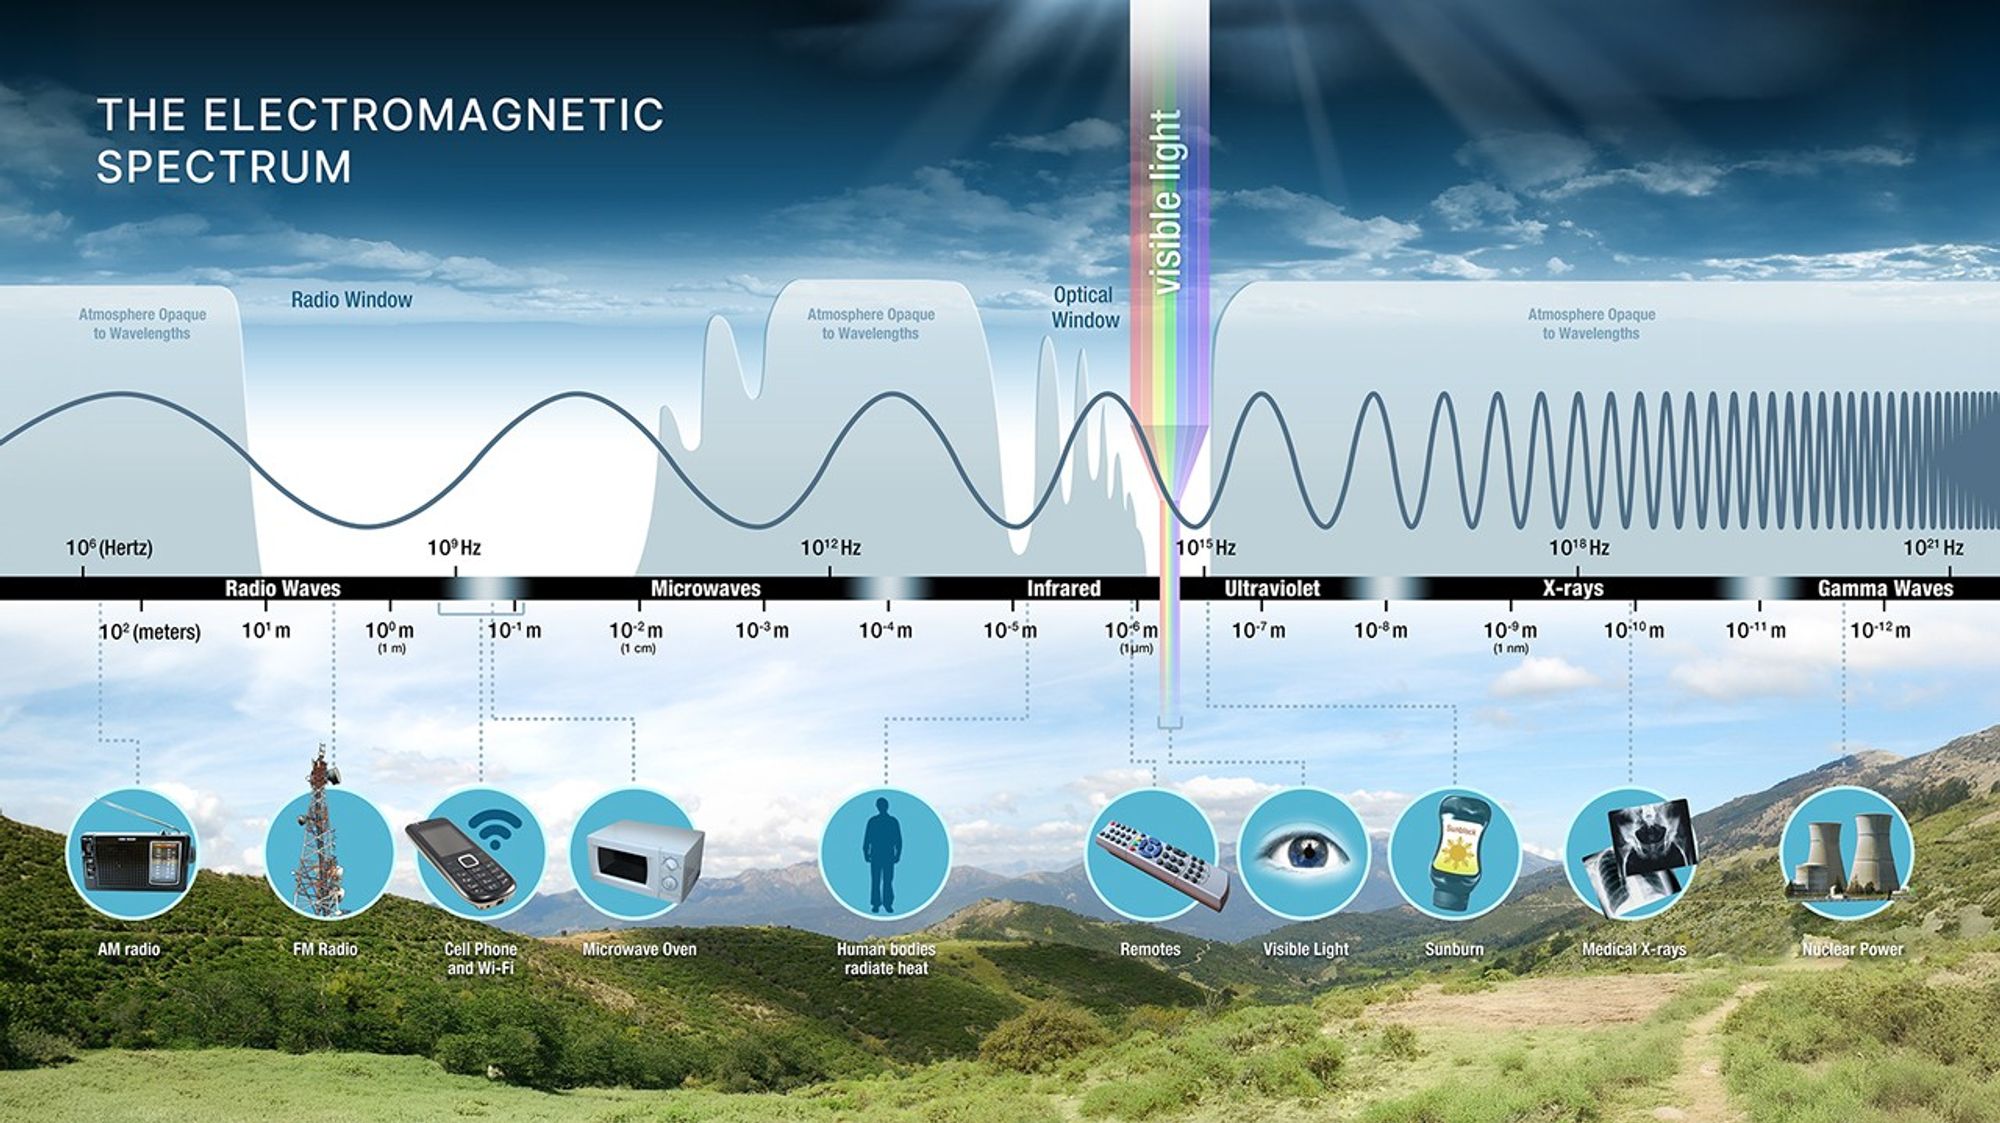
The Electromagnetic Spectrum
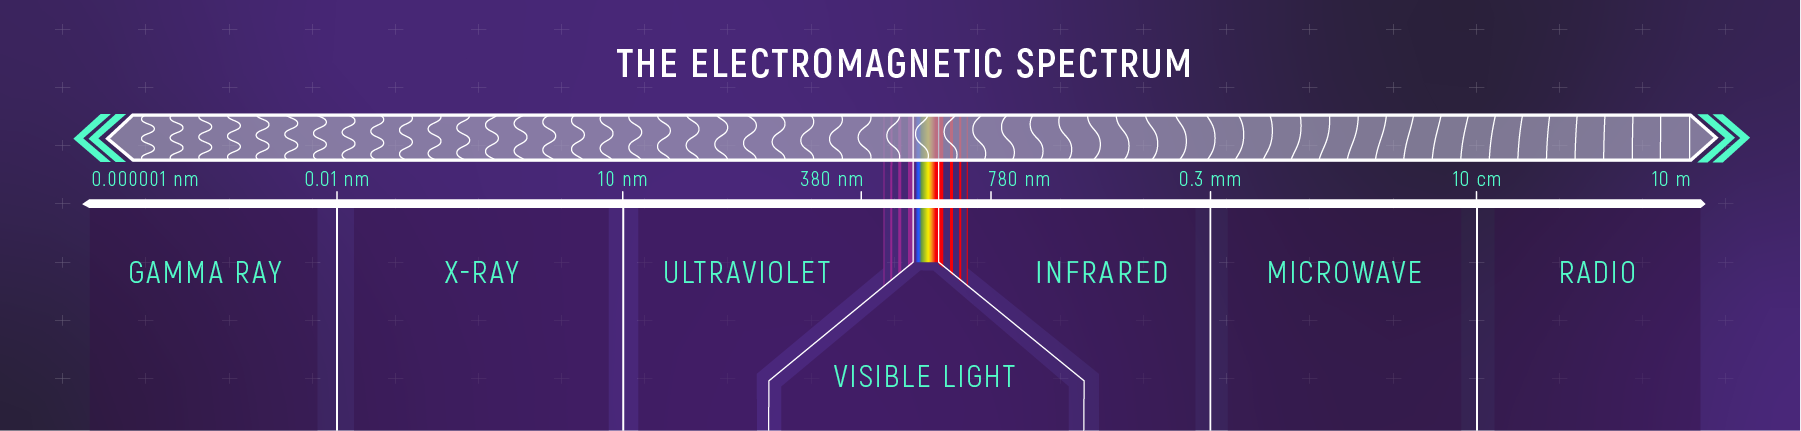
Visible light is a tiny slice.
Point out the visible zoom-in. Ask: “So if we only used visible, what would we miss?”
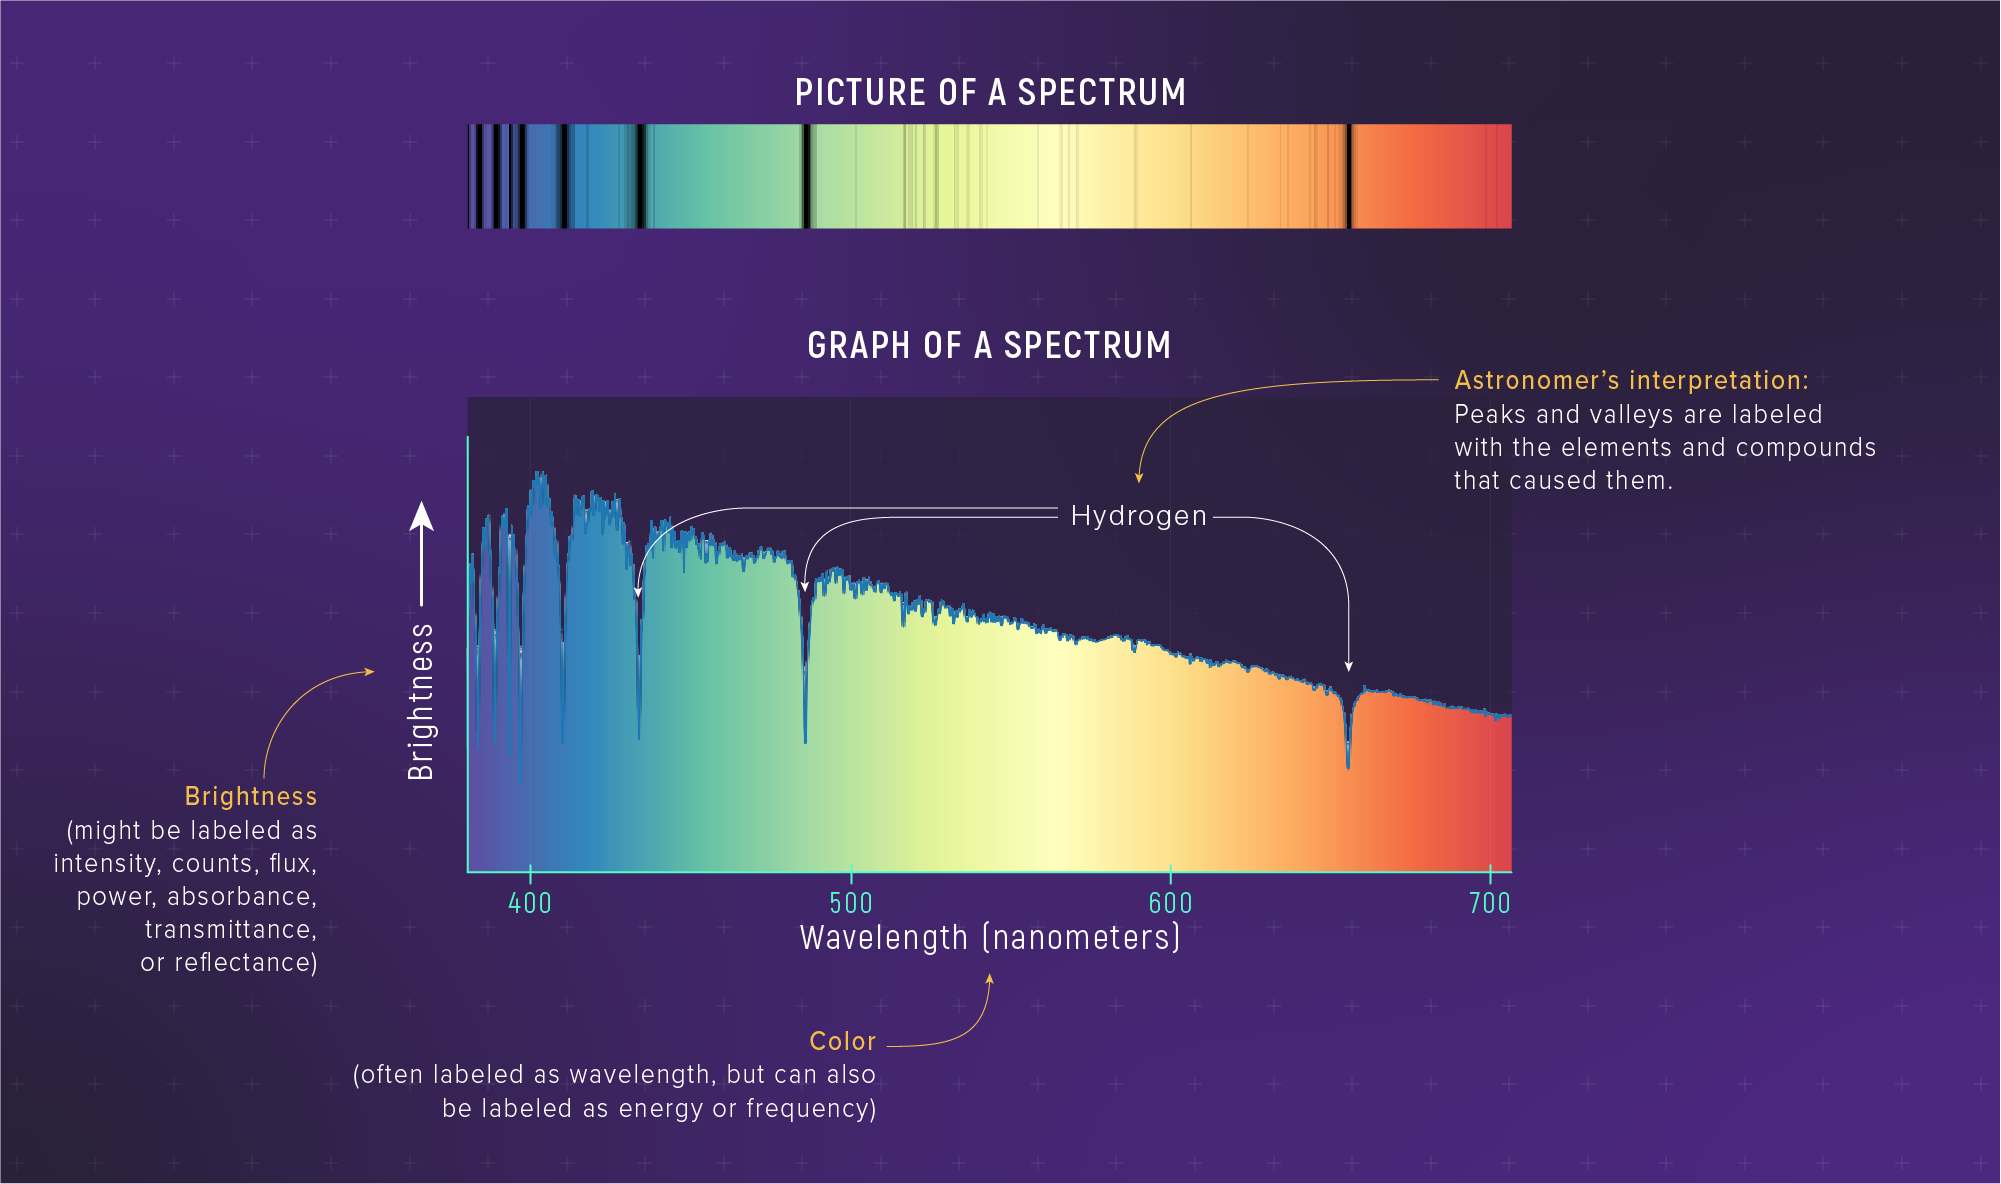
A Spectrum Is a Measurement
A spectrum is:
brightness as a function of wavelength
That’s more informative than a single “brightness number”.
Say the phrase “brightness vs wavelength” out loud. This is the object we’ll interpret all semester.
The Spectrum Reveals Different Physics
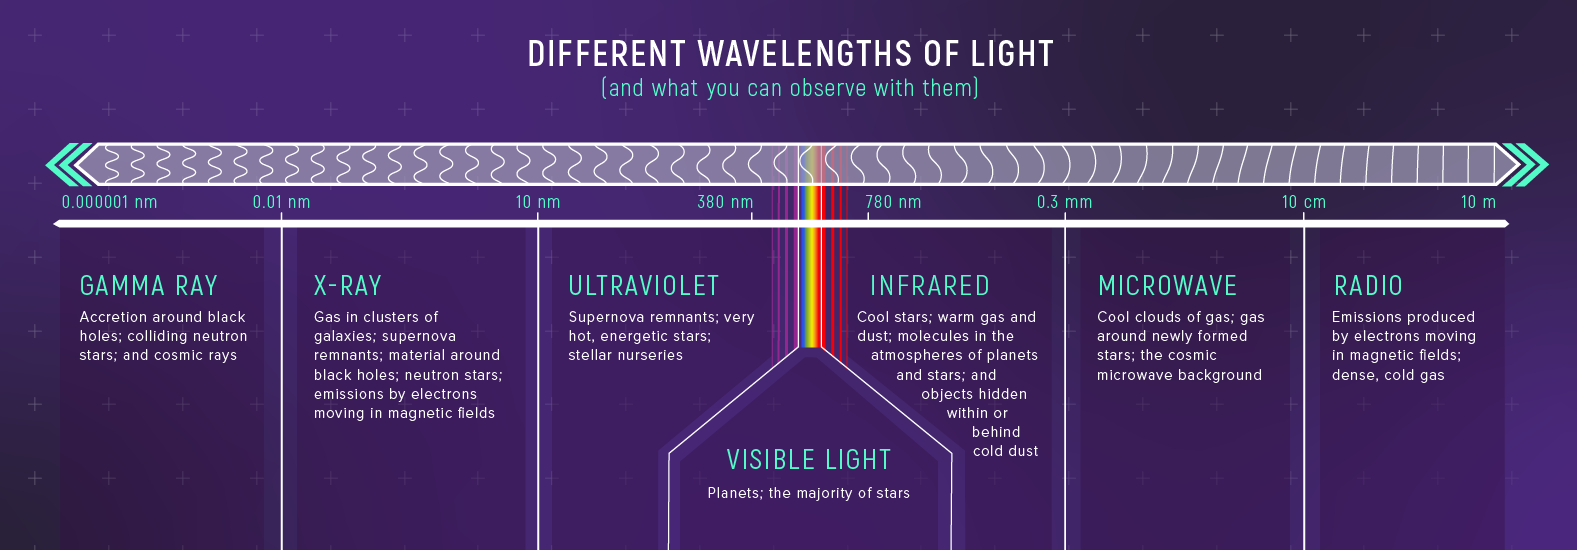
Call-and-response: “What does radio see?” “What does X-ray see?” Goal: internalize that wavelength choice is a physics choice.
Same Universe — Different Physics
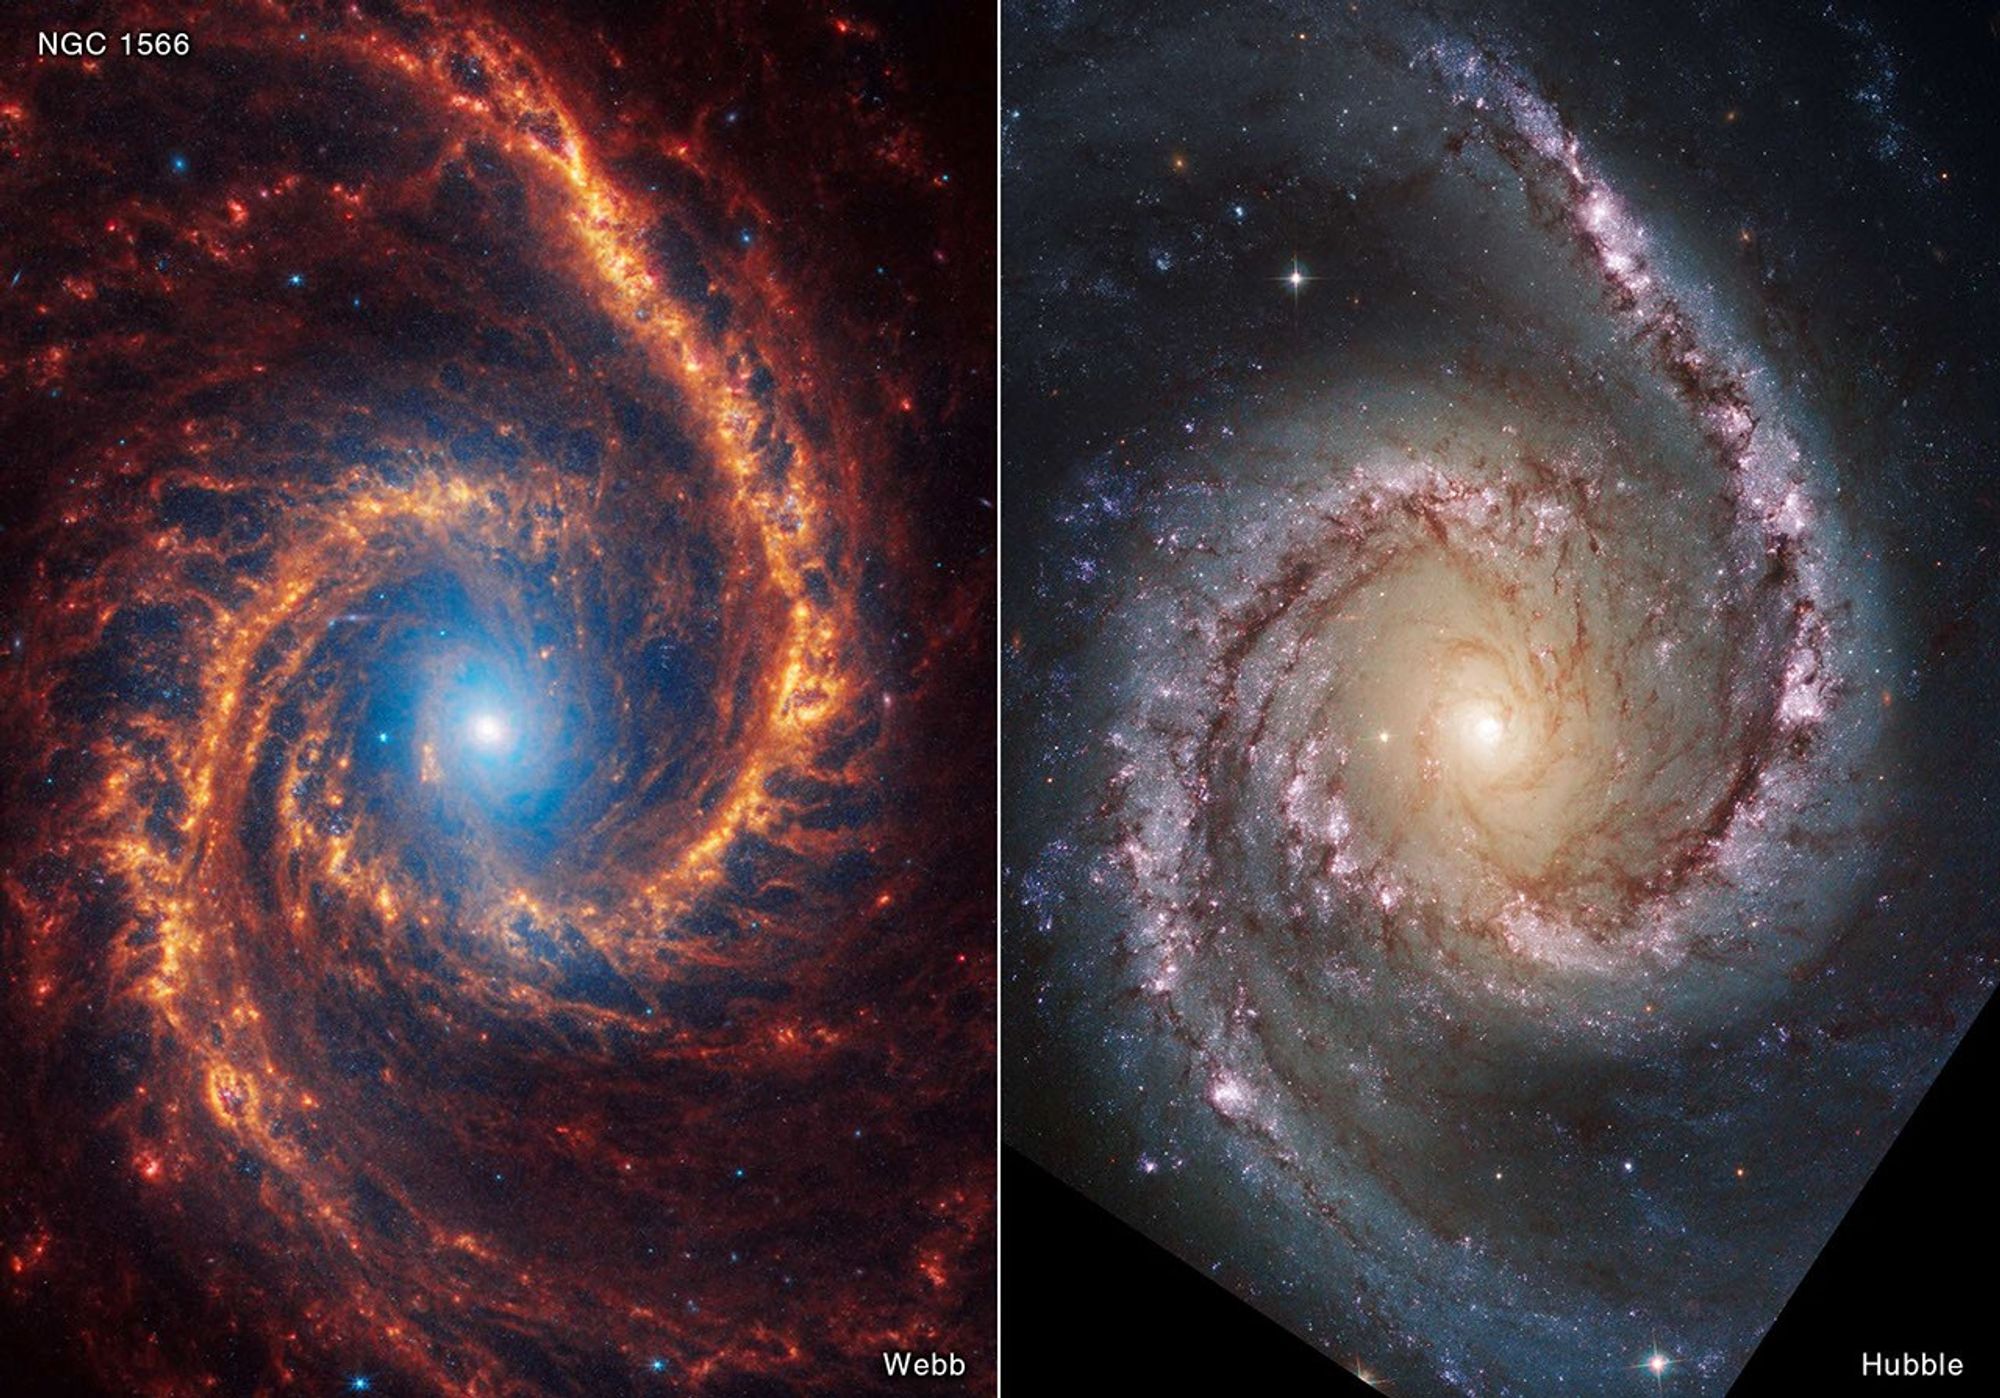
Different wavelengths highlight different components (stars, dust, gas).
Key line: the object didn’t change — the information channel did.
Part 2: Photons and Energy
Light is also made of particles.
Photon Energy
\[ E = h\nu = hc\lambda^{-1} \tag{3}\]
What this equation is saying:
- Direct: \(E \propto \nu\)
- Inverse: \(E \propto \lambda^{-1}\) (same as \(E \propto 1/\lambda\))
- shorter \(\lambda\) → larger \(E\)
- longer \(\lambda\) → smaller \(E\)
Here \(h\) is Planck’s constant (\(6.63\times10^{-27}\ \mathrm{erg\cdot s}\)).
Units check: (erg·s)·(s\(^{-1}\)) = erg.
Do not linger on constants. The point is scaling: \(E \propto \lambda^{-1}\).
Wave–Particle Duality
Optional but Helpful
Sometimes light behaves like a wave.
Sometimes it behaves like particles (photons).
Which model is useful depends on what you measure.
Keep this to ~60–90 seconds max. Goal: prevent “so the wave stuff was wrong?” No — different models, different experiments.
Spoiler Alert
For Later: Matter Waves
It’s not just light.
- particles also have wave behavior
- the “matter wavelength” gets shorter when momentum gets bigger
- \(p\) is momentum (in CGS: \(\mathrm{g\cdot cm/s}\))
- \(h\) is Planck’s constant (\(6.63\times10^{-27}\ \mathrm{erg\cdot s}\))
Teaser: \(\lambda = \frac{h}{p}\) (we’ll use this when we talk about stars in Module 2). This is a quantum-mechanics result linked to the Heisenberg uncertainty principle.
Do not explain quantum mechanics today. This is a trailer, not the movie.
🧠 Predict: Which Photon Is More Energetic?
Which photon has higher energy?
Quick reinforcement: shorter wavelength → higher energy. Answer: 400 nm (blue).
🧠 Predict: Scaling
If wavelength is cut in half, photon energy…
Answer: doubles.
Why Astronomers Care About Photon Energy
High-energy photons (UV/X-ray/gamma) can:
- ionize atoms
- heat million-degree plasma
- reveal extreme environments (accretion, explosions)
Low-energy photons (IR/radio) can:
- pass through dust
- trace cold gas and molecules
Keep qualitative. The takeaway is “different wavelengths → different interactions.”
Part 3: How Light Interacts with Matter
Light carries information because matter “filters” it.
Five Outcomes Plus Scattering
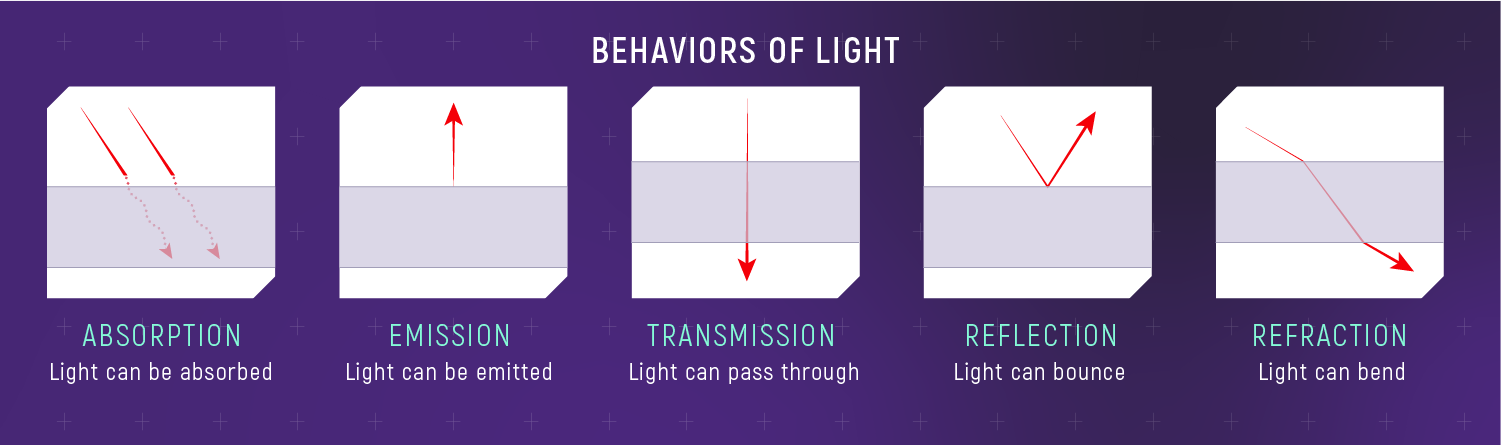
When light hits matter, it can be:
- transmitted
- absorbed
- emitted
- reflected / refracted
- scattered
Key move: these are not vocabulary words — they are “information pathways.”
Absorption and Emission
Tiny Preview
Absorption/emission are how light becomes a chemical fingerprint.
Next class: spectral lines tell us what a star is made of.
Keep this as a 20-second bridge so Day 2 feels inevitable.
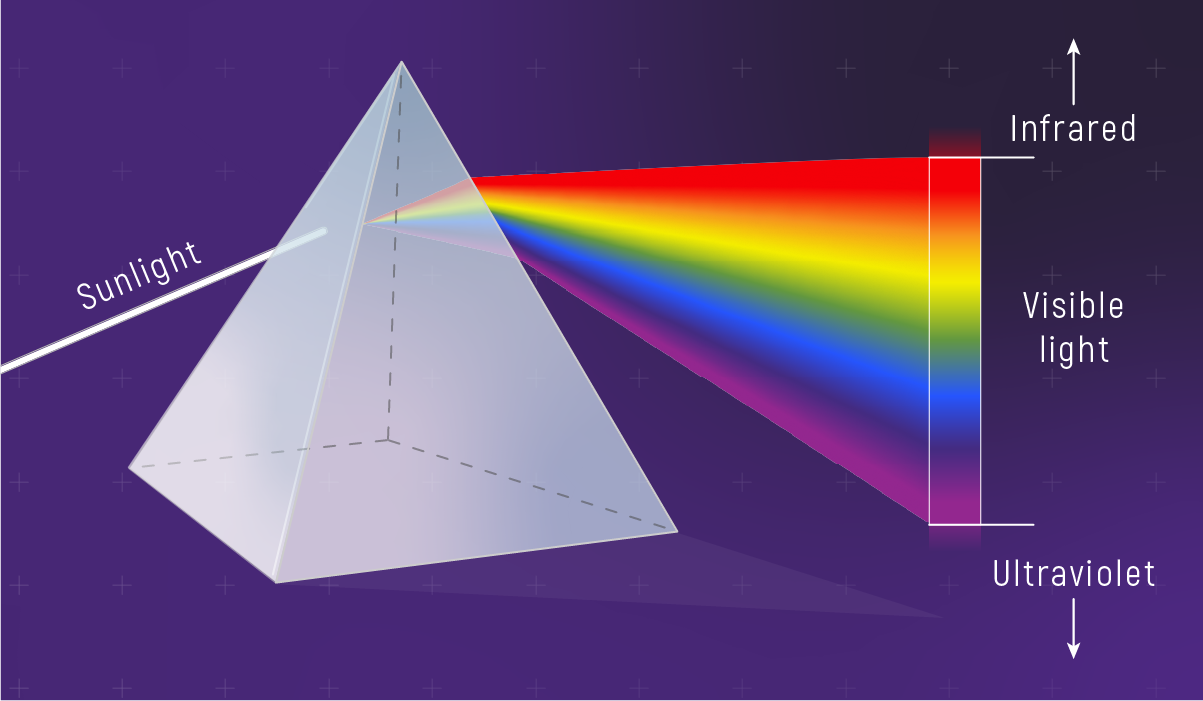
Refraction and Dispersion
Preview
In glass, different wavelengths bend by different amounts.
That’s why prisms “spread out” white light.
If you want a micro-prompt: “Which bends more in the figure — red or blue?”
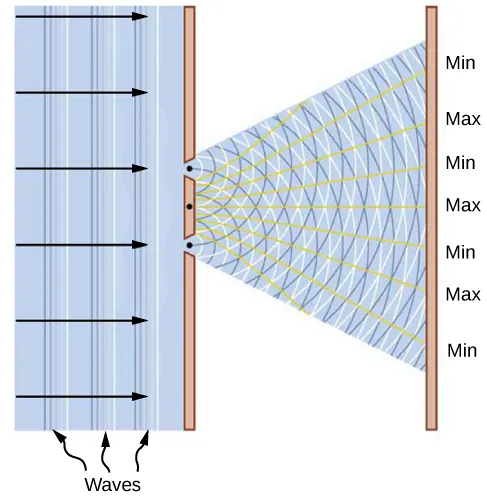
Scattering: Why the Sky Is Blue
For very small particles (like air molecules):
\[\text{scattering} \propto \lambda^{-4}\]
Shorter wavelength scatters much more.
Valid when particle size \(\ll \lambda\) (molecules).
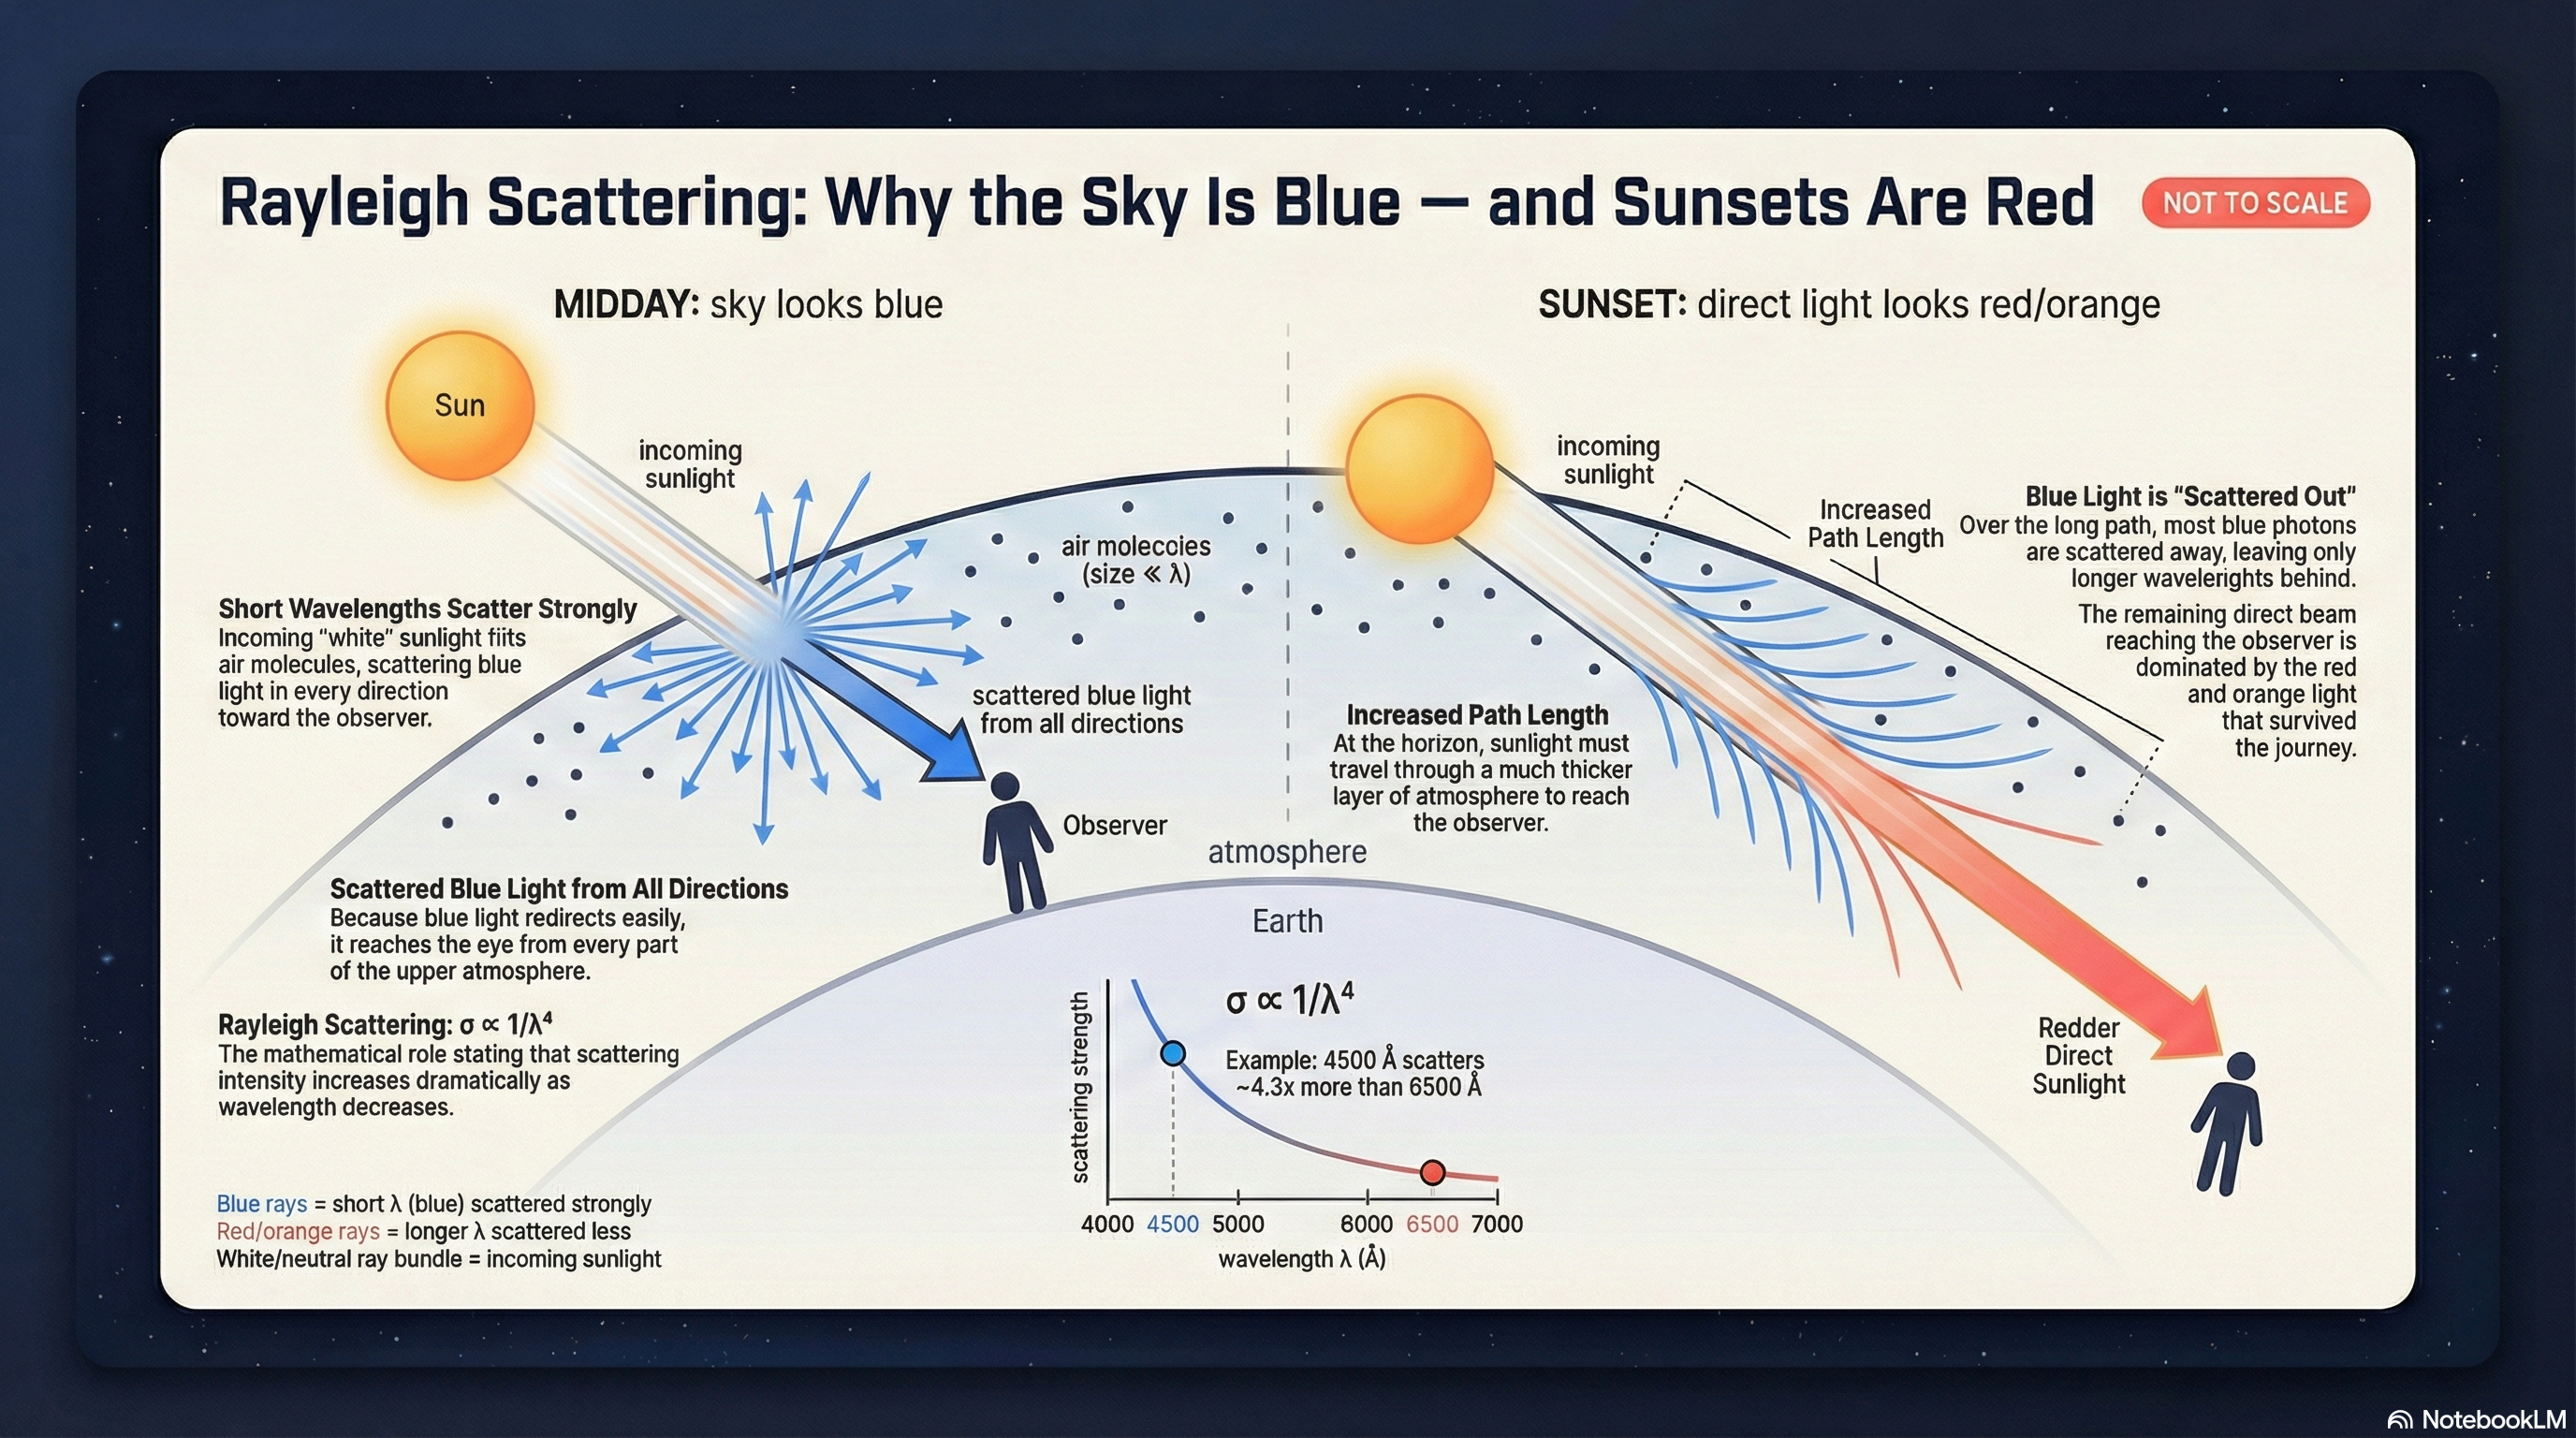
Don’t derive. Emphasize steep power: halve λ → 16× more scattering.
🧠 Predict: How Steep Is \(\lambda^{-4}\)?
If wavelength is cut in half, Rayleigh scattering becomes…
This is the “power-law intuition” skill: small wavelength changes can matter a lot. Answer: 16× stronger.
🧠 Predict: Rayleigh
On a planet with a similar atmosphere, which light scatters more?
Answer: Blue (shorter wavelength).
The Atmosphere Is a Filter
Earth’s atmosphere is not transparent everywhere.
- Optical window (good)
- Radio window (good)
- Some infrared gets through in atmospheric windows, but many bands are absorbed by molecules (H\(_2\)O, CO\(_2\), CH\(_4\), O\(_3\)).
- Most UV/X-ray/gamma blocked
This motivates space telescopes. Tie back to “observables are limited by physics and instruments.”
Opacity Preview: “How Far Light Gets”
Matter can be transparent or opaque depending on wavelength.
- dust blocks visible more than infrared
- Earth’s atmosphere blocks most UV/X-ray
Flag the word “opacity” as something we’ll use later, but don’t define optical depth yet.
Part 4: Thermal Radiation (Blackbodies)
Color encodes temperature.
The Blackbody Idea
A blackbody is an ideal thermal emitter:
- spectrum shape depends mainly on temperature
- hotter objects emit more light and peak at shorter wavelength
Two-part misconception target: (1) “Hotter → bluer” (2) “Hotter → brighter overall.”
Why “Black”body?
An ideal blackbody:
- absorbs all wavelengths well (“black”)
- therefore emits thermal radiation efficiently
One sentence: good absorber ↔︎ good emitter (Kirchhoff’s law, qualitative).
Why Stars Are Approximately Blackbodies
Stars have a dense “surface” (the photosphere) where:
- photons interact many times with matter
- the radiation field becomes close to thermal
But atmospheres add spectral lines — next class we explain why.
Students may feel: “but stars aren’t perfect blackbodies.” Correct — this is a useful starting model. Module 2 (stellar structure + opacity) will make the approximation feel natural.
Two Things Change When \(T\) Changes
When temperature increases:
- the peak shifts to shorter wavelength (Wien)
- the total emitted light increases (area under the curve)
Preview for later: Stefan–Boltzmann. Don’t drop the equation yet — keep it conceptual.
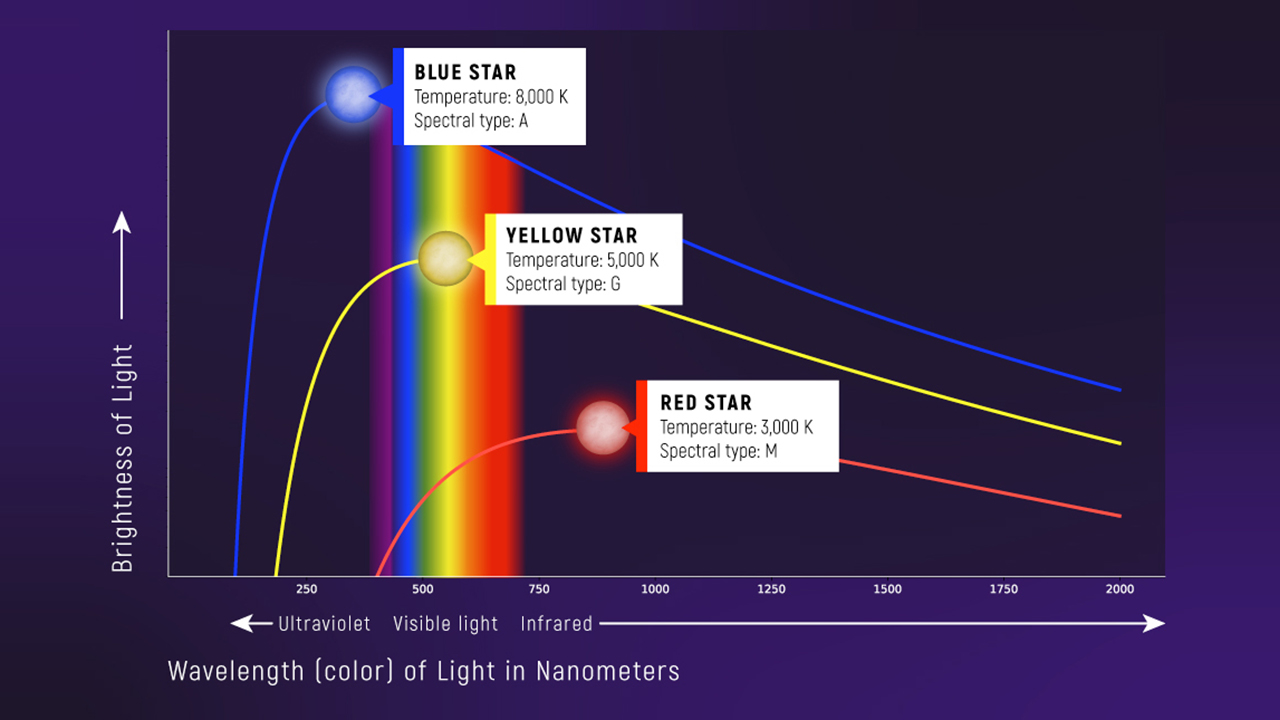
The Key Pattern
Look, Don’t Memorize
Hotter → peak shifts left (bluer) and the whole curve gets taller.
Wien’s Law
Inference Tool #1
The peak wavelength of a thermal spectrum tells temperature:
\[ \lambda_{\text{peak}} = b T^{-1} \tag{4}\]
Wien constant: \(b \approx 0.2898\ \mathrm{cm\cdot K}\)
- \(\lambda_{\mathrm{peak}}\) shorter → \(T\) higher
- \(\lambda_{\mathrm{peak}}\) longer → \(T\) lower
Emphasize: inverse relationship (\(T^{-1}\)).
Units Check
Wien’s Law
If \(\lambda_{\mathrm{peak}} = bT^{-1}\), then \(b\) must have units of:
\[[\text{length}]\cdot[\text{temperature}]\]
Quick “units as logic” reinforcement.
🧠 Predict: Scaling
If temperature doubles, the peak wavelength becomes…
Answer: half as large.
🧠 Predict: No Numbers
A star with a shorter peak wavelength is…
Answer: hotter.
Worked Example: The Sun
Fast
Take \(\lambda_{\mathrm{peak}} \approx 500\ \mathrm{nm} = 5\times10^{-5}\ \mathrm{cm}\).
. . .
Use \(b \approx 0.29\ \mathrm{cm\cdot K}\):
\[T \approx 0.29\cdot(5\times10^{-5})^{-1} \approx 5.8\times10^{3}\ \mathrm{K}\]
Round aggressively. This is “order-of-magnitude plus one digit”, not a precision measurement.
Stop & Solve: Compare Two Peaks
Star A peaks at \(500\ \mathrm{nm}\).
Star B peaks at \(1000\ \mathrm{nm}\).
. . .
How do their temperatures compare?
Give 30–45 s. Expect “inverse” reasoning.
Stop & Solve — Solution
Because \(\lambda_{\mathrm{peak}} \propto T^{-1}\):
\[\frac{T_B}{T_A} = \frac{\lambda_A}{\lambda_B} = \frac{500\ \mathrm{nm}}{1000\ \mathrm{nm}} = \frac{1}{2}\]
Units cancel in the ratio, so the temperature ratio is dimensionless.
Star B is half the temperature of Star A.
Worked Example: A Cool Star
Fast
Suppose \(T \approx 3500\ \mathrm{K}\) (a cool red supergiant).
\[\lambda_{\mathrm{peak}} \approx 0.29\cdot(3500)^{-1}\ \mathrm{cm}\approx 8.3\times10^{-5}\ \mathrm{cm}\approx 830\ \mathrm{nm}\]
That’s just beyond visible red → near infrared.
This is intentionally “fast math.” The point is: cooler objects peak in IR, not that students memorize Betelgeuse.
“Big Star” Context
Optional Wow
Betelgeuse is an example.
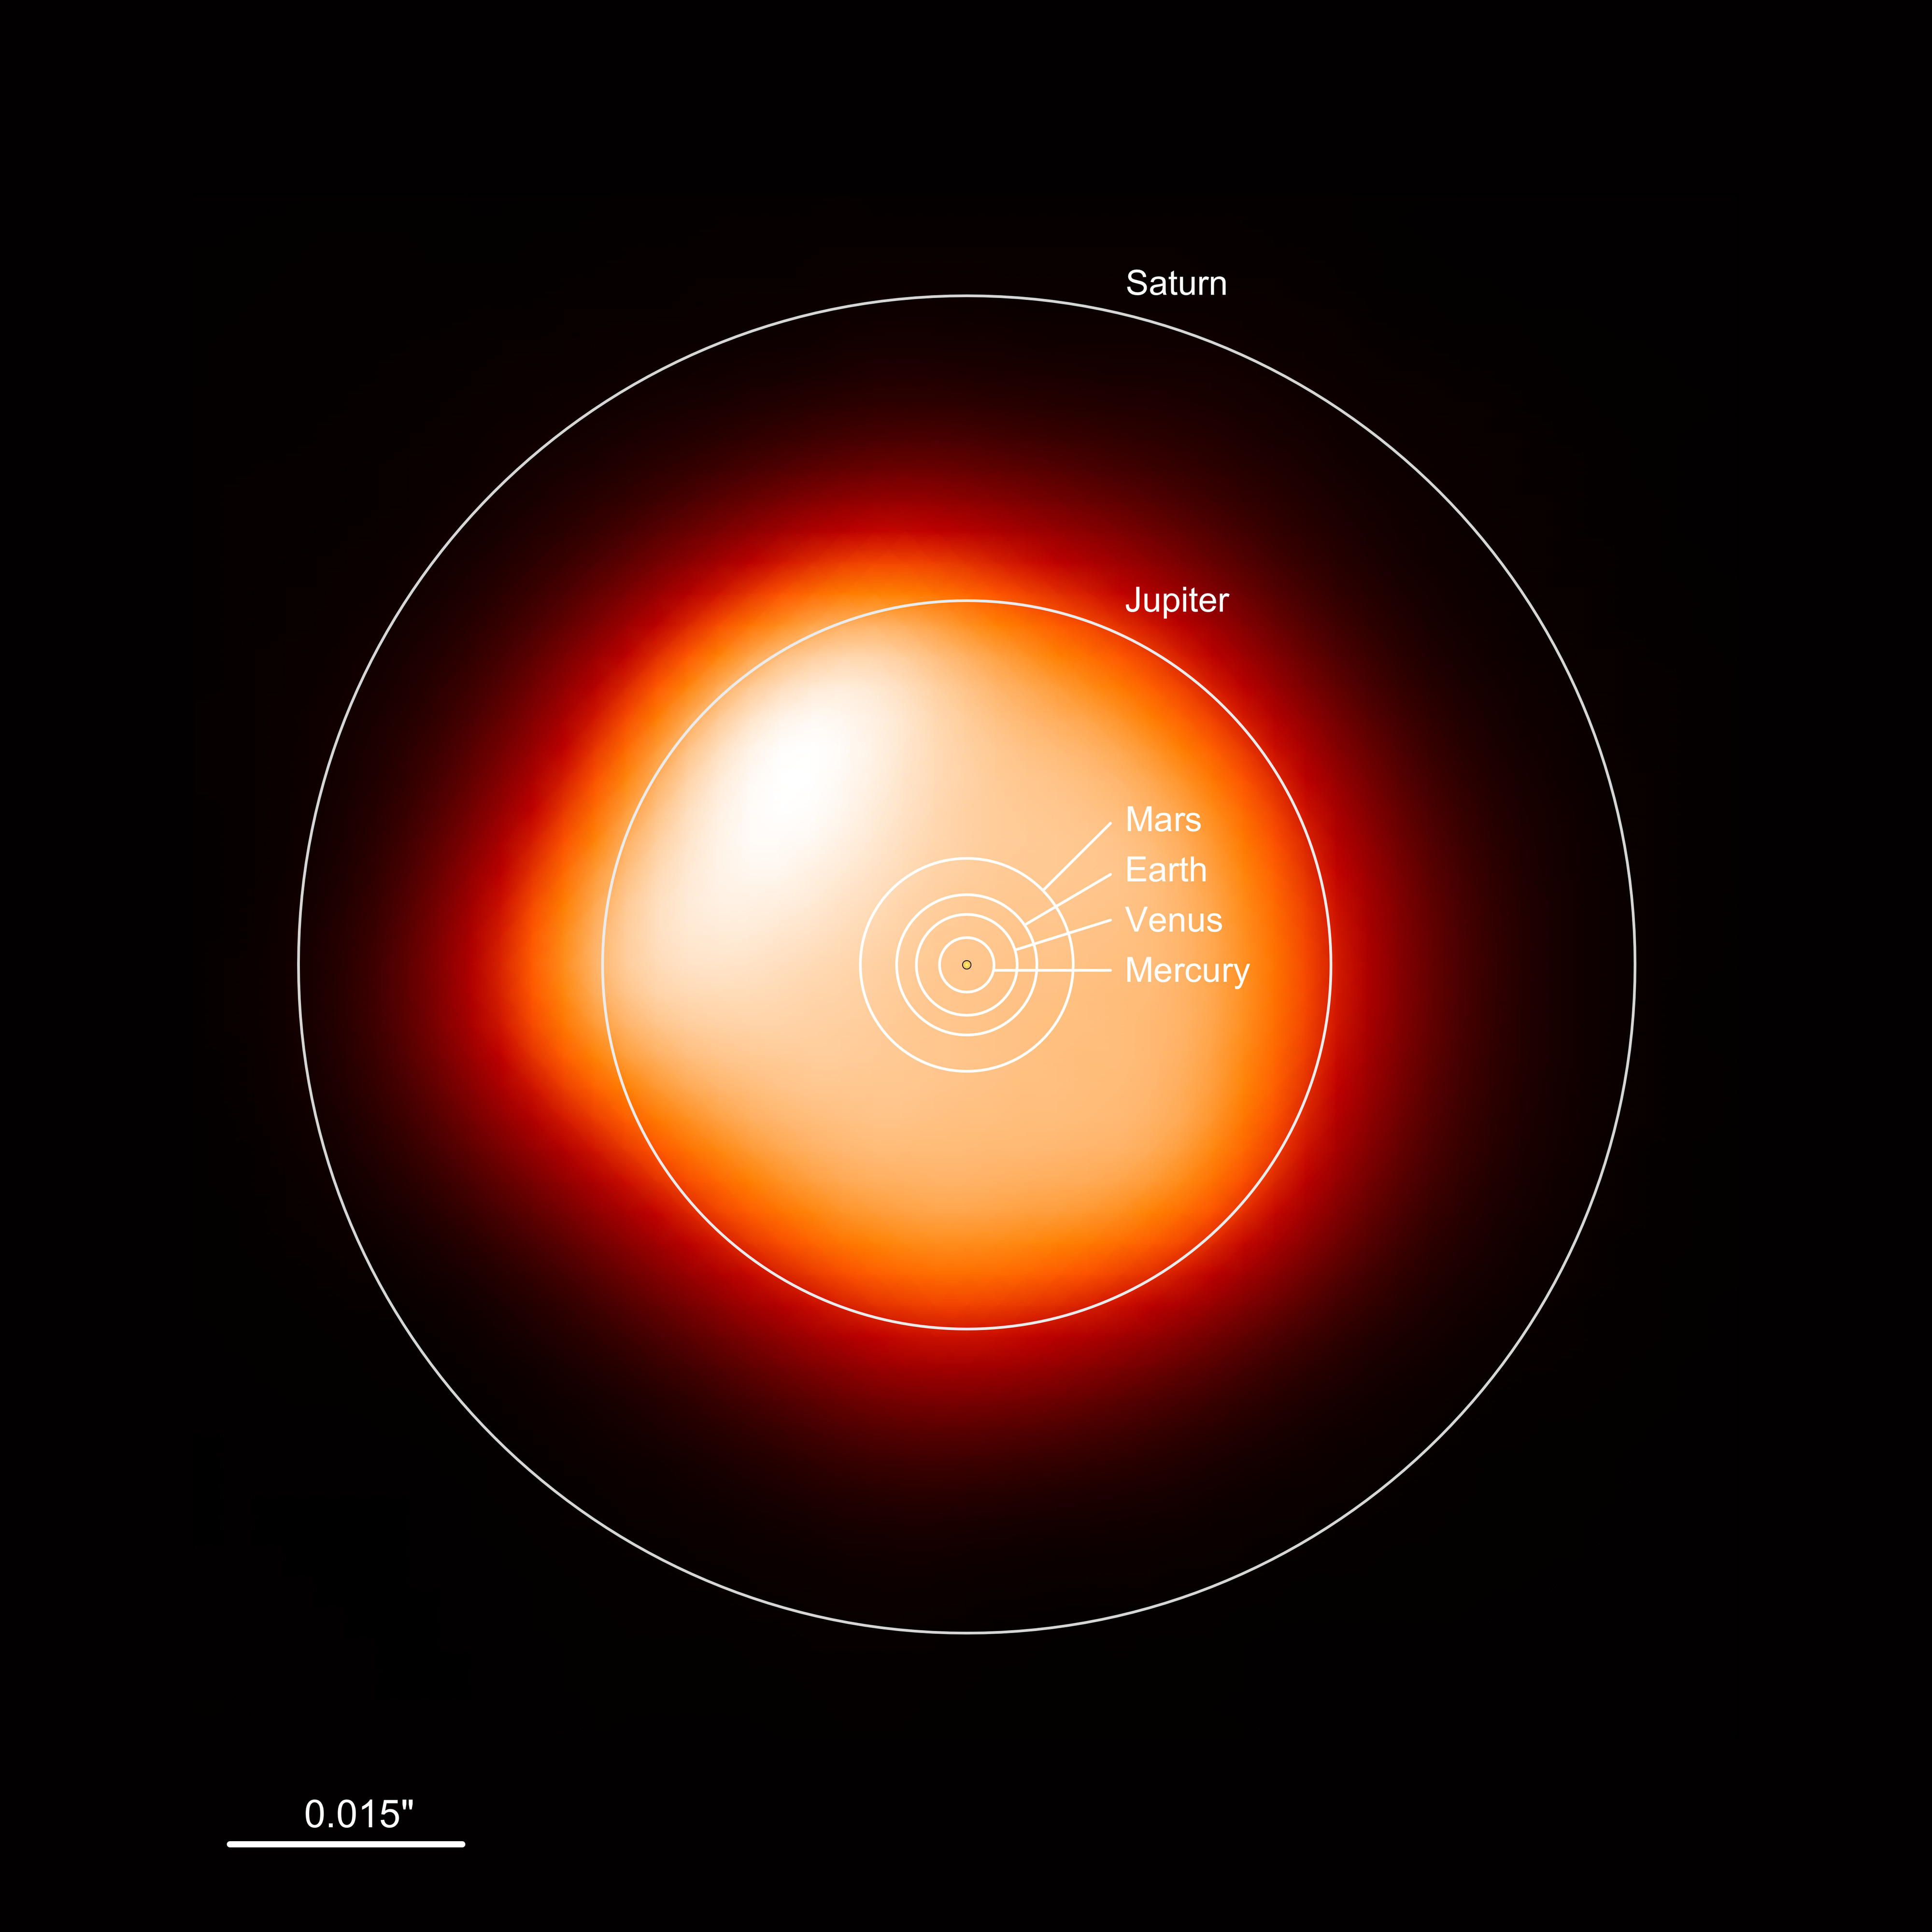
One-sentence tie-in: cool objects can still be luminous if they have huge surface area (preview: Stefan–Boltzmann + radius).
A Common Misconception
“If a star peaks in the UV, it emits only UV.”
. . .
No — a hot blackbody emits across many wavelengths.
Misconception alert: Students often think “peak wavelength” = “only wavelength emitted.” Use the blackbody figure: hot curve is above cool curve even in the red. Emphasize the breadth of the Planck curve — color is about the ratio of blue to red light, not just where the peak sits.
Next Class
Day 2: Continuum + Lines
Blackbody is the starting model.
Next class we add:
- absorption lines → composition
- (later) Doppler shifts → motion
Synthesis
Day 1
Today we built the chain:
- Measure: spectrum (intensity vs wavelength)
- Model: blackbody thermal emission
- Infer: temperature (via Wien’s law)
Next class: the fine structure (spectral lines) → composition.
Demo Time
If Time: EM Spectrum
Demo: em-spectrum
Prompt: Where is “visible” on a log scale? What changes fastest: \(\lambda\), \(\nu\), or \(E\)?
Local path (instructor): /Users/anna/Teaching/astr101-sp26/demos/em-spectrum/ Suggested flow (3–5 min): 1) Start at visible (550 nm), then jump to radio and gamma. 2) Ask: “How many orders of magnitude did we move?” 3) Reinforce: longer λ → lower ν → lower E. If short on time: skip and remind students demos are posted.
Demo Time
If Time: Blackbody Radiation
Demo: blackbody-radiation
Prompt: As \(T\) increases, what happens to (1) peak wavelength and (2) total emitted light?
Local path (instructor): /Users/anna/Teaching/astr101-sp26/demos/blackbody-radiation/ Suggested flow (3–6 min): 1) Start at 3000 K vs 8000 K (comparison mode if available). 2) Ask for two predictions before moving the slider: “which way does the peak move?” “what happens to area under the curve?” 3) Tie back to Wien (peak) and preview Stefan–Boltzmann (area). If short on time: do 60 seconds — just show the peak shifting.
Exit Ticket
30 seconds
Write one sentence:
“A spectrum is useful because…”
Collect 2–3 aloud. Listen for “we can infer temperature/composition from wavelength-dependent behavior.”
Study Snapshot
Write This Down
- \(c=\lambda\nu\) (wave relation)
- \(E=hc\lambda^{-1}\) (shorter \(\lambda\) → higher energy)
- \(\lambda_{\rm peak}=bT^{-1}\) (shorter peak → hotter)
- \(E \propto \nu\) and \(E \propto \lambda^{-1}\)
- \(\lambda_{\rm peak} \propto T^{-1}\)
This is the “exam-memory” slide. Keep students focused on interpretations.