Module in brief
Discovering the HR Diagram
From starlight to the map of stellar physics.
What a star's light reveals about it. From distance and parallax through surface flux, color, spectra, and stellar masses, this module builds the observational toolkit that turns brightness and color into temperature, luminosity, and radius — and assembles them into the Hertzsprung-Russell diagram.
Module Overview
Build the linked inference chain from parallax and starlight to the physical properties of stars.
Lessons
Distance & Parallax
Measuring distance is the fundamental problem in astronomy. Parallax gives a geometric baseline ruler, and the inverse-square law turns measured flux into intrinsic luminosity. Opens Module 2 (the HR diagram) and is organized around the Observable→Model→Inference framework.
Surface Flux & Colors of Stars
Given a star's luminosity and color, infer its temperature and physical size. Wien's law turns color into temperature; the Stefan-Boltzmann law connects luminosity, temperature, and radius — so any two determine the third. (Non-OMI: a visual + scaling chapter; the two MultiRep bindings carry the cross-representation work.)
Spectra & Composition
Every element has a unique spectral fingerprint. Spreading starlight into a spectrum and reading its absorption lines yields three independent inferences from one observation — composition (which lines), temperature/spectral type (line-strength pattern, via the Boltzmann distribution), and radial velocity (Doppler shifts). The same Kirchhoff physics that decodes starlight also explains planetary equilibrium temperature and the greenhouse effect.
Weighing Stars
Mass controls a star's luminosity, temperature, lifetime, and death — but it leaves no direct imprint on light. Binary star orbits are the only direct way to weigh a star: Newton's form of Kepler's third law plus the center-of-mass condition turn orbital period and Doppler velocities into individual masses. The resulting mass-luminosity relation (L proportional to M^3.5) makes mass the master variable, completing the Module 2 inference chain.
The HR Diagram
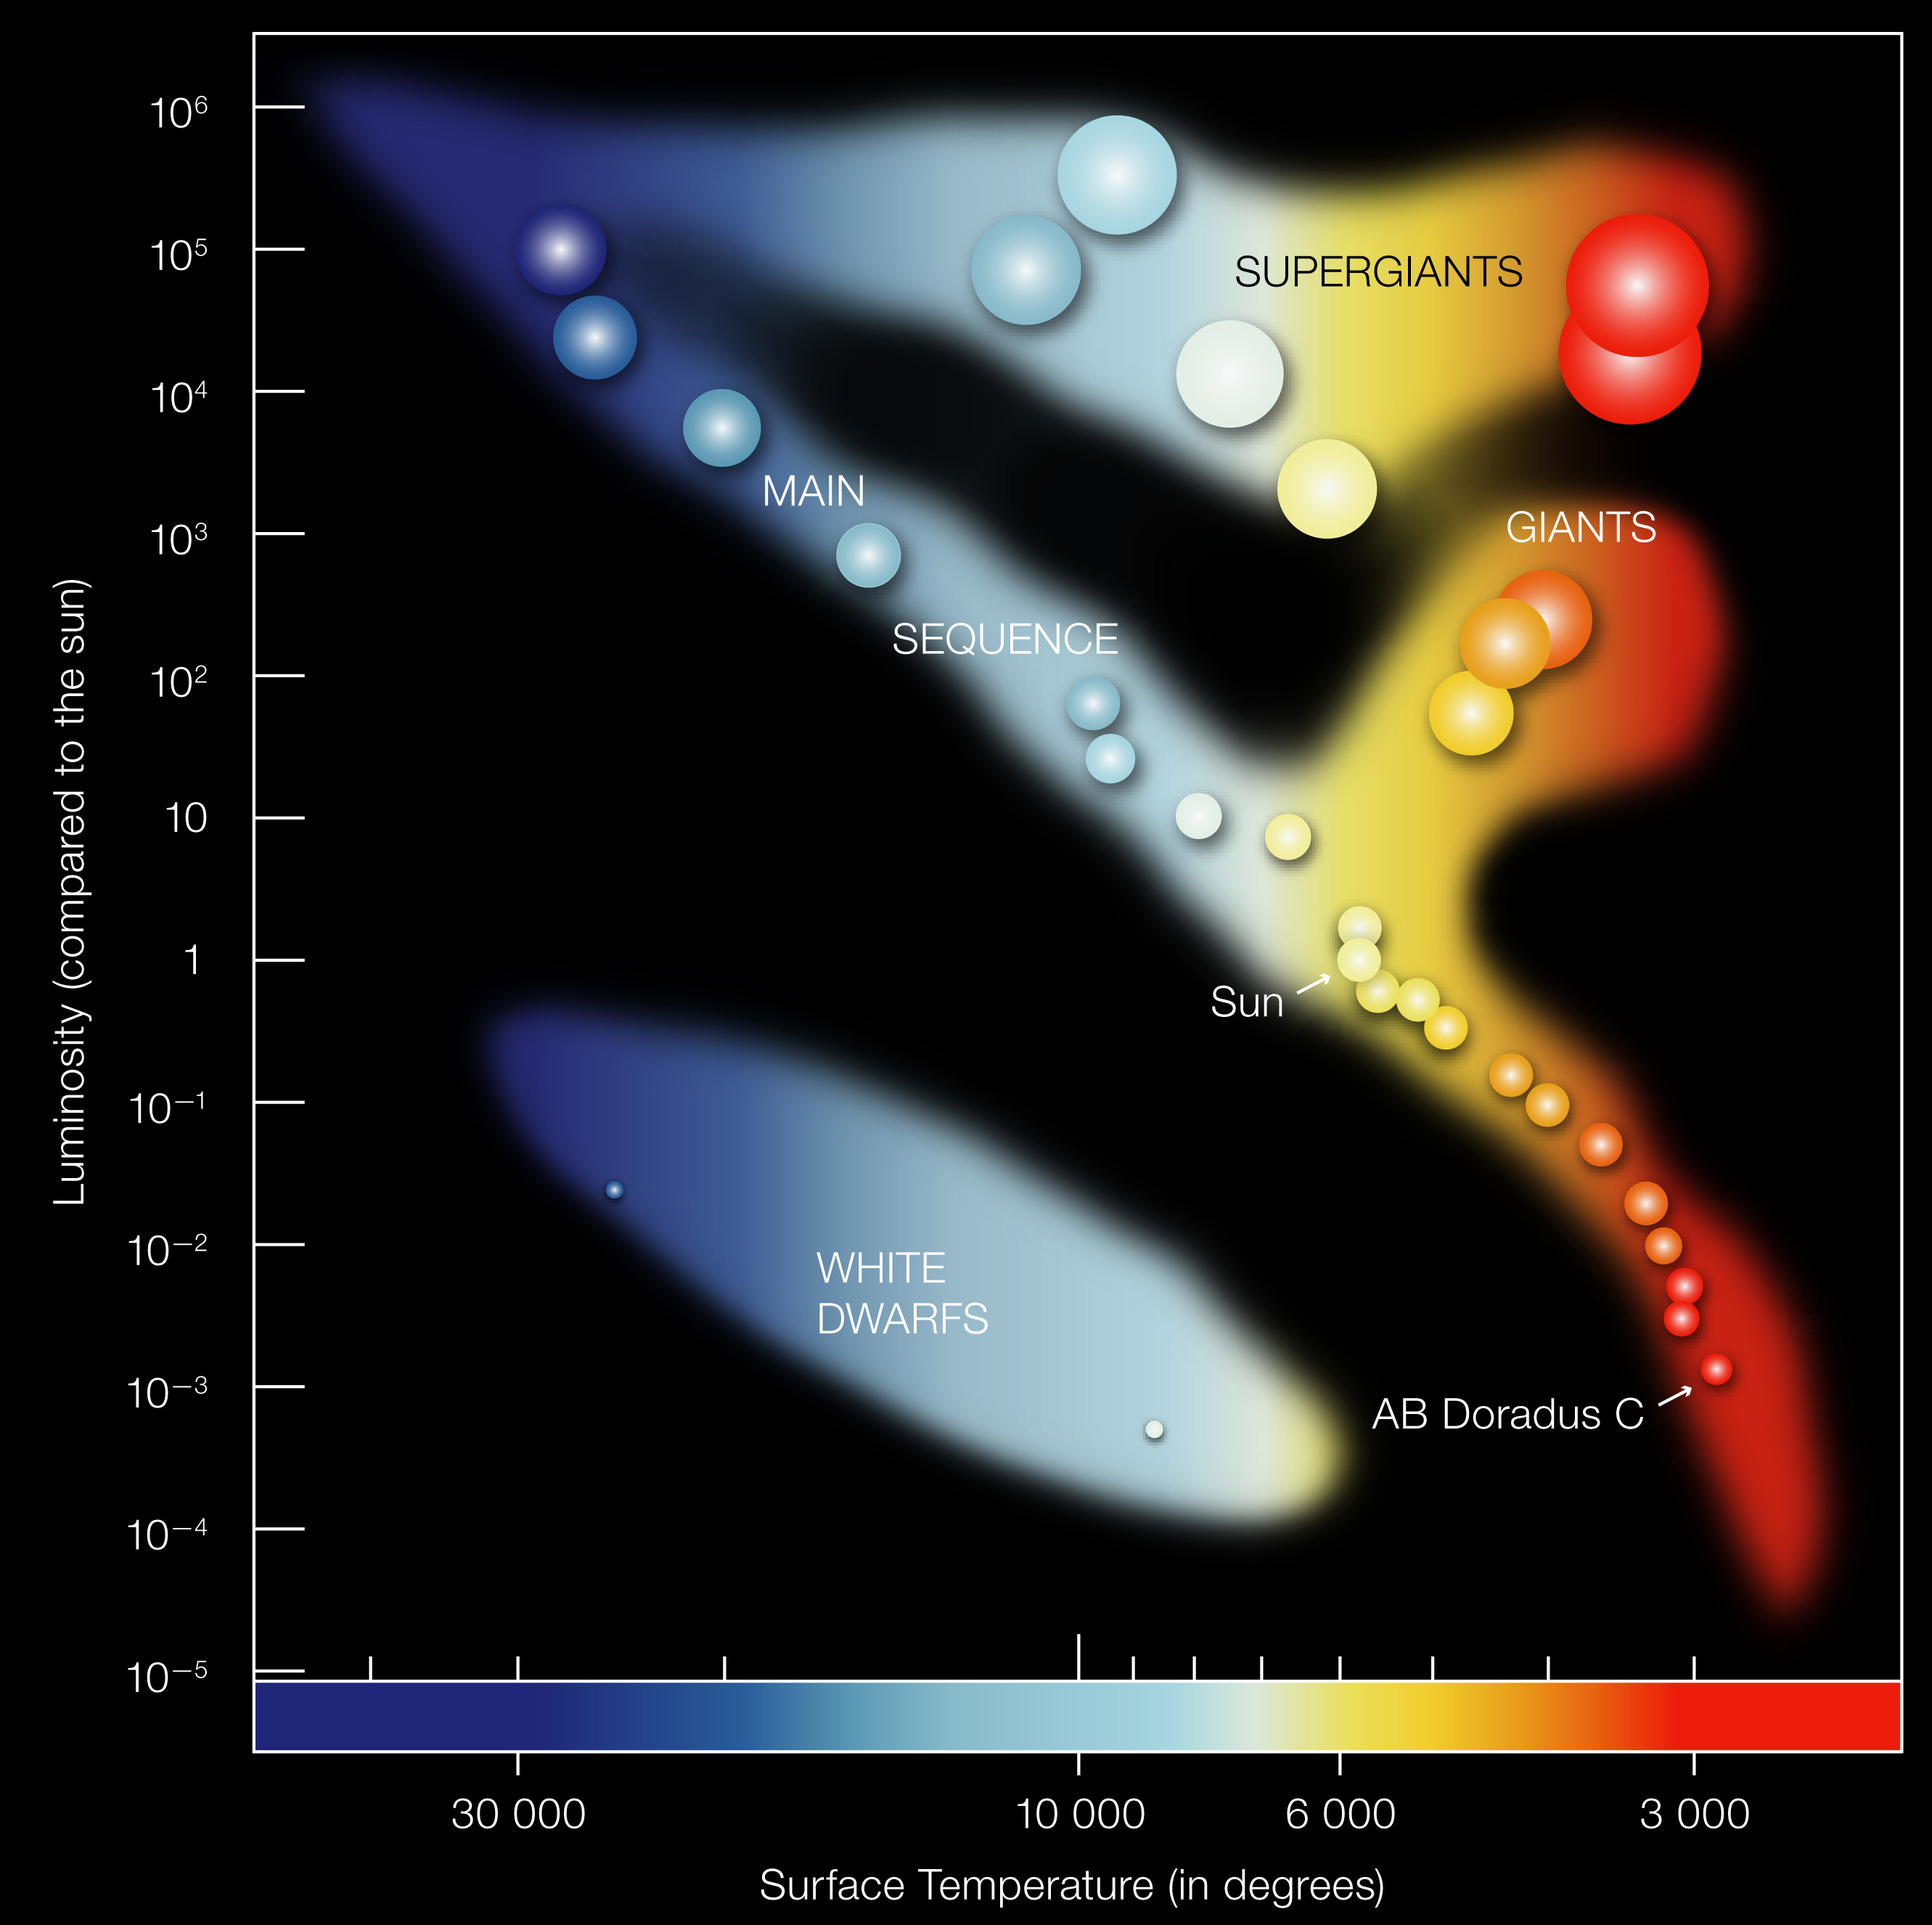
The Hertzsprung-Russell diagram is the most important single diagram in astrophysics. The magnitude system and distance modulus turn observed brightness into absolute magnitude; plotting it against spectral type reveals the main sequence, giant branch, and white dwarf sequence. The Stefan-Boltzmann law overlays lines of constant radius, and mass — absent from both axes — turns out to organize the whole pattern. The HR diagram is an evolution diagram, and the questions it raises launch Module 3.
Module Synthesis
Assemble distance, luminosity, temperature, radius, composition, and mass into the HR diagram and read the questions it exposes.