Part 4: Random Sampling - From Theory to Computation
How Nature Computes | Statistical Thinking Module 1 | COMP 521
Learning Outcomes
By the end of Part 4, you will be able to:
Implement the inverse transform method to sample from analytical distributions including exponentials and power laws
Apply the Cumulative Distribution Function (CDF) concept to transform uniform random numbers into any desired distribution
Sample from complex astrophysical distributions like the Kroupa IMF using piecewise techniques
Design rejection sampling algorithms for distributions without analytical inverse transforms
Generate realistic initial conditions for N-body simulations including mass, position, and velocity distributions
4.1 Why Random Sampling Matters
Priority: 🔴 Essential
Sampling is how we generate distributions; moments are how we audit them. Theory tells us distributions exist. But for simulations, we need to generate samples. The challenge: computers only produce uniform random numbers [0,1]. How do we transform these into complex astrophysical distributions? Sampling feels like randomness; precisely, it is measure-preserving transforms from uniform draws. Catchphrase -> Precision: “Random draws solve deterministic problems” means unbiased estimators converge with standard error under the right assumptions.
This is where theory meets computation. Random sampling bridges the gap between:
Statistical understanding (Parts 1-2)
Computational modeling (your projects)
🌟 The More You Know: From Solitaire to Nuclear Weapons - The Monte Carlo Origin Story
In 1946, mathematician Stanislaw Ulam was recovering from brain surgery at Los Angeles’ Cedars of Lebanon Hospital. To pass the time during his convalescence, he played endless games of Canfield solitaire. Being a mathematician, he naturally wondered: what’s the probability of winning?
He tried to calculate it using combinatorial analysis, but the problem was intractable – too many possible card arrangements and decision trees. Then came the insight that would revolutionize computational physics: instead of trying to solve it analytically, why not just play thousands of games and count the wins?
Back at Los Alamos, Ulam shared this idea with his colleague John von Neumann. They were working on nuclear weapon design, specifically trying to understand neutron diffusion — how neutrons travel through fissile material, sometimes causing more fissions, sometimes escaping. The equations were impossibly complex, but Ulam’s solitaire insight applied perfectly: instead of solving the equations, simulate thousands of random neutron paths and count the outcomes!
They needed a code name for this classified work. Nicholas Metropolis suggested “Monte Carlo” after the famous casino in Monaco, inspired by an uncle who would borrow money from relatives to gamble there. The name was perfect – this method was essentially gambling with mathematics, rolling dice millions of times to get statistical answers.
The first Monte Carlo calculations were performed on ENIAC in 1948. It took the early computer weeks to run simulations that your laptop could do in seconds. But it worked, providing crucial insights for the hydrogen bomb design.
The irony is beautiful: a method developed for the most destructive weapon ever created now helps us understand everything from protein folding to galaxy formation. Your Project 3 radiative transfer code uses the same fundamental technique that emerged from Ulam’s hospital bed solitaire games. When you launch random photon packets through your simulated atmosphere, you’re using the intellectual descendant of those first neutron transport calculations.
Today, Monte Carlo methods are everywhere:
Wall Street uses them for options pricing
Drug companies use them for clinical trial design
Climate scientists use them for weather prediction
Netflix uses them for recommendation algorithms
All because a mathematician recovering from brain surgery asked a simple question about solitaire. Sometimes the most powerful ideas come not from solving equations, but from admitting they’re too hard and finding a cleverer way.
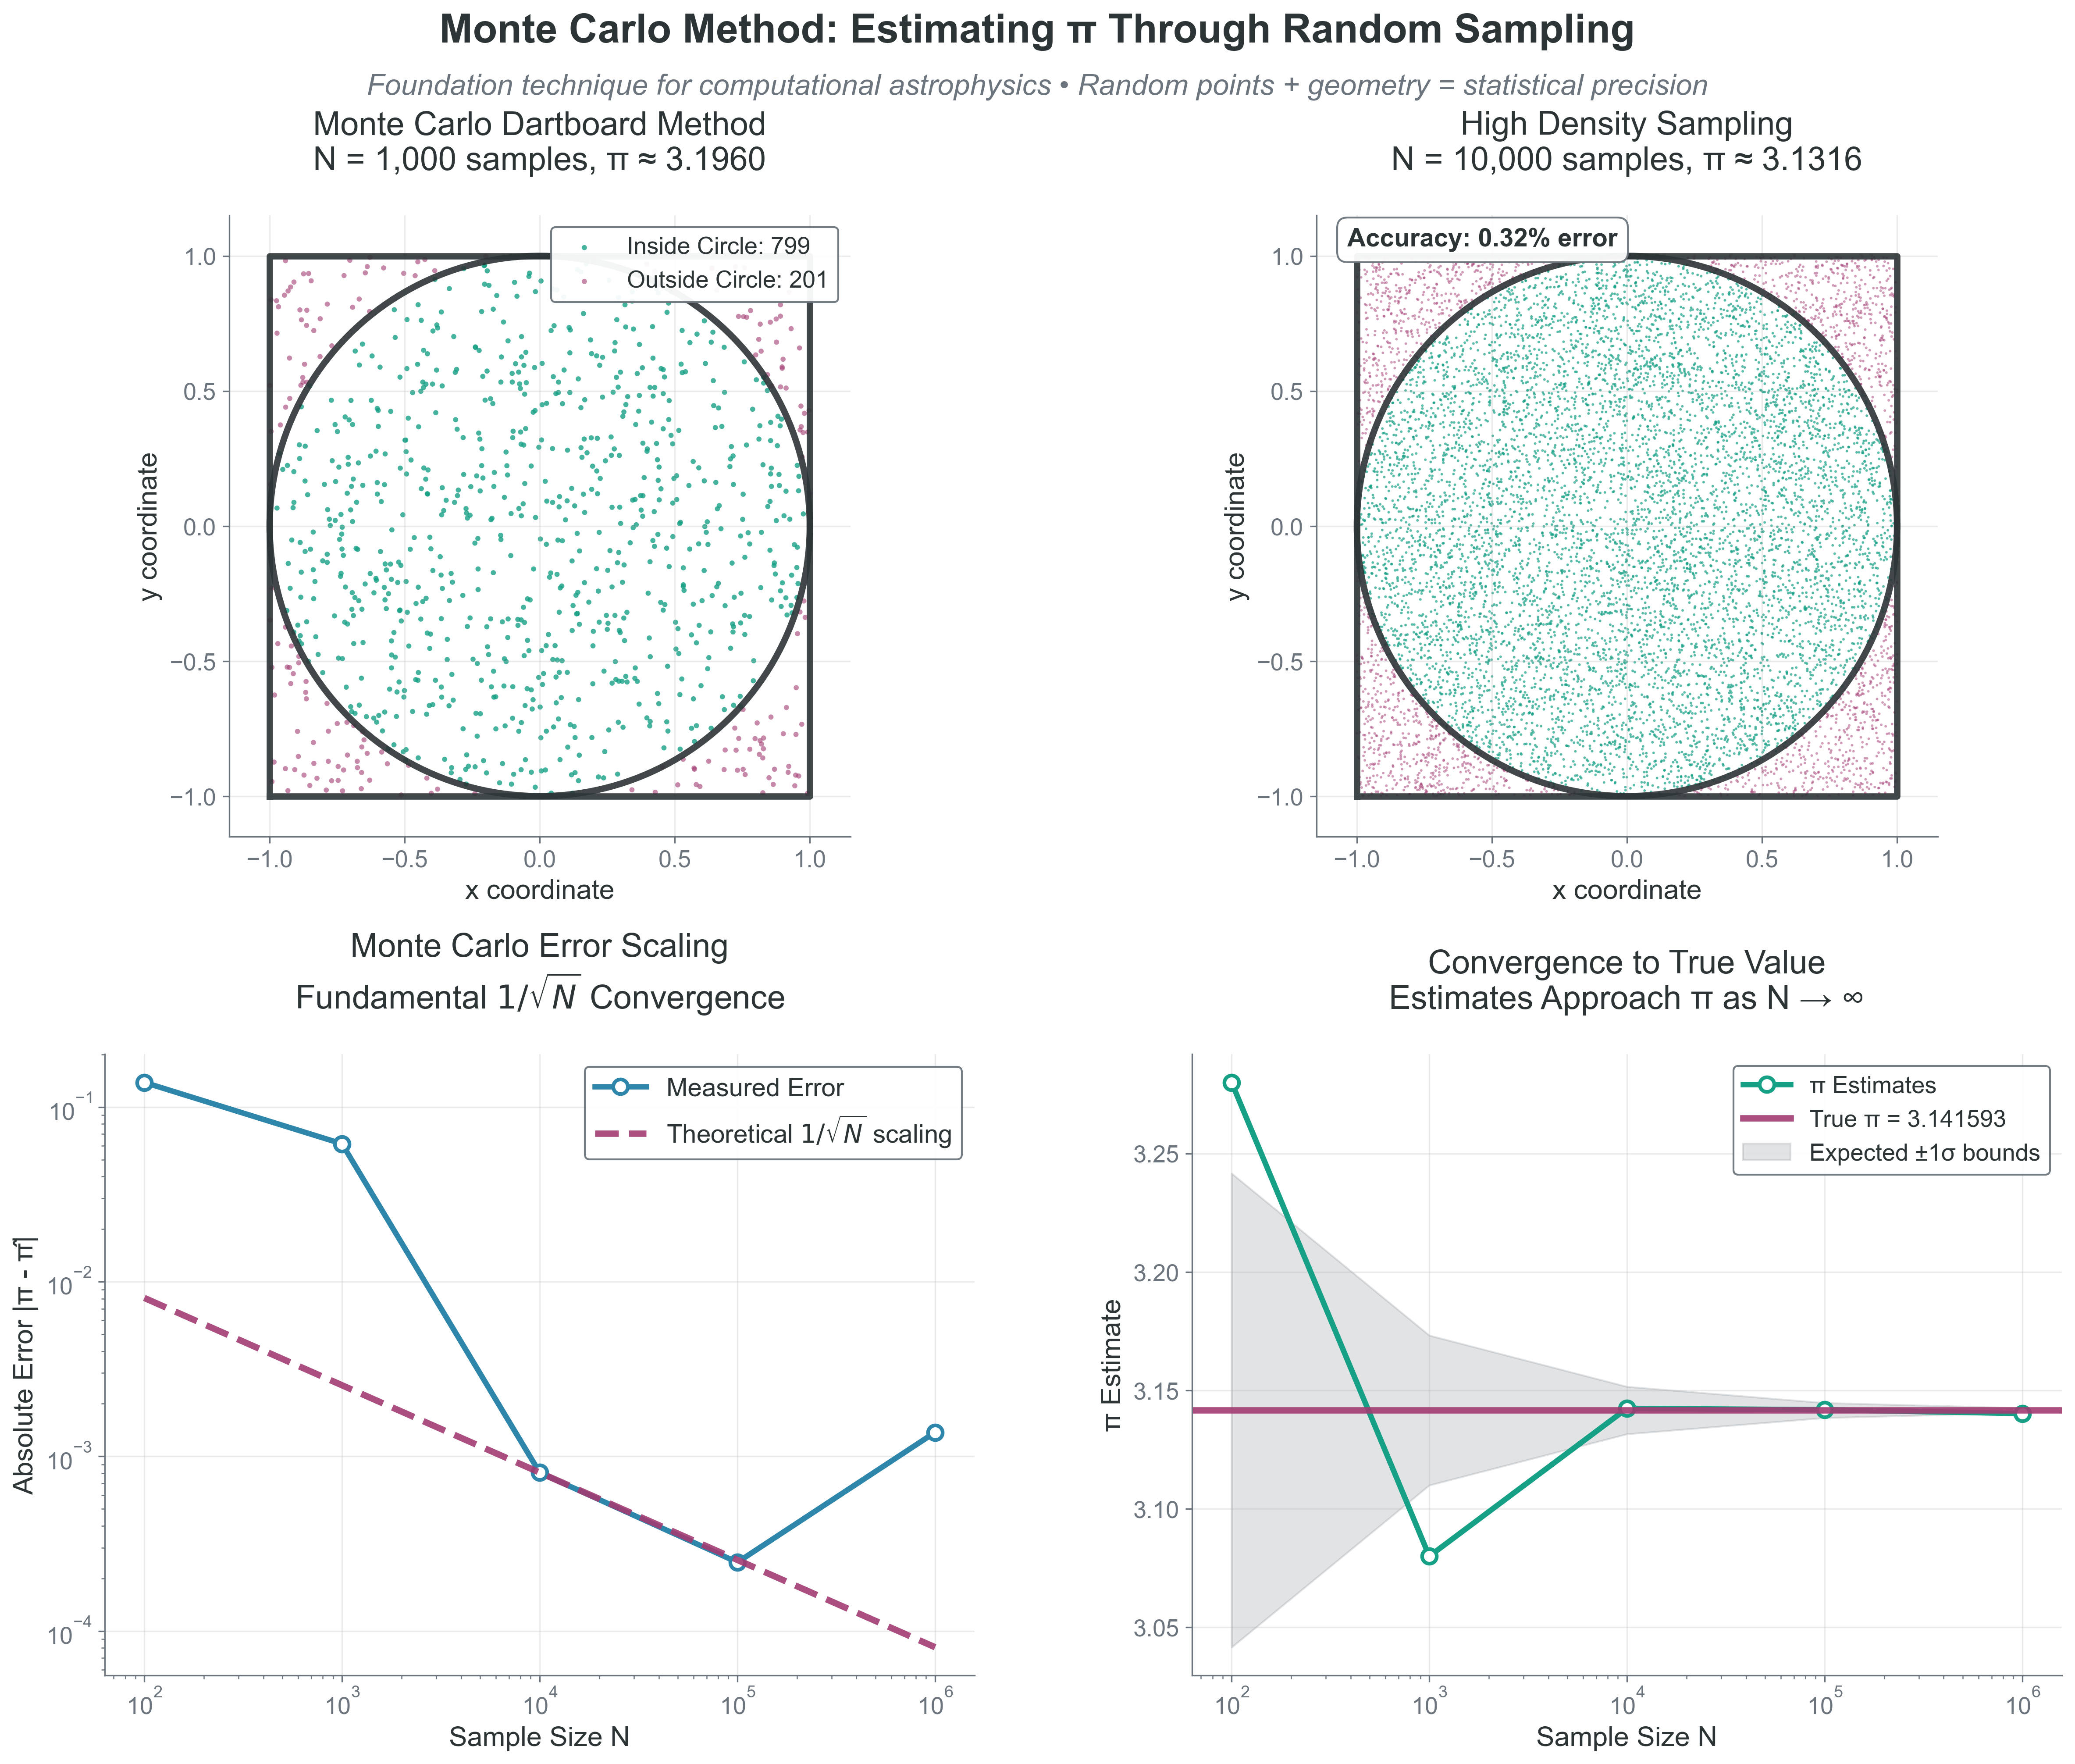 {#fig-monte-carlo-pi-estimation width=“100%”}
What to notice:
The estimate fluctuates stochastically around the true value.
Error decreases like , not linearly with .
Accuracy gains require rapidly increasing sample counts.
Project Hook: This appears in Project 2 when you transform uniform RNG draws into physically consistent mass, radius, and velocity samples.
4.2 The Cumulative Distribution Function (CDF) and Inverse Transform Sampling
Priority: 🔴 Essential
The key to sampling from any distribution lies in understanding the cumulative distribution function (CDF) and how it enables the inverse transform method — the most fundamental technique for converting uniform random numbers into samples from any distribution.
Understanding the CDF
The CDF is defined as:
While the probability density function (pdf) tells us the relative likelihood at each point, the CDF tells us the accumulated probability up to that point. This accumulation is what makes sampling possible.
To understand why this is so powerful, consider what the CDF actually represents. If you have a pdf that describes the distribution of stellar masses, then answers the question: “What fraction of stars have mass less than or equal to ?”
For example, in a stellar population:
= 0.3 means 30% of stars have mass
= 0.6 means 60% of stars have mass
means 100% of stars have some finite mass
Key properties of CDFs:
Always non-decreasing: if
Bounded: and
Continuous from the right: Important for discrete distributions
Derivative gives pdf: for continuous distributions
The Inverse Transform Method
The crucial insight is that the CDF transforms any distribution — no matter how complex — into a uniform distribution on [0,1]. This provides the bridge between uniform random numbers (which computers generate) and any distribution we want.
Assumption break cue: This method can fail in practice when the CDF is not reliably invertible, numerical inversion is unstable, or endpoint handling is ignored.
Visual intuition: Imagine the CDF as a transformation that “stretches” the uniform distribution. Regions where the PDF is large (high probability density) correspond to steep sections of the CDF. When we invert, these steep sections get “compressed” back, allocating more samples to high-probability regions.
Example: Exponential Distribution
Before tackling power laws, let’s see how this works for the exponential distribution (which describes photon path lengths, radioactive decay, and time between stellar collisions):
pdf: for x 0
CDF:
Inverse: Solve for x:
Equivalent form: , since and are both uniform on [0,1].
import numpy as np

# Sample exponential distribution (e.g., photon mean free paths)
def sample_exponential(lambda_param, n_samples, rng=None):
    if rng is None:
        rng = np.random.default_rng()
    u = rng.uniform(0, 1, n_samples)
    u = np.clip(u, 1e-15, 1 - 1e-15)
    return -np.log(1 - u) / lambda_param

# Example: mean free path of 1 pc
mfp = 1.0  # pc
rng = np.random.default_rng(536)
lambda_param = 1.0 / mfp
path_lengths = sample_exponential(lambda_param, 10000, rng=rng)
print(f"Mean path: {np.mean(path_lengths):.2f} pc")
print(f"Theory: {mfp:.2f} pc")
Copy/paste quick-check: Imports: numpy. Seed: set rng = np.random.default_rng(536) for repeatable means. Variability: sample mean fluctuates around the theoretical mean at finite draw counts.
Power Law Distributions: The Foundation of Astrophysics
Power law distributions appear everywhere in astronomy:
Stellar initial mass function (IMF)
Galaxy luminosity functions
Cosmic ray energy spectrum
Size distribution of asteroids and dust grains
Deriving the sampling formula:
Normalize the PDF: (for )
Compute the CDF:
Invert to get sampling formula: Set F(x) = u and solve for x:
Special case : The integral of is , so:
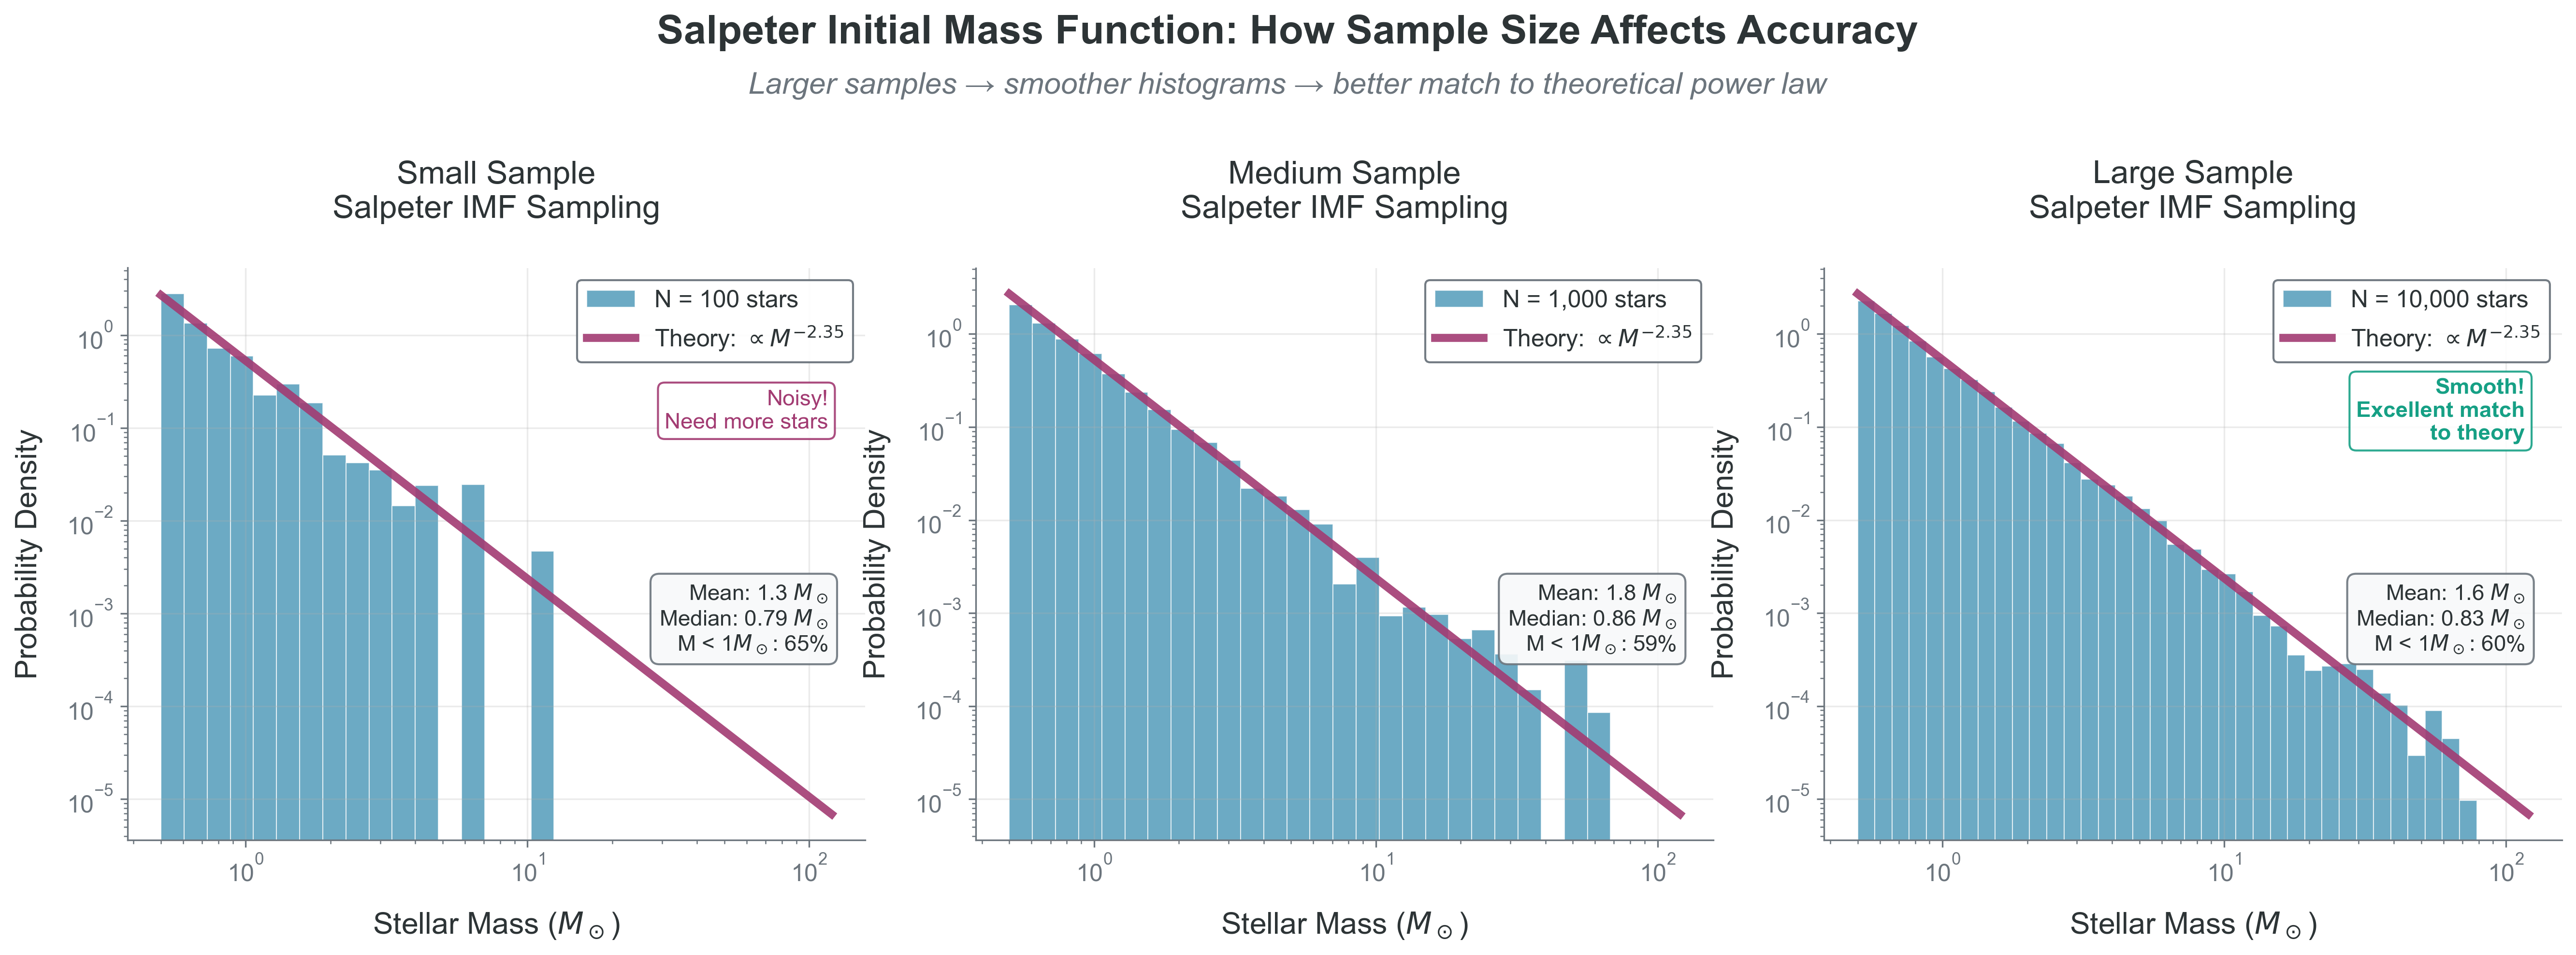 {#fig-power-law-sampling width=“100%”}
Implementation and Visualization
The figure above shows our power law sampling in action. Keep the production path small: sample, then run the Sampling Diagnostic Trio.
import numpy as np

def sample_simple_power_law(alpha, x_min, x_max, n_samples, rng=None):
    if rng is None:
        rng = np.random.default_rng()
    u = rng.uniform(0, 1, n_samples)
    return (x_min**(1-alpha) + u*(x_max**(1-alpha) - x_min**(1-alpha)))**(1/(1-alpha))

samples = sample_simple_power_law(2.35, 0.1, 100, 10_000, rng=np.random.default_rng(536))
print(np.mean(samples), np.var(samples), np.mean(samples > 10.0))
Use the Sampling Diagnostic Trio here: histogram-vs-theory for pdf shape, empirical CDF (or QQ) for distributional agreement, and moments plus a high-mass tail fraction for inference.
Full plotting example (optional deep dive)
import numpy as np
import matplotlib.pyplot as plt

def sample_simple_power_law(alpha, x_min, x_max, n_samples, rng=None):
    """
    Sample from a power law distribution p(x) ~ x^(-alpha).

    This demonstrates the inverse transform method for power laws.
    Special case: alpha = 1 requires logarithmic sampling.

    Parameters:
    -----------
    alpha : float
        Power law exponent (positive for decreasing function)
    x_min, x_max : float
        Range of the distribution
    n_samples : int
        Number of samples to generate

    Returns:
    --------
    samples : ndarray
        Random samples from the power law
    """
    if rng is None:
        rng = np.random.default_rng()

    u = rng.uniform(0, 1, n_samples)

    if abs(alpha - 1.0) < 1e-10:
        # Special case: p(x) ~ x^(-1)
        # CDF integral gives logarithmic form
        samples = x_min * (x_max/x_min)**u
    else:
        # General case: p(x) ~ x^(-alpha)
        # Apply the inverse transform formula we derived
        samples = (x_min**(1-alpha) + u*(x_max**(1-alpha) - x_min**(1-alpha)))**(1/(1-alpha))

    return samples

# Example: Sample stellar masses with different power laws
fig, axes = plt.subplots(1, 3, figsize=(15, 4))

# Different IMF slopes (Salpeter has alpha = 2.35)
alphas = [1.3, 2.3, 3.5]
x_min, x_max = 0.1, 100  # Solar masses
rng = np.random.default_rng(536)

for ax, alpha in zip(axes, alphas):
    # Generate samples
    samples = sample_simple_power_law(alpha, x_min, x_max, 10000, rng=rng)

    # Plot histogram
    bins = np.logspace(np.log10(x_min), np.log10(x_max), 50)
    ax.hist(samples, bins=bins, alpha=0.7, density=True, label='Samples')

    # Overlay theoretical distribution
    x_theory = np.logspace(np.log10(x_min), np.log10(x_max), 100)
    # Normalized power law
    if alpha != 1:
        norm = (1-alpha)/(x_max**(1-alpha) - x_min**(1-alpha))
        p_theory = abs(norm) * x_theory**(-alpha)  # abs() for alpha < 1
    else:
        norm = 1/np.log(x_max/x_min)
        p_theory = norm / x_theory

    ax.plot(x_theory, p_theory, 'r-', linewidth=2, label='Theory')

    ax.set_xscale('log')
    ax.set_yscale('log')
    ax.set_xlabel("Mass [M_sun]")
    ax.set_ylabel('Probability Density')
    ax.set_title(rf'$\alpha = ${alpha}')
    ax.legend()
    ax.grid(True, alpha=0.3)

    # Add statistics
    mean_mass = np.mean(samples)
    median_mass = np.median(samples)
    text_str = f"Mean: {mean_mass:.1f} M_sun\nMedian: {median_mass:.1f} M_sun"
    ax.text(0.05, 0.95, text_str, transform=ax.transAxes,
            verticalalignment='top', bbox=dict(boxstyle='round', facecolor='wheat', alpha=0.5))

plt.suptitle('Power Law Sampling with Different Slopes', fontsize=14)
plt.tight_layout()
plt.show()

# Show how the distribution changes with alpha
print("Effect of power law slope alpha on stellar mass distribution:")
print(f"{'alpha':<8} {'Mean [M_sun]':<14} {'Median [M_sun]':<16} {'% below 1 M_sun':<18}")
print("-" * 50)

for alpha in alphas:
    samples = sample_simple_power_law(alpha, x_min, x_max, 10000, rng=rng)
    mean_mass = np.mean(samples)
    median_mass = np.median(samples)
    frac_below_1 = np.sum(samples < 1.0) / len(samples) * 100
    print(f"{alpha:<8.1f} {mean_mass:<14.2f} {median_mass:<16.2f} {frac_below_1:<18.1f}")
Copy/paste quick-check: Imports: numpy, matplotlib. Seed: set rng = np.random.default_rng(536) for reproducible sampling tables/plots. Variability: slope-dependent trends persist, while exact summary values vary with seed and sample count.
Why the Inverse Transform is Powerful
The inverse transform method is the foundation of Monte Carlo sampling because:
It’s exact: Every uniform random number produces exactly one sample from your distribution
It’s efficient: 100% of random numbers are used (no rejections)
It’s deterministic: The same uniform input always gives the same output (useful for debugging)
It works in any dimension: Can be extended to multivariate distributions
However, it requires that you can:
Compute the CDF analytically (or numerically)
Invert the CDF (analytically or numerically)
When these conditions aren’t met, you’ll need other methods like rejection sampling (Section 4.3) or Markov Chain Monte Carlo (Project 4).
Example: Exponential distribution (photon path lengths!)
pdf:
CDF:
Inverse:
Equivalent form: because and are both Uniform
Simple implementation:
import numpy as np

# Sample exponential distribution (e.g., photon path lengths)
def sample_exponential(lambda_param, n_samples, rng=None):
    if rng is None:
        rng = np.random.default_rng()
    u = rng.uniform(0, 1, n_samples)
    u = np.clip(u, 1e-15, 1 - 1e-15)
    # Inverse CDF transform
    return -np.log(1 - u) / lambda_param

# Example: mean free path of 1 pc
mfp = 1.0  # pc
rng = np.random.default_rng(536)
lambda_param = 1.0 / mfp
path_lengths = sample_exponential(lambda_param, 10000, rng=rng)
print(f"Mean path: {np.mean(path_lengths):.2f} pc")
print(f"Theory: {mfp:.2f} pc")
Copy/paste quick-check: Imports: numpy. Seed: set rng = np.random.default_rng(536) to reproduce output means. Variability: finite-sample mean fluctuates around the target mean free path.
4.3 Rejection Sampling
Priority: 🟡 Standard Path
When inverse transform fails, use rejection sampling:
Example: Throw darts at rectangle, keep those under curve.
import numpy as np

# Example: Sample from arbitrary distribution
def rejection_sample(p_func, x_min, x_max, f_max, n_samples, max_tries=10_000_000, rng=None):
    """Sample using rejection method"""
    if rng is None:
        rng = np.random.default_rng()
    samples = []
    n_tries = 0

    while len(samples) < n_samples:
        if n_tries >= max_tries:
            raise RuntimeError("Exceeded max_tries; check f_max envelope or target PDF.")
        x = rng.uniform(x_min, x_max)
        y = rng.uniform(0, f_max)
        n_tries += 1

        if y <= p_func(x):
            samples.append(x)

    efficiency = n_samples / n_tries
    print(f"Efficiency: {efficiency:.1%}")
    return np.array(samples)
Copy/paste quick-check: Imports: numpy. Seed recommendation: pass rng=np.random.default_rng(536) for repeatable envelope comparisons. Variability: efficiency varies stochastically even with fixed target PDF.
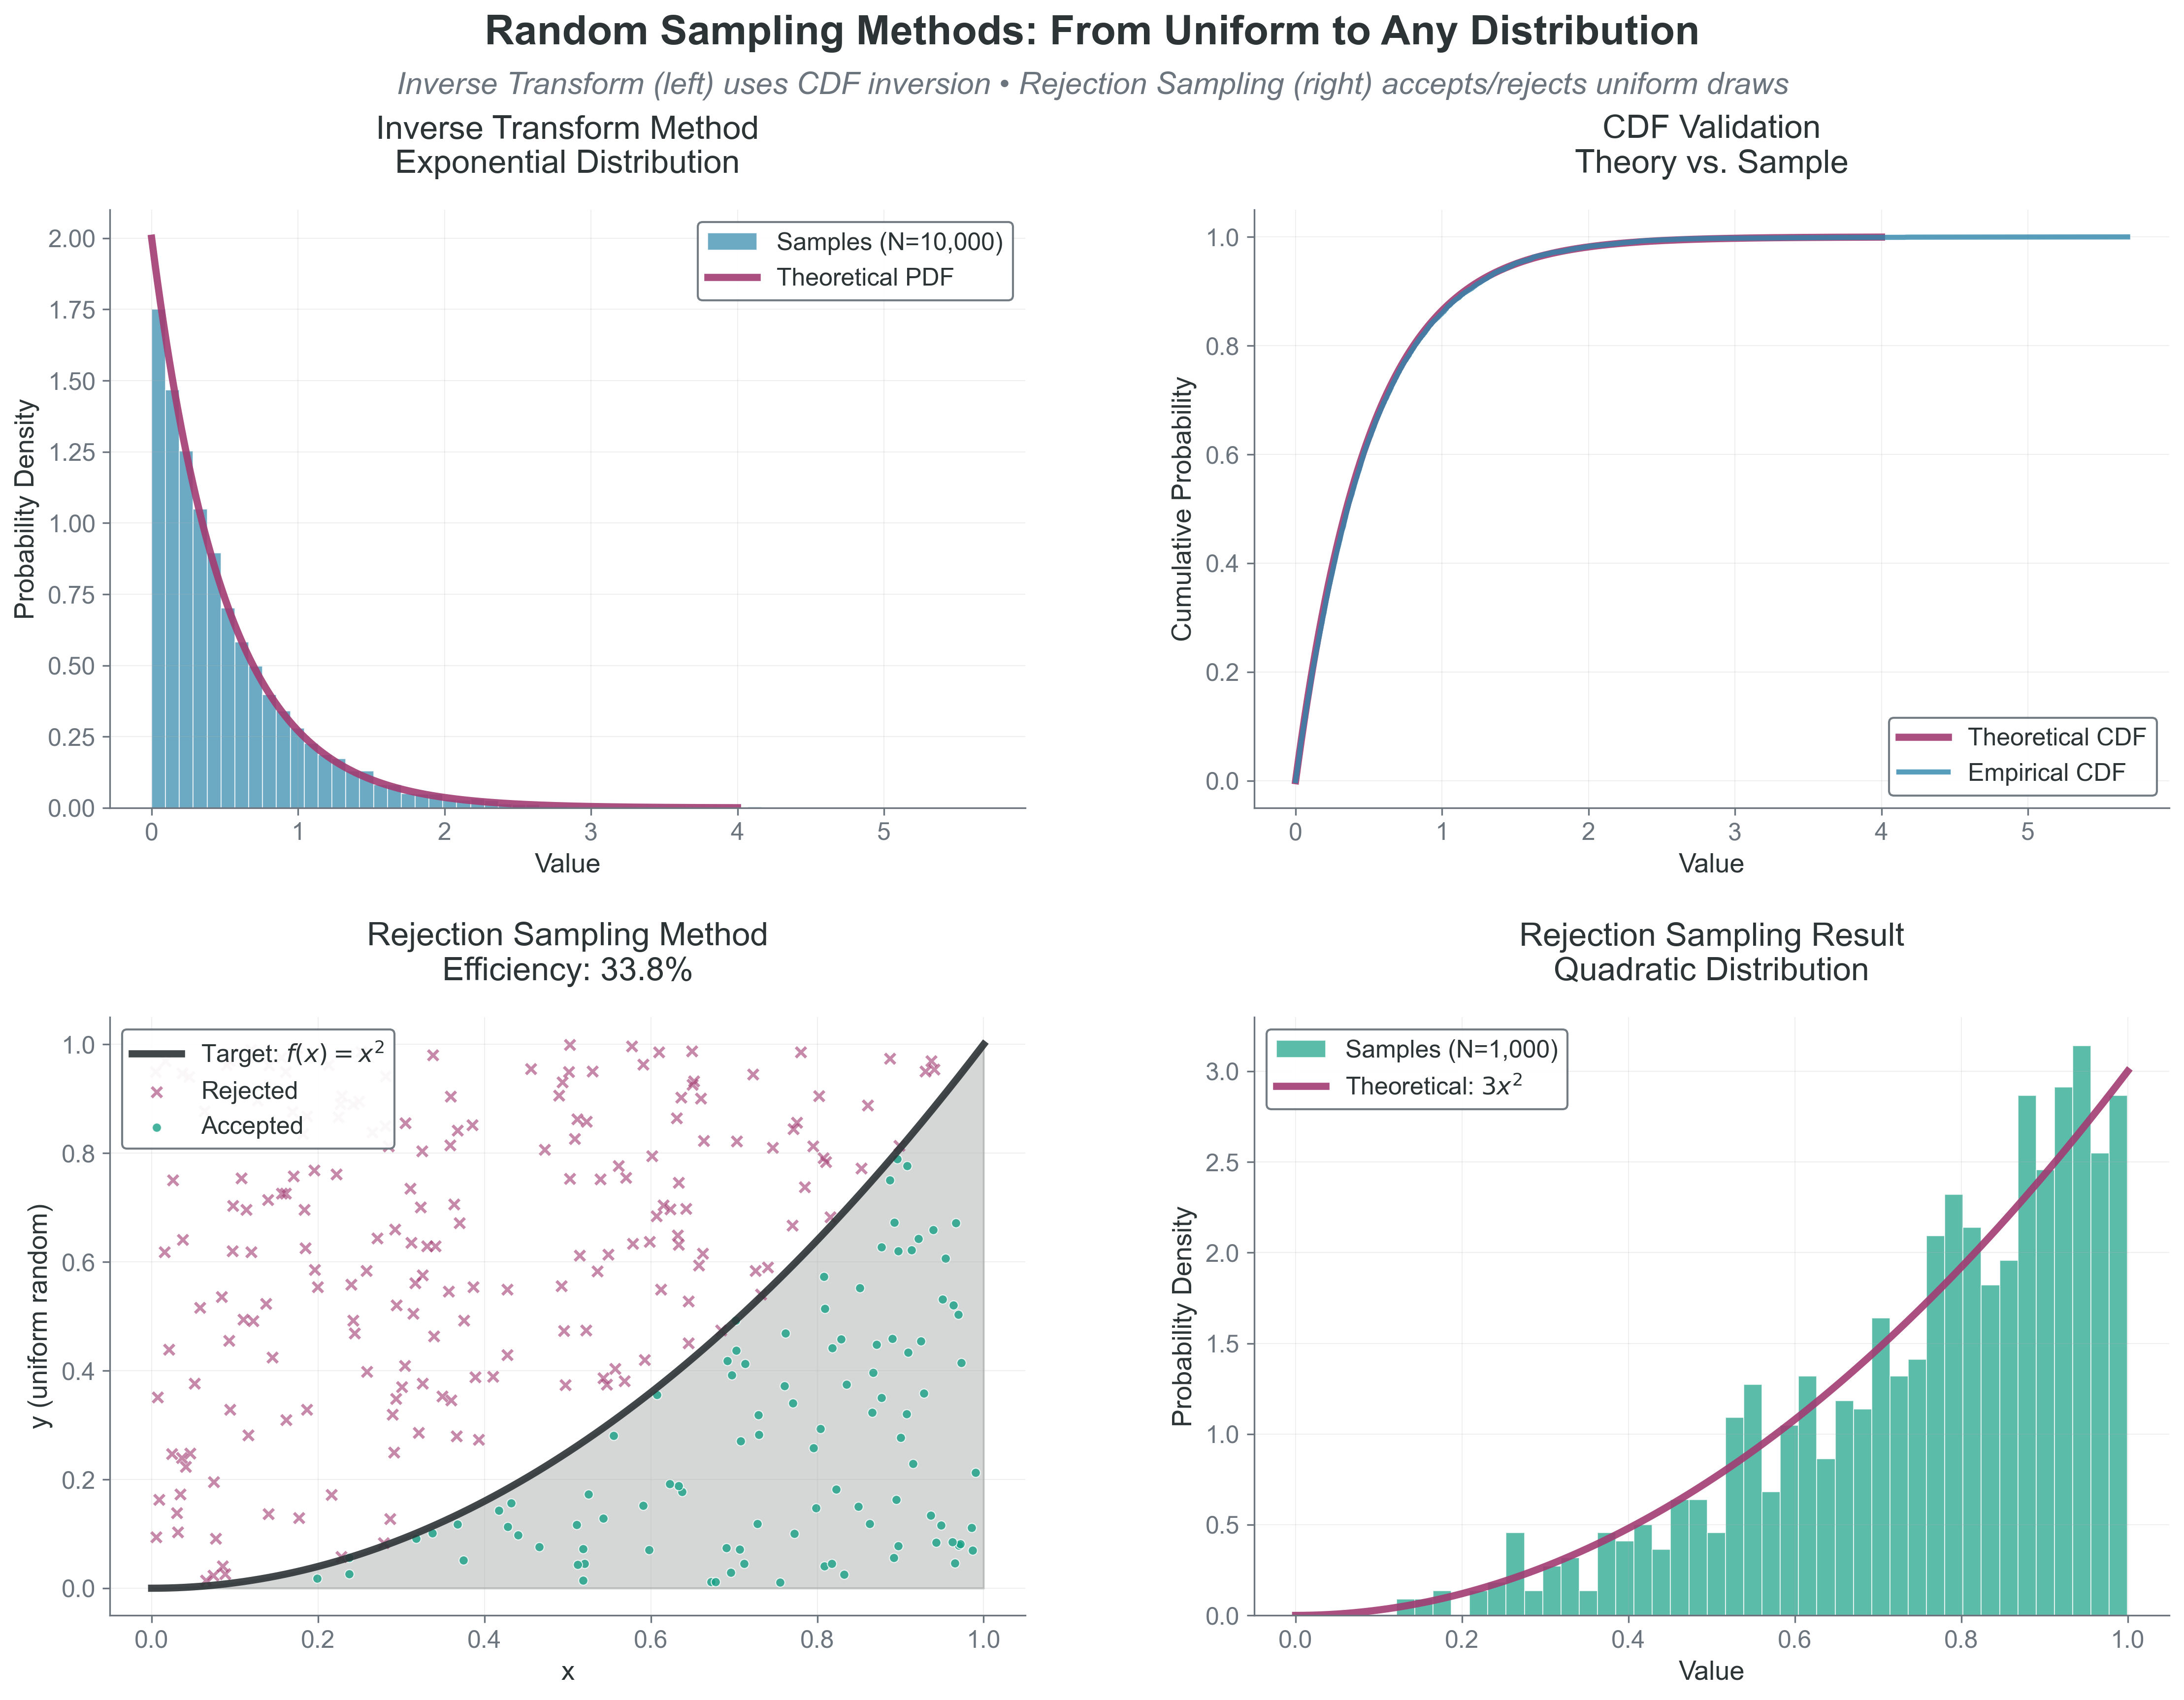 {#fig-random-sampling-methods width=“100%”}
What to notice:
Inverse transform is exact and efficient when an invertible CDF exists.
Rejection sampling is flexible but wastes draws depending on envelope tightness.
The same uniform RNG can support very different target distributions.
4.4 Spatial Distributions: The Plummer Sphere
Priority: 🔴 Essential for Project 2
Now that you can sample stellar masses from the Kroupa IMF, you need to place these stars in space. The Plummer sphere is a standard density profile for globular clusters and stellar systems.
The Plummer Profile
The Plummer sphere has density profile:
where:
is the total cluster mass
is the Plummer radius (scale length)
is the distance from center
This creates a smooth, centrally concentrated distribution that avoids the infinite density at r=0 that plagues some other profiles.
The Sampling Challenge
You can’t sample directly from because density isn’t probability! The key insight: the probability of finding a star between radius and is proportional to the mass in that shell, not the density.
So the radial PDF is:
Approach 1: Mass Profile Method
The enclosed mass within radius is:
The cumulative mass fraction (which IS a CDF!) is:
To sample:
Generate (this represents a mass fraction)
Solve for
Place the star at radius with random angular coordinates
Assumption break cue: Radial sampling is biased if isotropy is violated in angle draws or if finite-radius truncation is introduced without updating the CDF.
Approach 2: Rejection Sampling in 3D
Alternatively, you could:
Generate random positions in a cube containing your cluster
Accept/reject based on the density at that position
But this becomes inefficient for large clusters!
From Radius to 3D Positions
Once you have radius :
Generate random direction on sphere:
(azimuthal angle)
Convert to Cartesian:
Or use the simpler method: generate a random unit vector and scale by .
Verification
Your sampled positions should reproduce:
The density profile when binned radially
The enclosed mass profile
The half-mass radius for Plummer
The Sampling Diagnostic Trio: histogram-vs-theory for , empirical CDF-vs-theory for , and summary moments/tail fraction for radial structure
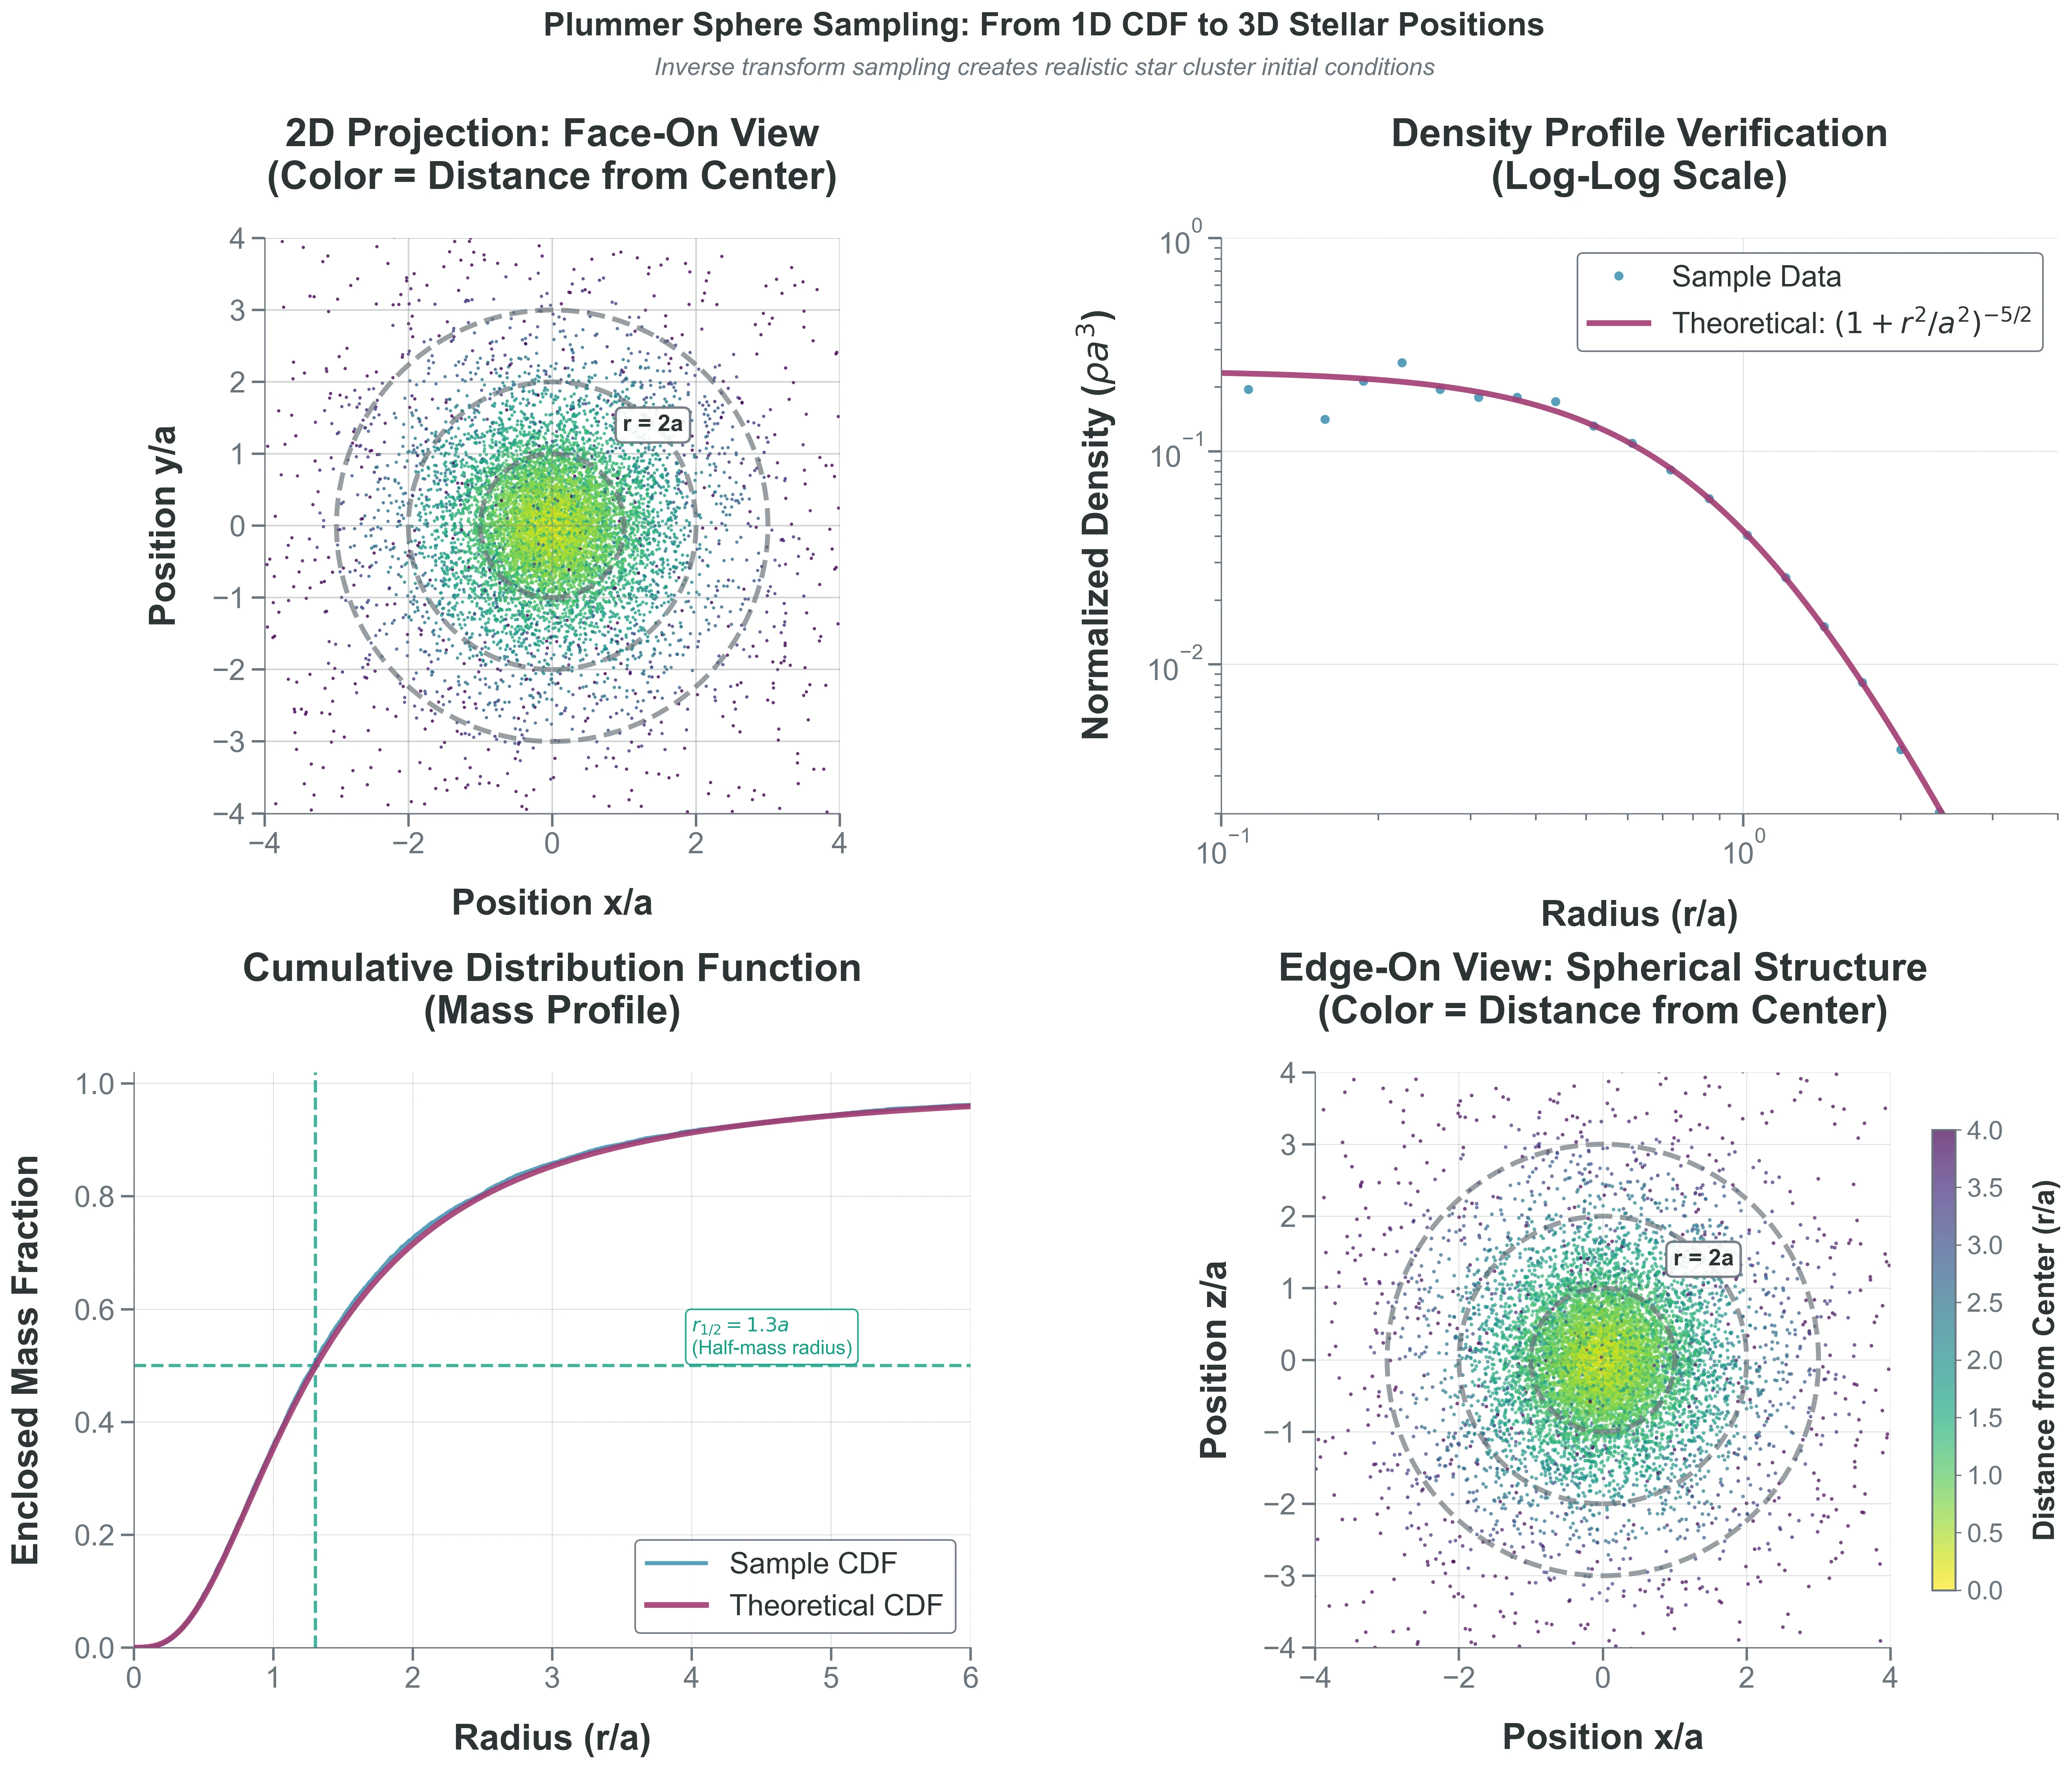 {#fig-plummer-sphere-sampling width=“100%”}
What to notice:
Radial sampling matches both and diagnostics.
The half-mass radius is recovered near the theoretical value.
Isotropic angle sampling is required to avoid directional bias.
🌟 Why Plummer for Globular Clusters?
The Plummer sphere, developed by H.C. Plummer in 1911 for fitting star clusters, has several advantages:
Finite central density: Unlike the singular isothermal sphere (SIS) model.
Finite total mass: Unlike the Navarro–Frenk–White (NFW) profile that extends to infinity, used to describe a spatial mass distribution of dark matter fitted to dark matter halos.
Analytical everything: Density, potential, distribution function all have closed forms.
Stable: Can be realized as equilibrium of self-gravitating system.
Real globular clusters are more complex (mass segregation, tidal truncation, rotation), but the Plummer profile is an excellent starting point that captures the essential physics: central concentration with smooth decline.