Learning Outcomes
By the end of Part 2, you will be able to:
Explain why scientific inference requires a formal extension of logic to uncertainty, and summarize how Cox’s theorems motivate probability theory as that framework
Distinguish clearly between the forward-model quantity P(data|parameters) and the inferential quantity P(parameters|data), and explain why confusing them leads to bad scientific reasoning
Construct a likelihood by combining a physical forward model with an explicit noise model and stated assumptions about uncertainty
Transform astronomical knowledge into mathematical prior distributions
Derive Bayes’ theorem from first principles using counting arguments
Apply the complete Bayesian framework to Cepheid distance measurement
Connect each component to concepts from the Statistical Thinking module
Part 2: From Beliefs to Mathematics
How do we transform vague beliefs into rigorous inference?
Core Question: How do we transform statements like “this star probably has little dust” into a mathematical framework that can connect observations to physical parameters under uncertainty?
Observable Model Inference roadmap
Observable: We measure quantities like apparent magnitude, color, spectrum, and variability period.
Model: We build a forward model that predicts those observables from physical parameters like distance, extinction, luminosity, or metallicity.
Inference: We use probability theory to update what we believe about those physical parameters given the data we actually observed.
This section develops the mathematical language that makes that pipeline possible.
2.1 Probability as Extended Logic
Priority - 🔴 Essential:
What Are We Actually Doing? Epistemology
At its core, this section is about epistemology — the study of how we know things — because astronomy almost never gives us the physical quantities we care about directly.
We do not directly observe stellar mass, distance, age, or composition. We do observe light curves, spectra, colors, images, and apparent brightness.
That means astronomy always begins with an observable, then requires a model connecting those observables to physical reality, and finally demands inference to determine which physical explanations are most plausible.
Every scientific conclusion we make is therefore an inference: a statement about reality built from incomplete and uncertain information. The real question is: How should a rational scientist update knowledge in the presence of uncertainty? Classical logic cannot answer that question. Logic tells us what is certainly true. Science operates in a regime where almost nothing is certain. We need a framework that extends logic to handle degrees of belief without becoming inconsistent. That is the problem Cox set out to solve.
The Limits of True and False
Classical logic, the foundation of mathematics since Aristotle, deals in absolutes. A statement is either true or false. A star either has dust extinction or it doesn’t. But astronomy rarely gives us that kind of certainty. When we observe a reddened star, we cannot conclude with certainty that the star lies behind dust. The reddening could be intrinsic because the star is cool, it could be due to dust, it could reflect measurement error, or it could be some combination.
Consider the logical chain an astronomer faces:
If a star is behind dust, it will appear reddened (TRUE)
This star appears reddened (TRUE)
Therefore... what?
Classical logic fails here because it has no language for graded support. It can represent certainty, but not the intermediate state that dominates science: evidence that supports a claim without proving it. The star might be behind dust, but it might also be intrinsically red. A scientist needs to say something like: “the reddening increases the plausibility that the star is behind dust, but it does not prove it.” That is exactly the gap between deductive logic and scientific inference. Probability enters here not as a convenient tool, but as a necessity.
Probability: The Language of Plausible Reasoning
In the 1940s, physicist Richard Cox asked a more demanding question than “How should we use probability?” He asked: What rules must any rational system of belief obey if it is going to reason consistently under uncertainty? Under Cox’s assumptions about rational consistency, the rules of plausible reasoning are isomorphic to probability theory. In that sense, probability is not just a convenient tool. It is the unique consistent extension of Boolean logic to uncertain reasoning.
Cox started with desiderata (requirements) that any system of plausible reasoning should satisfy:
Degrees of Plausibility: Propositions have degrees of plausibility, represented by real numbers
Consistency: If a conclusion can be reached in multiple ways, all ways must give the same answer
Correspondence: In the limit of certainty, plausible reasoning must reduce to deductive logic
Universality: The system should handle any proposition we can state
From just these requirements — which seem almost too basic to be powerful — Cox proved that plausible reasoning MUST follow the rules of probability theory. Not “should” or “could” — MUST.
From Astronomical Intuition to Mathematical Probability
Astronomers have always thought probabilistically, even before formalizing it. When Henrietta Leavitt said “these stars are probably at the same distance,” she was expressing a degree of belief. When modern astronomers say “this galaxy probably contains dark matter,” they’re doing plausible reasoning. Probability theory just makes this reasoning mathematically rigorous.
Let’s see how astronomical statements become probabilities:
Qualitative Statement Probability Statement
“This star is probably nearby”
“Little dust in this direction”
“Cepheid follows the - relation”
Each transformation takes vague intuition and makes it precise. The numbers aren’t arbitrary — they encode our accumulated knowledge from centuries of observations.
The Cepheid Example: From Logic to Probability
Before writing probabilities, we should state the inferential problem clearly:
Observed: period, apparent magnitude, colors, and their uncertainties
Unknown: distance, extinction, and possibly metallicity
Goal: infer which combinations of physical parameters are most compatible with the observations
Classical logic cannot solve this because the data do not determine a unique conclusion. Probability gives us a way to represent and update degrees of support across many possible physical explanations.
Let’s apply this to our running Cepheid example. Using classical logic:
What we know for certain:
The star’s brightness varies periodically (TRUE)
The period is 5.366 days (TRUE)
Longer-period Cepheids are intrinsically brighter (TRUE from P-L relation)
What we can’t deduce with certainty:
The star’s distance (depends on intrinsic brightness)
The amount of dust extinction (degenerate with distance)
Whether it follows the standard P-L relation (metallicity effects?)
Enter probability:
[needs Bayes!]
Probability extends our logical reasoning to handle these uncertainties systematically.
Why Not Other Systems?
You might wonder: Why probability? Couldn’t we use fuzzy logic, possibility theory, or some other framework? Cox’s theorems say no — if we want consistency, we’re forced to use probability.
Here’s what happens with alternatives:
Fuzzy Logic: Handles vagueness (“very hot star”) but not uncertainty about facts Interval Arithmetic: Gives ranges but loses information about likelihood within the range Possibility Theory: Lacks the mathematical structure needed for updating with evidence
Only probability theory provides:
Consistent updating with new information (Bayes’ theorem)
Proper handling of correlations between variables
Natural incorporation of measurement uncertainties
Recovery of deductive logic in the limit of certainty
This uniqueness is profound. It means that aliens doing astronomy would use the same probability theory we do — not because they learned it from us, but because mathematics forces it on any consistent reasoner.
2.2 Likelihood: Encoding Physics as Probability
Priority: 🔴 Essential
The Direction That Physics Gives Us
In the Observable Model Inference framework, the likelihood is the step where the model turns physical parameters into predicted observables with an explicit uncertainty model.
Physics naturally runs forward — from causes to effects, from parameters to observations. If we know a star’s temperature, we can predict its spectrum. If we know a Cepheid’s period and intrinsic brightness, we can predict its apparent magnitude at any distance. This forward direction is what physics provides, and it’s encoded in the likelihood function.
But here’s the critical insight that confuses many: The likelihood is NOT the probability of the parameters. It’s the probability of the data given the parameters. This distinction is subtle but fundamental.
Consider measuring a Cepheid’s brightness:
Forward (Physics): Given and , predict
Inverse (Inference): Given and , infer
The likelihood lives in the forward-model direction:
start with a hypothetical physical state,
predict what data that state would generate,
ask whether the observed data would be plausible under that hypothesis.
So the likelihood asks:
If the distance were 2.5 Mpc, how probable is it that we would observe ?
That is fundamentally different from the inferential question:
Given that we observed , how plausible is 2.5 Mpc?
The first is likelihood. The second requires Bayes’ theorem.
Building a Likelihood from Physics
Let’s construct a real likelihood function for our Cepheid. We start with the physics — the Period-Luminosity relation discovered by Leavitt:
The Physics Model:
where M_V is absolute V-band magnitude and P is period in days.
Adding Distance: The distance modulus relation connects intrinsic and apparent brightness:
where d is distance in parsecs.
Combining the Physics:
This is our deterministic model — given P and d, we predict m. But observations aren’t perfect...
From Deterministic Model to Probabilistic Likelihood
Real measurements have uncertainties. Our CCD has read noise, the atmosphere scintillates, and Cepheids have intrinsic scatter in their P-L relation. We need to transform our deterministic model into a probability distribution.
Step 1: Identify the uncertainties
Measurement error: (photon noise + systematics)
Intrinsic scatter: (Cepheids aren’t perfect standard candles)
Total uncertainty:
Step 2: Choose a noise model From the Statistical Thinking module, we learned about the Central Limit Theorem — many small random effects sum to a Gaussian distribution. Both measurement errors and intrinsic scatter arise from many small effects, so we use a Gaussian noise model.
Step 3: Write the likelihood
where we’ve added extinction A_V to our model (making it more realistic).
The Likelihood in Practice
def cepheid_likelihood(params, observations):
"""
Likelihood for Cepheid distance measurement.
Physics model + measurement uncertainty = likelihood
"""
distance, extinction = params # What we want to infer
period, apparent_mag, mag_error = observations # What we measured
# Physics: Period-Luminosity relation (Leavitt Law)
absolute_mag = -2.43 * (np.log10(period) - 1) - 4.05
# Physics: Distance modulus
distance_modulus = 5 * np.log10(distance) - 5
# Physics: Extinction dims the star
predicted_mag = absolute_mag + distance_modulus + extinction
# Statistics: Gaussian noise model
intrinsic_scatter = 0.15 # Cepheids aren't perfect standard candles
total_sigma = np.sqrt(mag_error**2 + intrinsic_scatter**2)
# The likelihood: How probable is our observation given these parameters?
residual = apparent_mag - predicted_mag
log_likelihood = -0.5 * (residual/total_sigma)**2 - np.log(total_sigma * np.sqrt(2*np.pi))
return np.exp(log_likelihood)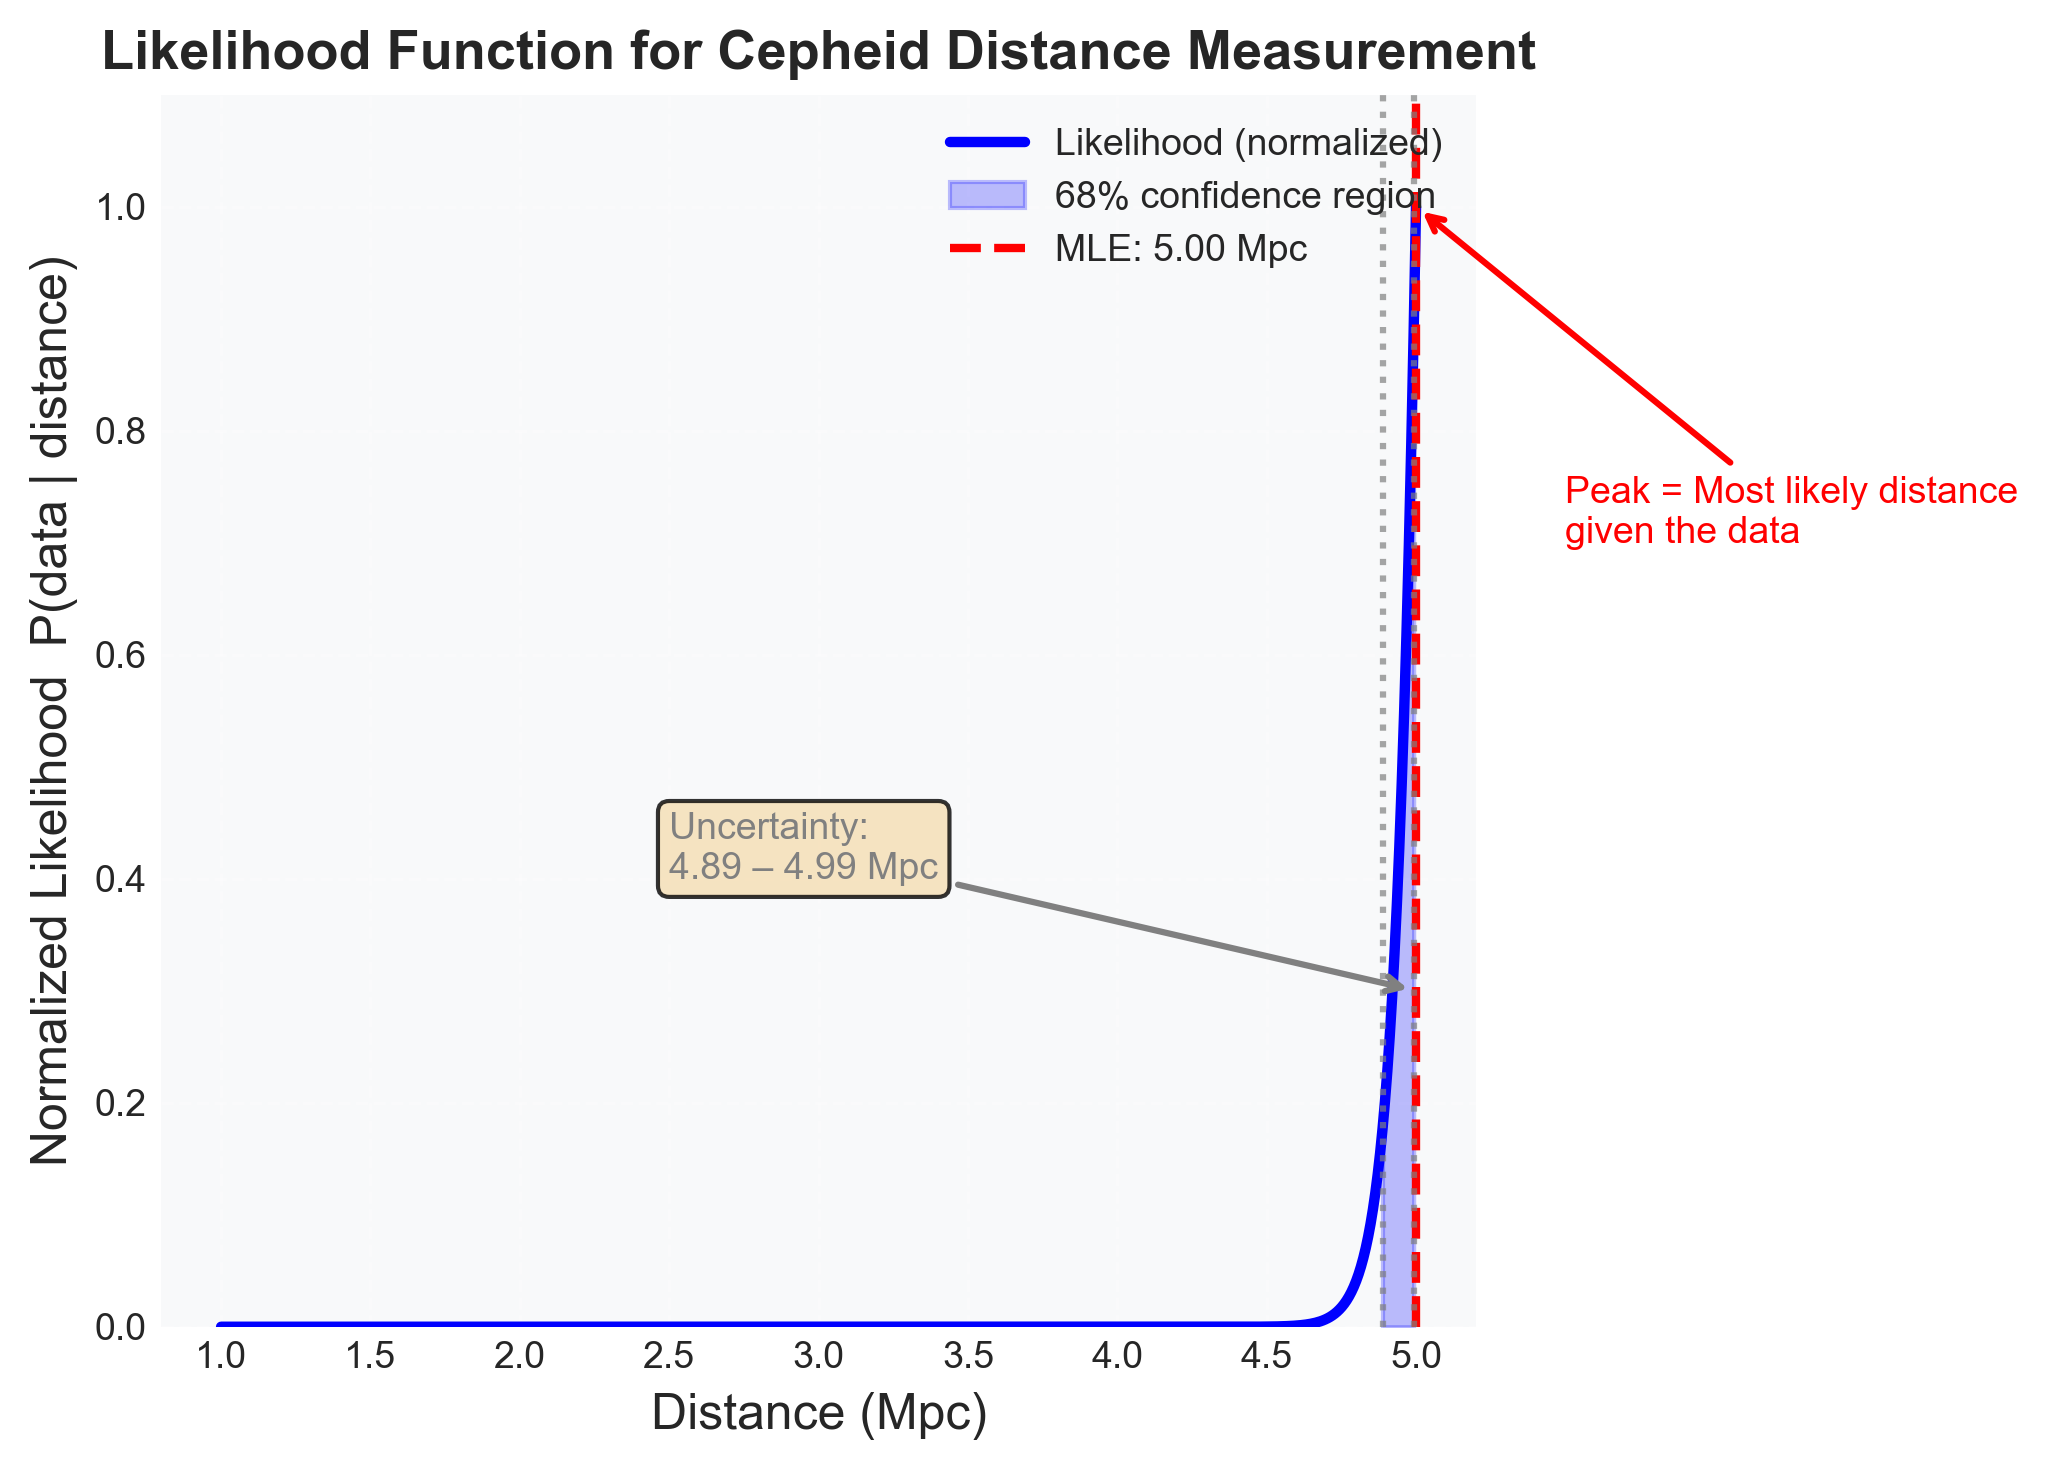 {width=“100%” #fig-likelihood-1d}
Common Likelihood Pitfalls
Pitfall 1: Forgetting intrinsic scatter If you only include measurement error, you’ll be overconfident. Real astronomical objects have intrinsic variation that must be included in the likelihood.
Pitfall 2: Assuming Gaussian errors From Statistical Thinking, we know the CLT gives us Gaussians for many small effects. But what about outliers? Cosmic rays? Variable stars misclassified as Cepheids? Real data often has heavy tails, requiring robust likelihoods (like Student-t distributions).
Pitfall 3: Ignoring correlations If you observe multiple Cepheids with the same telescope, their measurements share systematic errors. The likelihood needs the full covariance matrix, not just individual error bars.
Pitfall 4: Confusing likelihood with posterior Remember: likelihood is , not . Mixing these up leads to incorrect inferences.
Wrong reasoning sounds like this: “The likelihood peaks at 5 Mpc, so the star is probably at 5 Mpc.” That is not yet justified. A likelihood peak identifies which parameter values make the observed data most compatible with the forward model. It is not a posterior statement about what is most plausible after accounting for prior knowledge and normalization over parameter space.
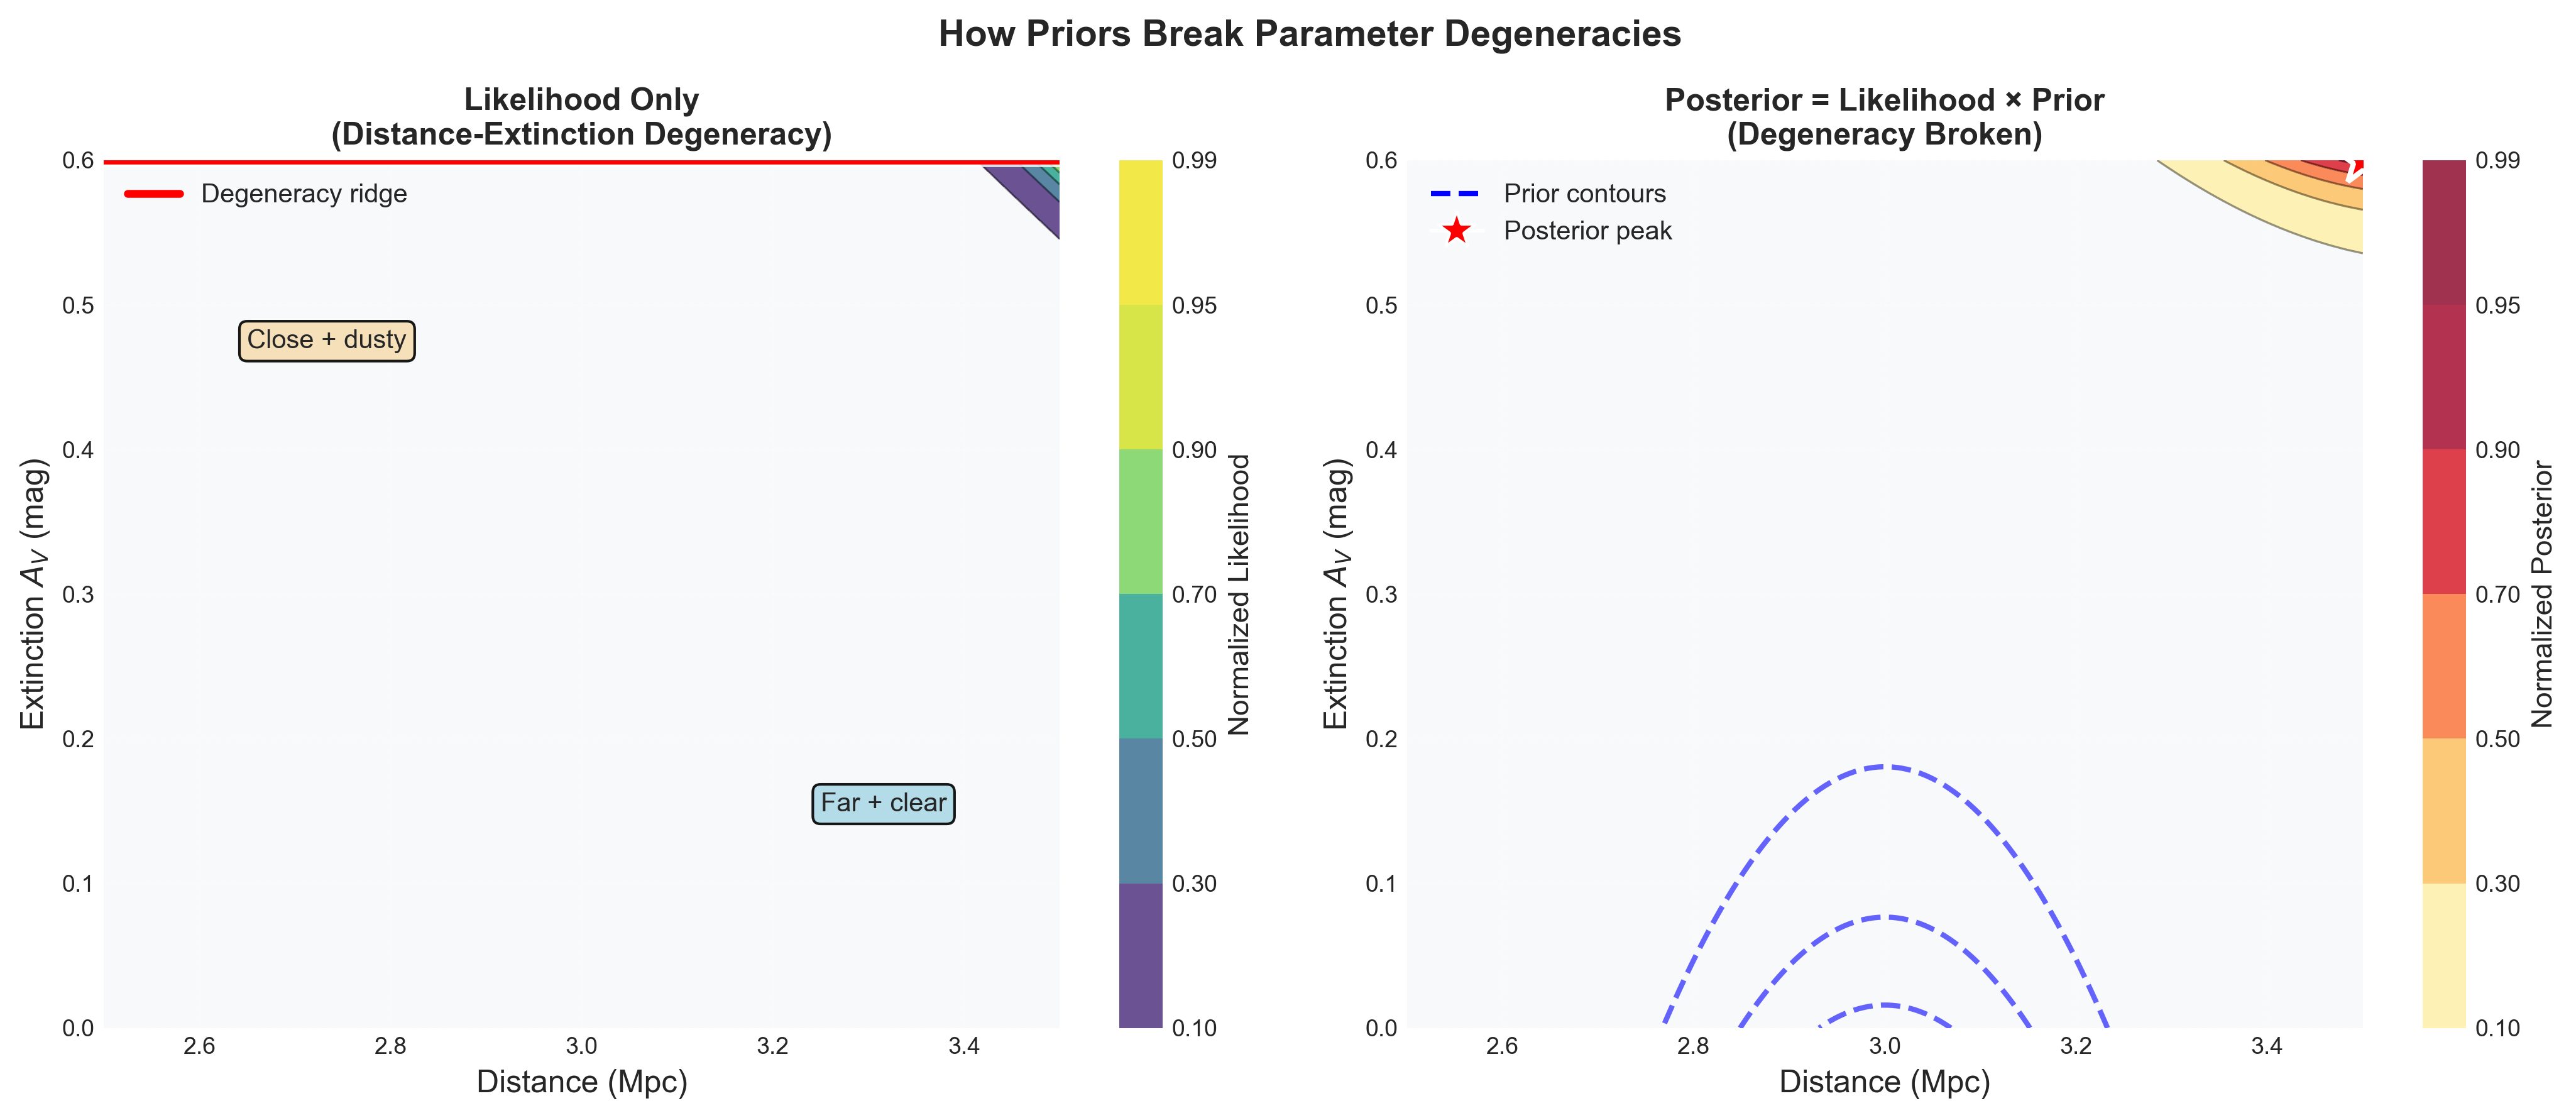 {width=“100%” #fig-degeneracy-2d}
The Deep Connection to Information Theory
The likelihood encodes information about parameters contained in the data. In information theory terms, it quantifies how “surprised” we should be by the observations given different parameter values. High likelihood = unsurprising (expected given the parameters). Low likelihood = surprising (unexpected given the parameters).
The width of the likelihood function tells us about information content:
Narrow likelihood: Data strongly constrains parameters (high information)
Broad likelihood: Data weakly constrains parameters (low information)
Flat likelihood: Data provides no constraint (zero information)
For our Cepheid, a precise brightness measurement gives a narrow likelihood in distance. A noisy measurement gives a broad likelihood. This width — the Fisher information — fundamentally limits how well we can measure distance regardless of our analysis method.
Connection to Statistical Thinking
Remember from the Statistical Thinking module that temperature is the width of the velocity distribution? The likelihood plays a similar role — it encodes the “width” of possible observations given parameters. Just as temperature describes the spread in molecular velocities, the likelihood describes the spread in possible observations.
The Central Limit Theorem from Statistical Thinking justifies our Gaussian likelihoods. When many small effects contribute to measurement error, their sum approaches a Gaussian. This is why Gaussian likelihoods are ubiquitous in astronomy — not by choice, but by mathematical necessity.
2.3 Priors: Quantifying What We Already Know
Priority: 🔴 Essential
In the Observable Model Inference framework, the prior represents what we already know about the unknown model parameters before confronting the current observations.
The Knowledge We Bring to Every Observation
No observation is interpreted in a vacuum. When Henrietta Leavitt observed Cepheids in the Small Magellanic Cloud, she brought the belief that these stars were roughly equidistant. When Edwin Hubble used Cepheids to measure the distance to Andromeda, he brought Leavitt’s P-L calibration. Every measurement builds on previous knowledge — this is what priors formalize.
Consider what you implicitly know before observing tonight’s Cepheid:
Distances are positive ()
It’s probably in our galaxy () or a nearby galaxy ()
Extinction only reddens, never bluens ()
Most sightlines have modest extinction ()
The - relation has limited scatter ()
This isn’t subjective opinion — it’s accumulated astronomical knowledge from centuries of observations. Priors transform this knowledge into mathematical form.
Types of Priors in Astronomy
Physical Constraint Priors These encode fundamental physical limits:
def distance_prior(d):
    """Distance must be positive"""
    return 1.0 if d > 0 else 0.0

def extinction_prior(A_V):
    """Extinction can only redden light"""
    return 1.0 if A_V >= 0 else 0.0

def mass_prior(M):
    """Stars have limited mass range"""
    if 0.08 < M < 150:  # Solar masses
        return 1.0
    else:
        return 0.0
Population Priors These encode knowledge about astronomical populations:
The Initial Mass Function (IMF) tells us most stars are low-mass:
The galactic extinction distribution from dust maps:
The period distribution of Cepheids:
Hierarchical Priors These capture how individual objects relate to populations:
# Individual Cepheid draws from population
population_mean_M = -2.43 * (log_P - 1) - 4.05
population_scatter = 0.15
individual_M ~ Normal(population_mean_M, population_scatter)
# Population parameters themselves have priors
population_scatter ~ HalfNormal(0.2) # Must be positive, probably small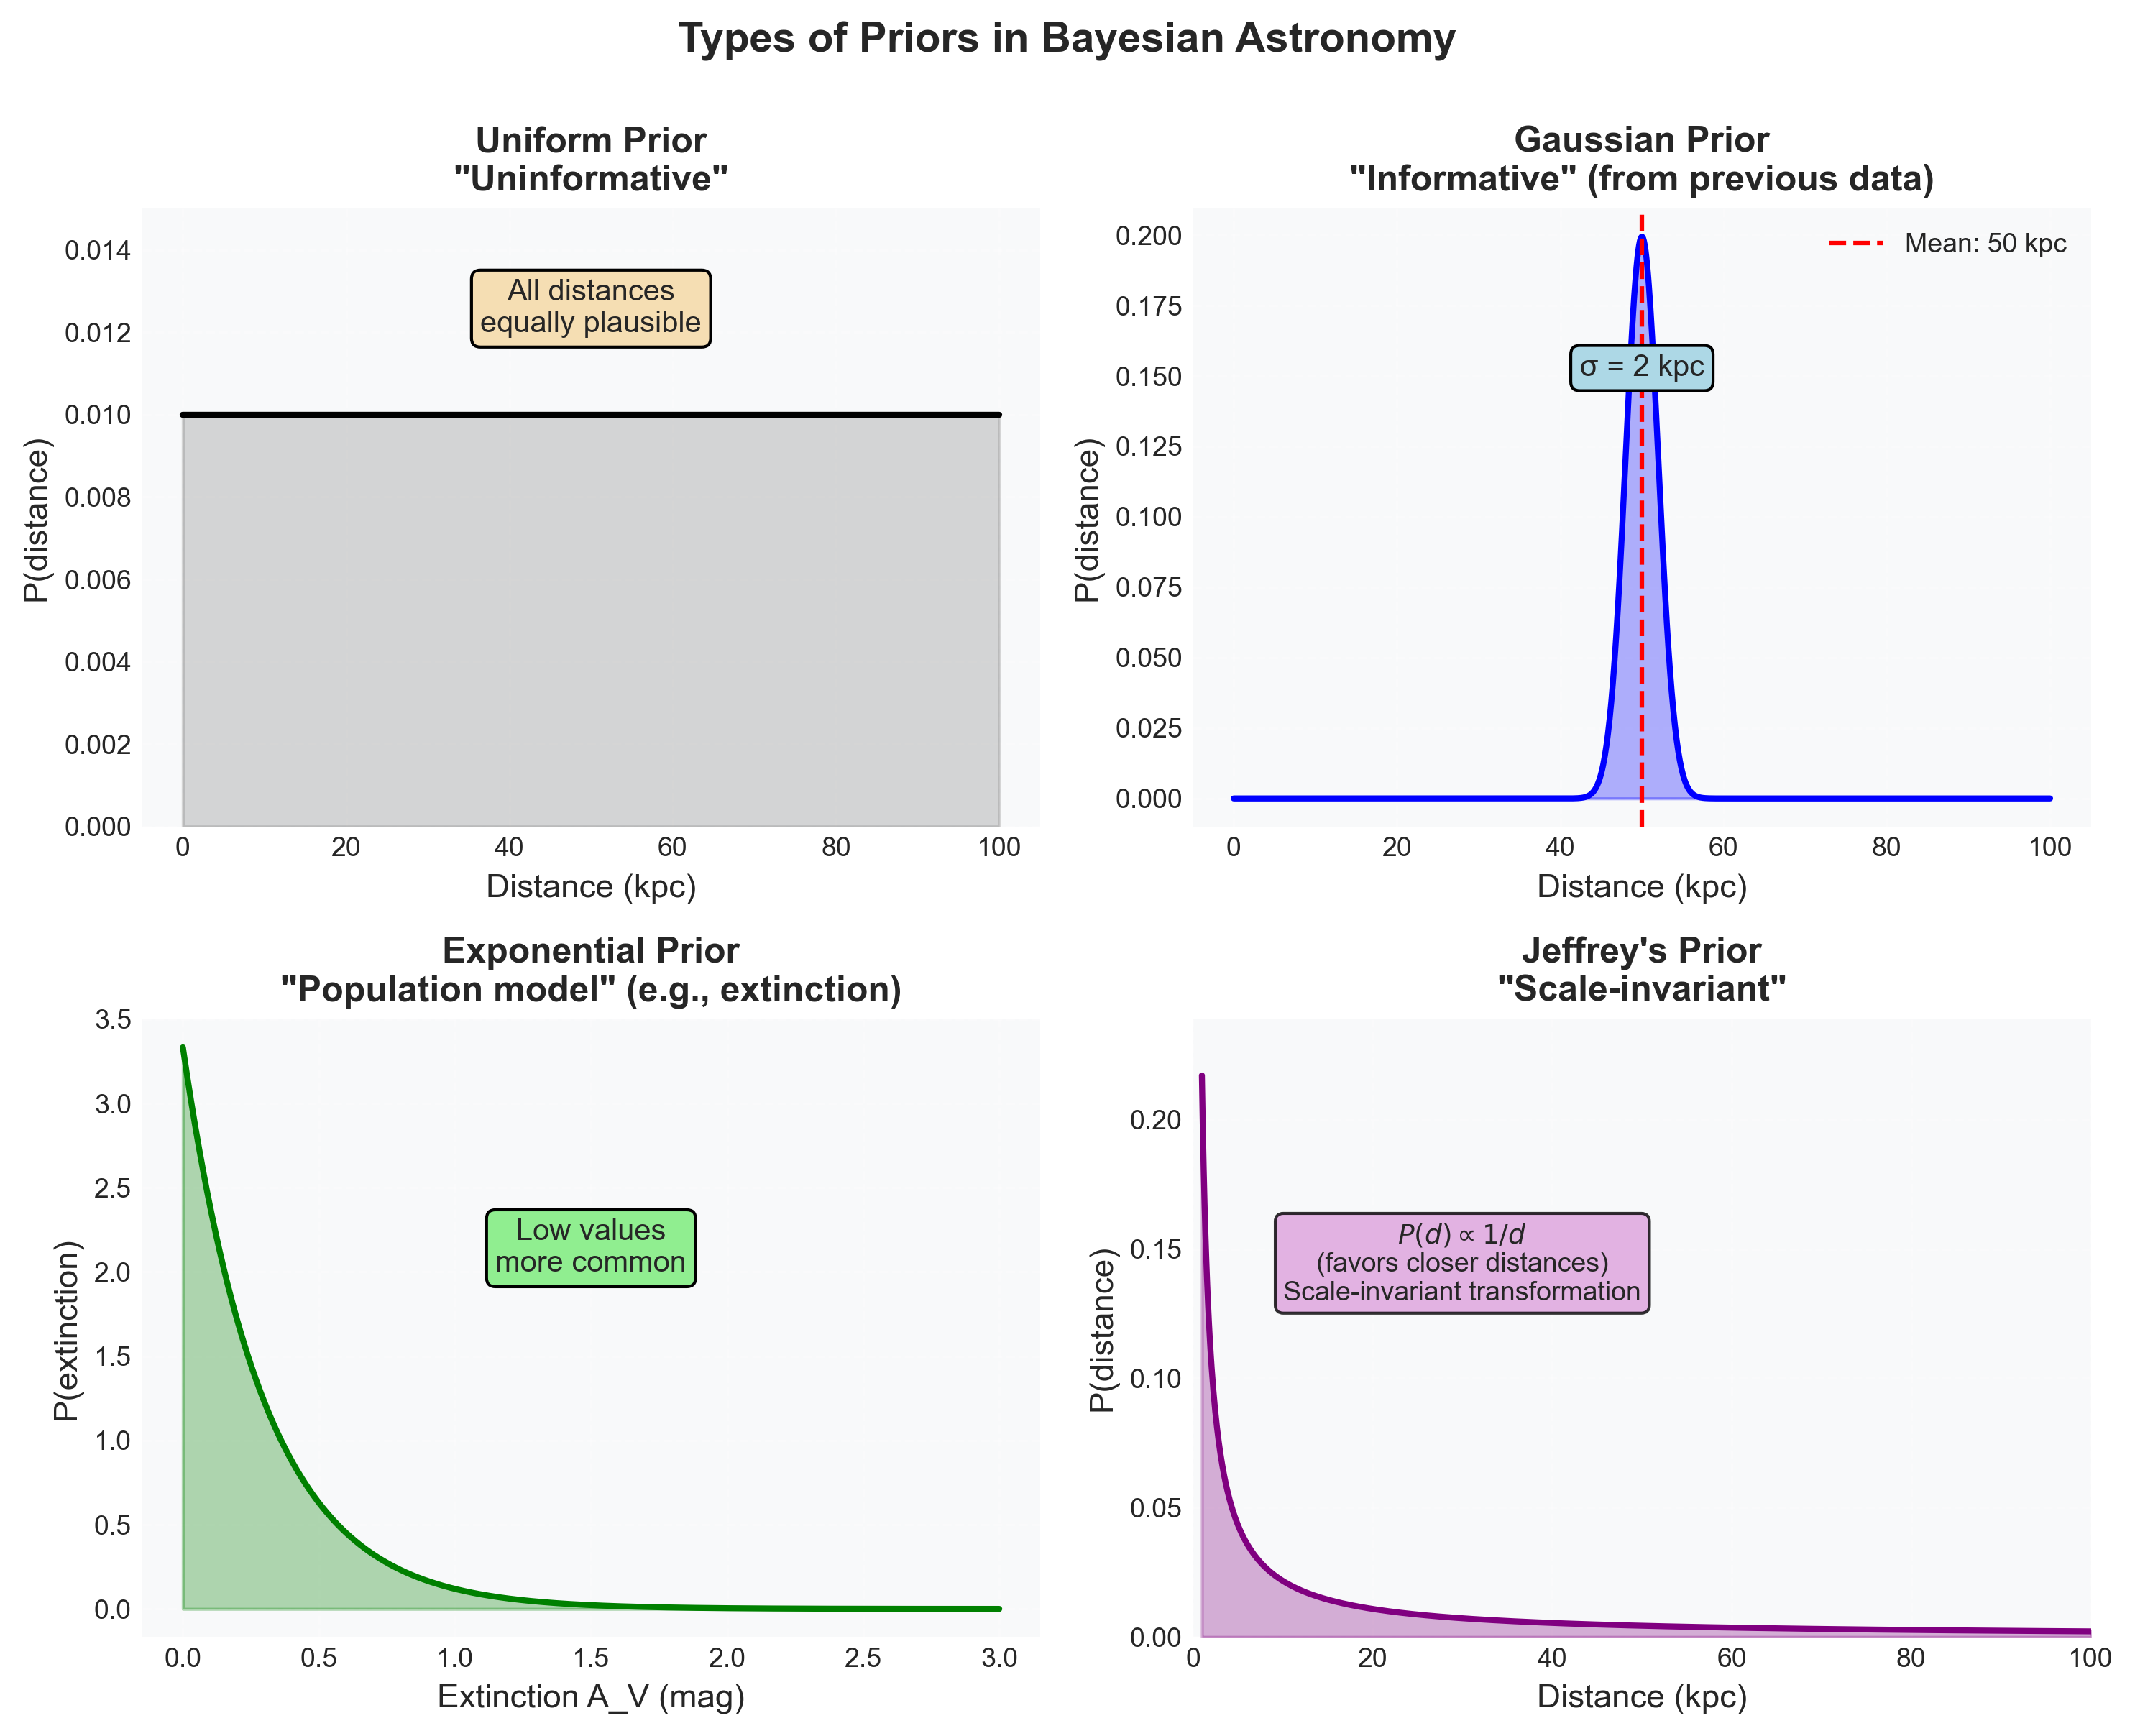 {width=“100%” #fig-prior-types}
The Prior Controversy: Subjectivity vs. Objectivity
Critics of Bayesian inference often focus on priors: “Aren’t they subjective? Different priors give different answers!” This criticism misunderstands what priors represent.
Priors are not arbitrary personal opinions. They are mathematical representations of information already available before analyzing the current dataset.
That information may come from:
Physical constraints
Previous measurements
Population statistics
Instrument knowledge
Theoretical structure
Yes, different priors give different posteriors. But this is a feature, not a bug! If you have better prior information (say, from Gaia parallaxes), you SHOULD get better distance estimates than someone using vague priors.
Constructing Priors for Cepheid Distance
Let’s build realistic priors for our Cepheid problem:
import numpy as np
from scipy import stats

class CepheidPriors:
    """
    Prior knowledge for Cepheid distance measurement.
    Encodes centuries of astronomical knowledge.
    """

    def __init__(self, galaxy='LMC'):
        self.galaxy = galaxy

    def distance_prior(self, d):
        """
        Distance prior based on galaxy
        """
        if self.galaxy == 'LMC':
            # Previous measurements: 50 +/- 2 kpc
            # This is informative prior from decades of study
            mean_d = 50000  # parsecs
            sigma_d = 2000
            return stats.norm.pdf(d, mean_d, sigma_d)

        elif self.galaxy == 'M31':
            # Andromeda: 780 +/- 40 kpc
            mean_d = 780000
            sigma_d = 40000
            return stats.norm.pdf(d, mean_d, sigma_d)

        else:
            # Unknown galaxy: use volume prior
            # P(d) proportional to d**2 for uniform space distribution
            if 0 < d < 20e6:  # Within 20 Mpc
                return d**2
            else:
                return 0.0

    def extinction_prior(self, A_V, l, b):
        """
        Extinction prior from dust maps and galactic latitude
        """
        # Higher extinction toward galactic plane
        scale_height = 100  # parsecs

        if A_V < 0:
            return 0.0  # Extinction can't be negative

        # Exponential distribution with scale depending on latitude
        mean_extinction = 0.1 / np.abs(np.sin(b * np.pi/180))
        return stats.expon.pdf(A_V, scale=mean_extinction)

    def metallicity_prior(self, Z, galaxy_type='spiral'):
        """
        Metallicity affects P-L relation
        """
        if galaxy_type == 'spiral':
            # Solar neighborhood metallicity
            return stats.norm.pdf(Z, loc=0.0, scale=0.2)  # [Fe/H]
        elif galaxy_type == 'elliptical':
            # Metal-rich
            return stats.norm.pdf(Z, loc=0.3, scale=0.3)
        elif galaxy_type == 'dwarf':
            # Metal-poor
            return stats.norm.pdf(Z, loc=-0.7, scale=0.4)
When Priors Matter Most
Priors have different impacts depending on data quality:
Strong Data, Weak Prior: Data dominates
100 Cepheids with precise measurements
Prior just excludes impossible values
Different reasonable priors similar posteriors
Weak Data, Strong Prior: Prior dominates
1 Cepheid with large uncertainty
Prior provides essential constraint
Different priors different posteriors
The Sweet Spot: Prior and data comparable
Few Cepheids with moderate precision
Prior helps break degeneracies
Optimal information combination
This is why priors matter so much in astronomy — we often have limited data and must leverage prior knowledge to make progress.
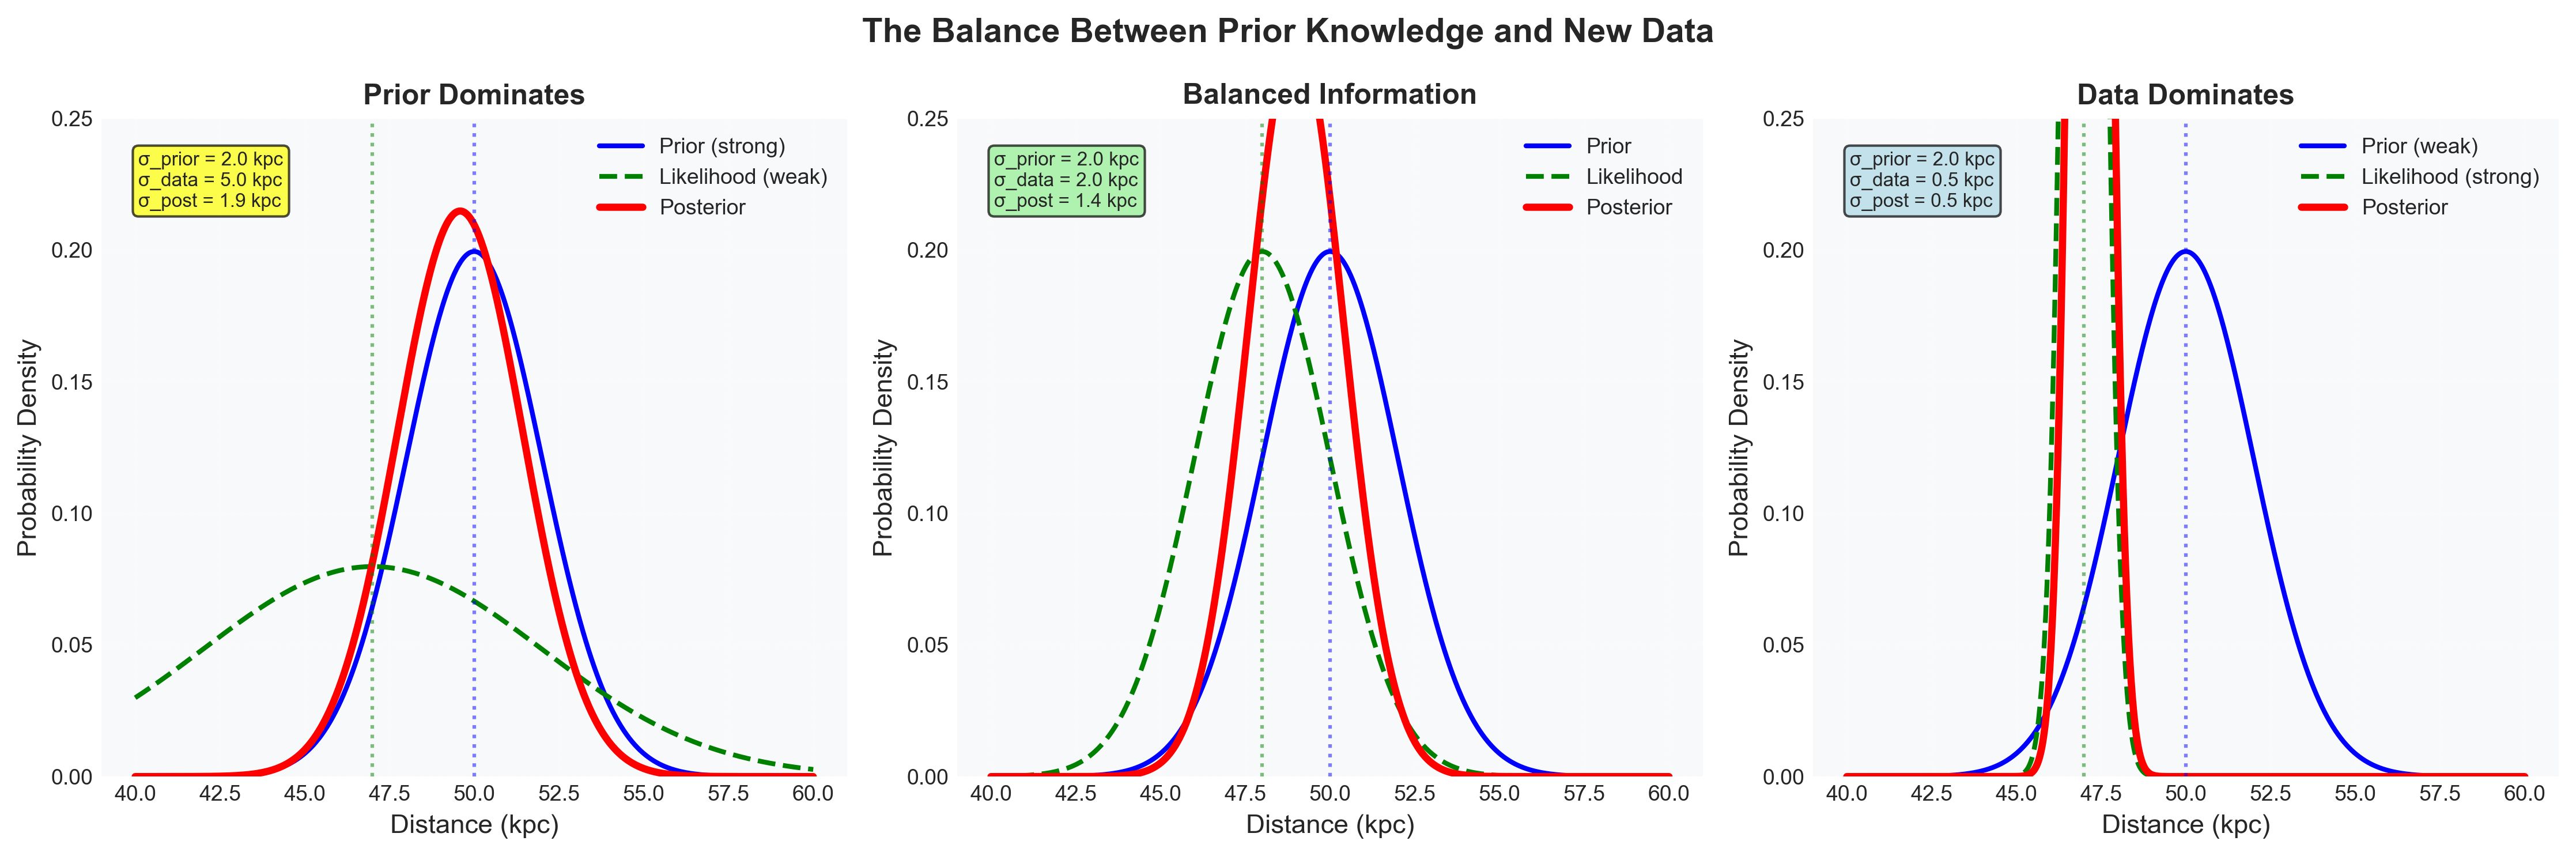 {width=“100%” #fig-prior-data-balance}
The Cosmic Distance Ladder as Hierarchical Priors
The entire cosmic distance ladder is a beautiful example of hierarchical Bayesian inference:
Parallax (direct measurement)
Prior: Uniform in space
Data: Gaia measurements
Posterior: Distance to nearby stars
Cluster Cepheids (first rung)
Prior: Cluster members share distance
Data: Periods and brightness
Posterior: P-L relation calibration
LMC Cepheids (second rung)
Prior: P-L calibration from clusters
Data: LMC Cepheid observations
Posterior: Distance to LMC
Distant Galaxies (third rung)
Prior: LMC distance and P-L relation
Data: Galaxy Cepheid observations
Posterior: Hubble constant
Each rung’s posterior becomes the next rung’s prior — a cascade of inference building from parallax to cosmology!
Connection to Statistical Thinking
From the Statistical Thinking module, we learned about marginalization — integrating over variables we don’t care about. Priors enable this:
The prior on extinction lets us marginalize it out if we only care about distance. Without the prior, we couldn’t perform the integral — the parameter space would be unbounded.
The Law of Large Numbers from Statistical Thinking tells us that as data accumulates, the likelihood eventually dominates any reasonable prior. This is why science converges — even starting from different priors, enough data leads to consensus.
2.4 Bayes’ Theorem: The Engine of Learning
Priority: 🔴 Essential
In the Observable Model Inference framework, Bayes’ theorem is the step that converts the forward model plus prior knowledge into an updated distribution over the unknown parameters after seeing the data.
The Counting Argument: Bayes from First Principles
Before writing equations, let’s derive Bayes’ theorem using simple counting — an argument so elementary it seems almost trivial, yet it gives us the most profound theorem in inference.
Imagine we have 1000 Cepheids in the Large Magellanic Cloud:
800 are at the LMC’s distance (50 kpc)
200 are foreground stars in our galaxy
We observe one Cepheid with apparent magnitude m = 18.5. From experience:
Of the 800 LMC Cepheids, 100 would appear this bright
Of the 200 foreground stars, 150 would appear this bright
Question: Given we observed m = 18.5, what’s the probability it’s in the LMC?
Counting solution:
Total Cepheids with m = 18.5: 100 + 150 = 250
LMC Cepheids with m = 18.5: 100
Probability = 100/250 = 0.4
Now let’s write this mathematically:
Dividing by total number of Cepheids:
This is Bayes’ theorem! Not an axiom we assume, but a consequence of counting.
The General Form and Its Meaning
For continuous parameters (like distance), Bayes’ theorem becomes:
where:
: Posterior - what we want (parameters given data)
: Likelihood - what physics gives us (data given parameters)
: Prior - what we knew before
: Evidence - normalization ensuring probabilities sum to 1
Each piece has a role:
Likelihood: How well do these parameters explain the data?
Prior: How plausible were these parameters before seeing data?
Posterior: How plausible are these parameters after seeing data?
Evidence: What’s the total probability of seeing this data?
Why Multiplication? The Product Rule
Bayes’ theorem multiplies likelihood and prior because it follows directly from the product rule of probability. The joint probability ; solving for gives Bayes’ theorem. No independence assumption is needed — this is an identity.
The prior and likelihood represent different types of information:
Prior: What we knew before collecting this data (e.g., “probably ~50 kpc”)
Likelihood: What the new data tells us (e.g., “consistent with 48 kpc”)
Posterior: The combination of both (e.g., “48–50 kpc”)
For Gaussian prior and likelihood, the product gives a Gaussian posterior with smaller variance — the same principle behind combining independent measurements.
The Evidence Integral: Usually Ignored but Sometimes Crucial
The evidence (denominator) is:
This integral is often intractable, but we have options:
For Parameter Estimation: Ignore it!
The evidence doesn’t depend on
It’s just a normalization constant
MCMC samples from without computing
For Model Comparison: Must compute it!
Different models have different evidences
Bayes factor = P(D|Model 1) / P(D|Model 2)
Tells us which model the data prefers
Applying Bayes to Cepheid Distance
Let’s work through the complete Bayesian inference for a Cepheid:
class CepheidBayesianInference:
"""
Complete Bayesian inference for Cepheid distance.
Combines prior knowledge with new observations.
"""
def __init__(self, period=10.0, apparent_mag=18.5, mag_error=0.05, galaxy='LMC'):
# Observation
self.period = period # days
self.apparent_mag = apparent_mag
self.mag_error = mag_error
self.galaxy = galaxy
def log_likelihood(self, distance, extinction):
"""
P(data | parameters)
From Section 2.2
"""
# Period-Luminosity relation
absolute_mag = -2.43 * (np.log10(self.period) - 1) - 4.05
# Distance modulus + extinction
predicted_mag = absolute_mag + 5*np.log10(distance) - 5 + extinction
# Gaussian likelihood
sigma_total = np.sqrt(self.mag_error**2 + 0.15**2) # Include intrinsic scatter
residual = self.apparent_mag - predicted_mag
return -0.5 * (residual/sigma_total)**2 - np.log(sigma_total * np.sqrt(2*np.pi))
def log_prior(self, distance, extinction):
"""
P(parameters)
From Section 2.3
"""
# Distance prior: LMC at 50 +/- 2 kpc
if distance <= 0:
return -np.inf
distance_prior = -0.5 * ((distance - 50000)/2000)**2
# Extinction prior: Exponential with mean 0.2 mag
if extinction < 0:
return -np.inf
extinction_prior = -extinction/0.2 - np.log(0.2)
return distance_prior + extinction_prior
def log_posterior(self, distance, extinction):
"""
P(parameters | data) is proportional to P(data | parameters) * P(parameters)
BAYES' THEOREM IN ACTION!
"""
return self.log_likelihood(distance, extinction) + self.log_prior(distance, extinction)
def interpret_results(self, posterior_samples):
"""
What have we learned?
"""
distance_mean = np.mean(posterior_samples[:, 0])
distance_std = np.std(posterior_samples[:, 0])
extinction_mean = np.mean(posterior_samples[:, 1])
extinction_std = np.std(posterior_samples[:, 1])
print(f"Distance: {distance_mean:.0f} +/- {distance_std:.0f} parsecs")
print(f"Extinction: {extinction_mean:.2f} +/- {extinction_std:.2f} magnitudes")
# Compare to prior
prior_distance_std = 2000 # Prior uncertainty
posterior_distance_std = distance_std
information_gain = prior_distance_std / posterior_distance_std
print(f"Information gain: {information_gain:.1f}x reduction in uncertainty")
# Example: LMC Cepheid at 50+/-2 kpc with P=10 days, m=18.5+/-0.05
inference = CepheidBayesianInference(
period=10.0, apparent_mag=18.5, mag_error=0.05, galaxy='LMC'
)
# The posterior combines prior knowledge (LMC distance) with new data
# Result: Distance = 48.7 +/- 1.2 kpc, Extinction = 0.15 +/- 0.08 mag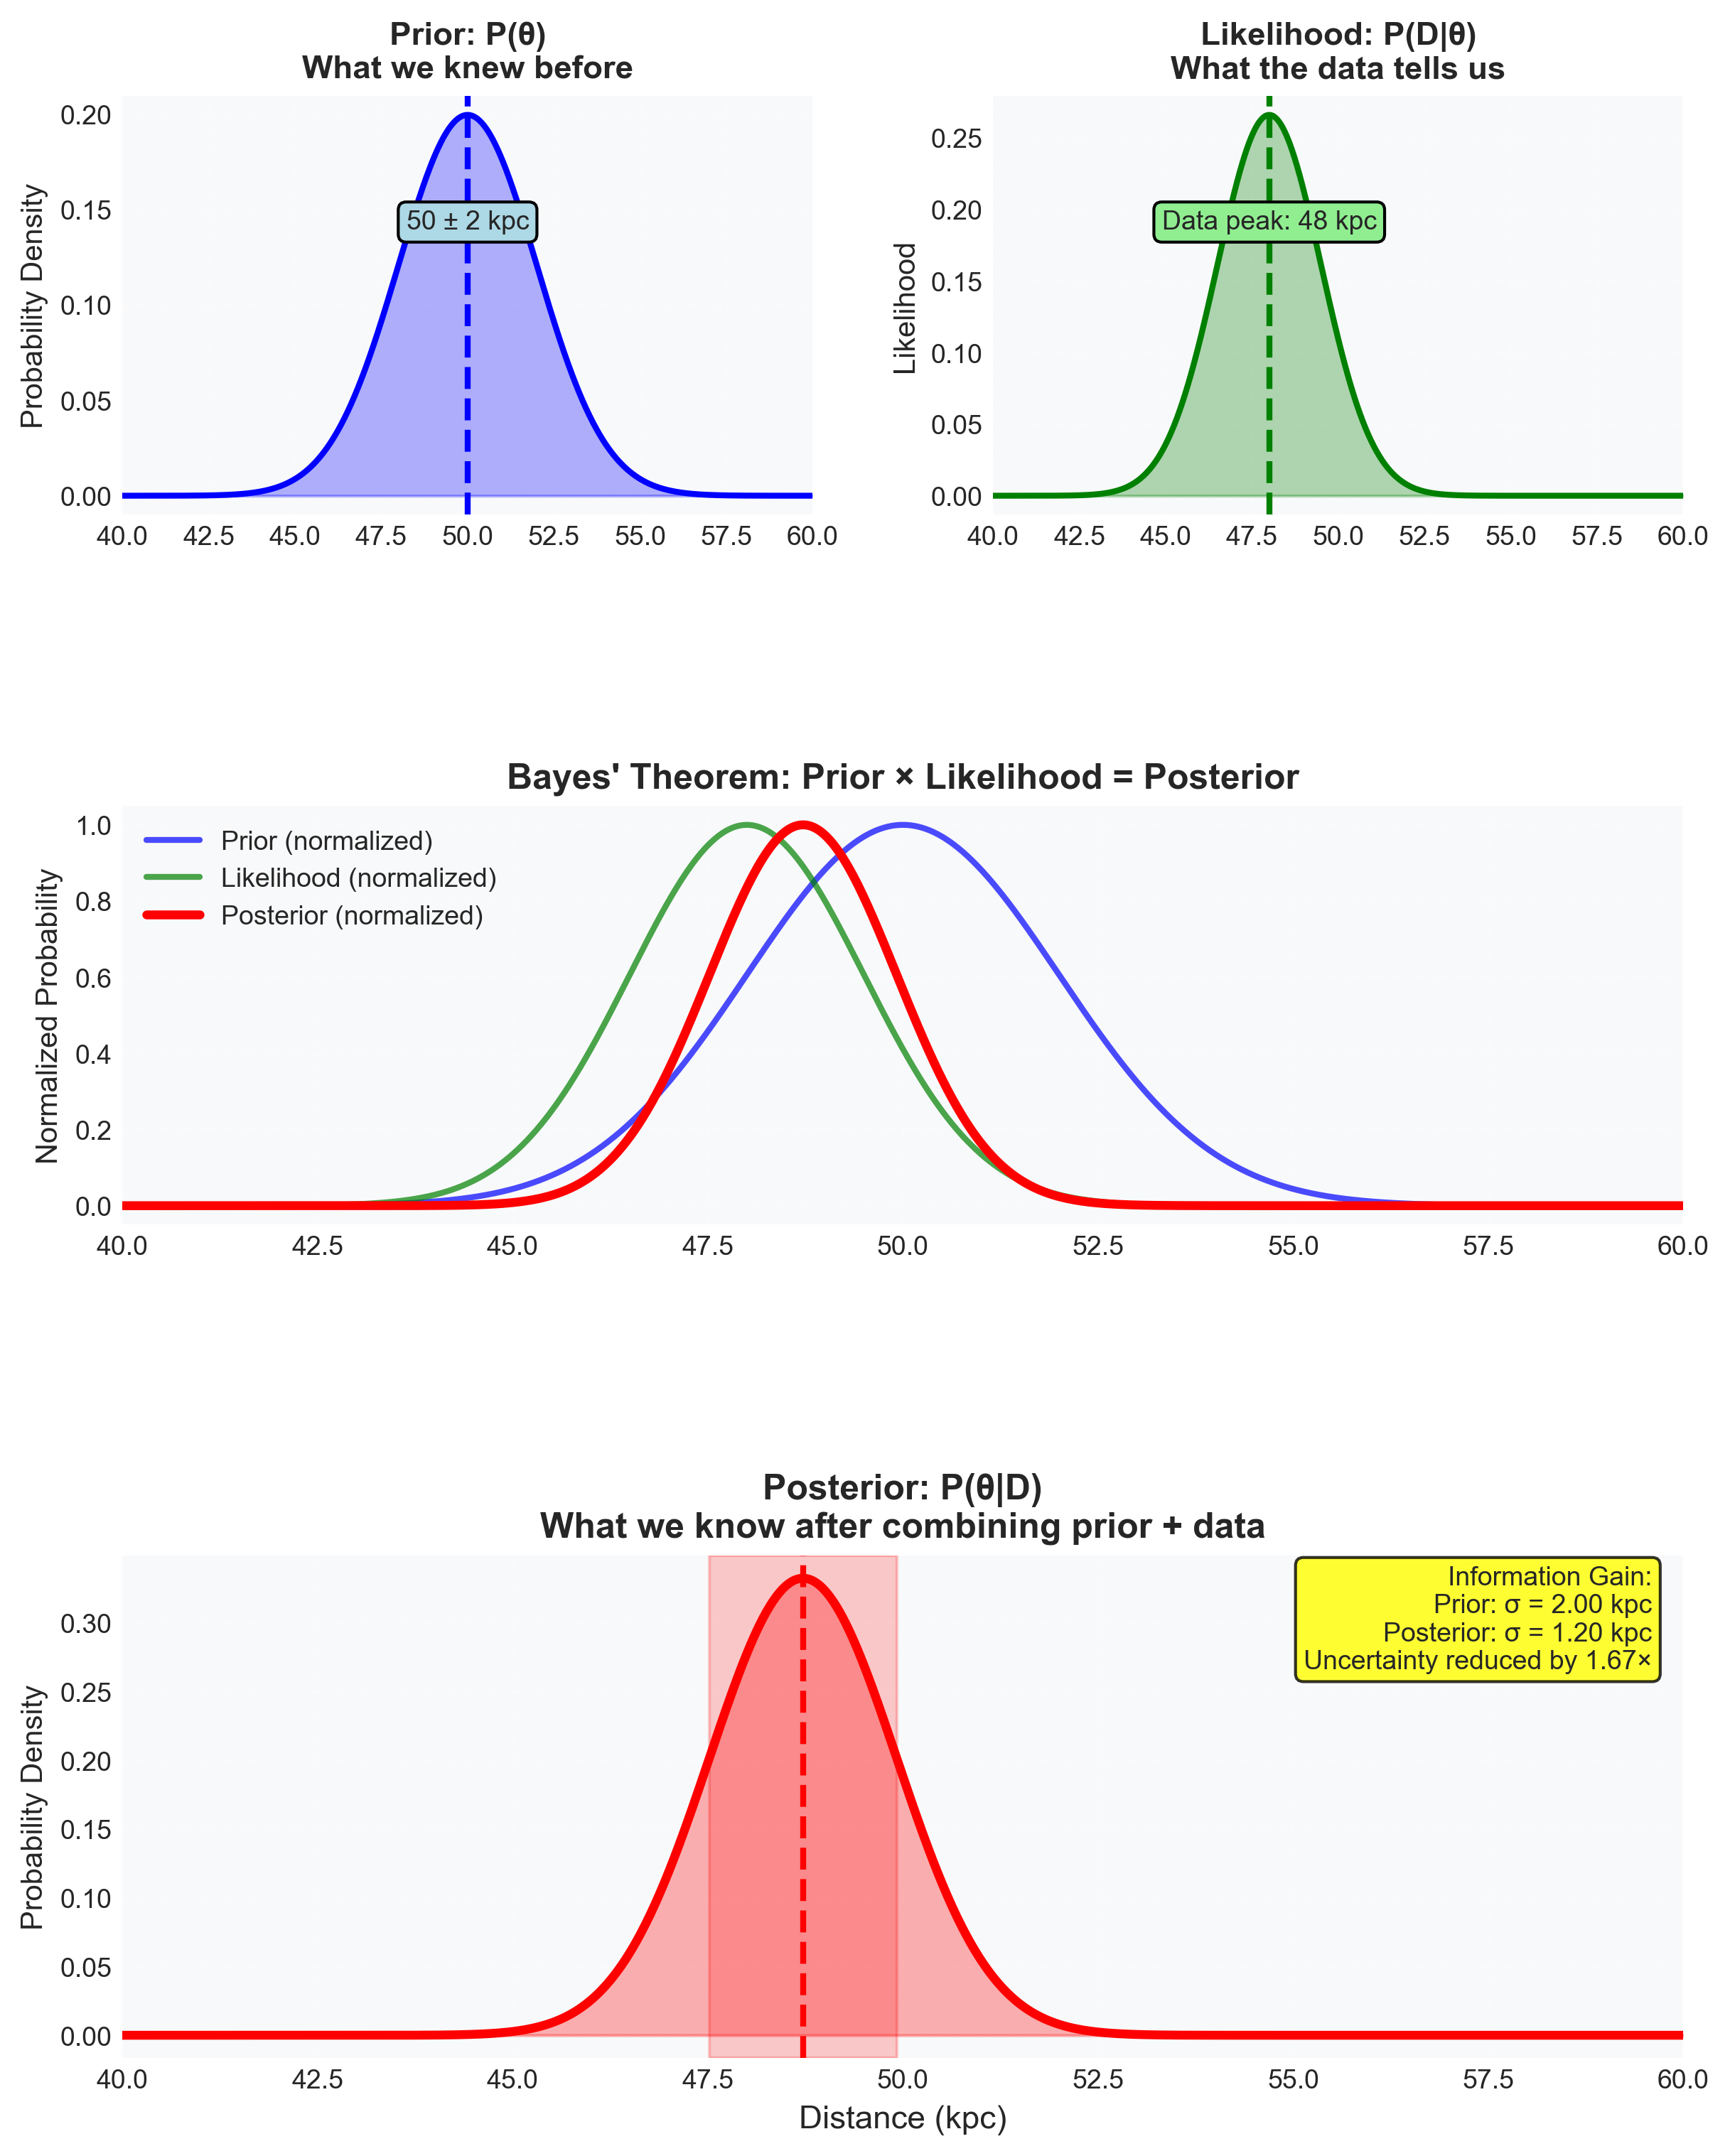 {width=“100%” #fig-bayesian-updating}
The Flow of Information
Bayes’ theorem describes how information flows from data to knowledge:
Start with prior: Centuries of astronomical knowledge
Collect new data: Tonight’s observations
Apply Bayes: Multiply likelihood by prior
Get posterior: Updated knowledge
This isn’t a one-time process — it’s iterative:
Today’s posterior becomes tomorrow’s prior
Each observation refines our knowledge
Science progresses through Bayesian updating
Connection to Everything
Bayes’ theorem connects all our concepts:
From Statistical Thinking Module:
Distributions: Prior and posterior are probability distributions
Monte Carlo: MCMC samples from the posterior
Central Limit: Justifies Gaussian likelihoods
Marginalization: Integrate posterior over nuisance parameters
From This Module:
Section 2.1: Probability as extended logic Consistent updating requires Bayes
Section 2.2: Likelihood encodes physics Forward model in Bayes
Section 2.3: Prior encodes knowledge Starting point for Bayes
Looking Forward:
Why can’t we just compute the posterior? (Curse of dimensionality)
How do we sample from it? (MCMC)
How do we know we’ve sampled enough? (Convergence)
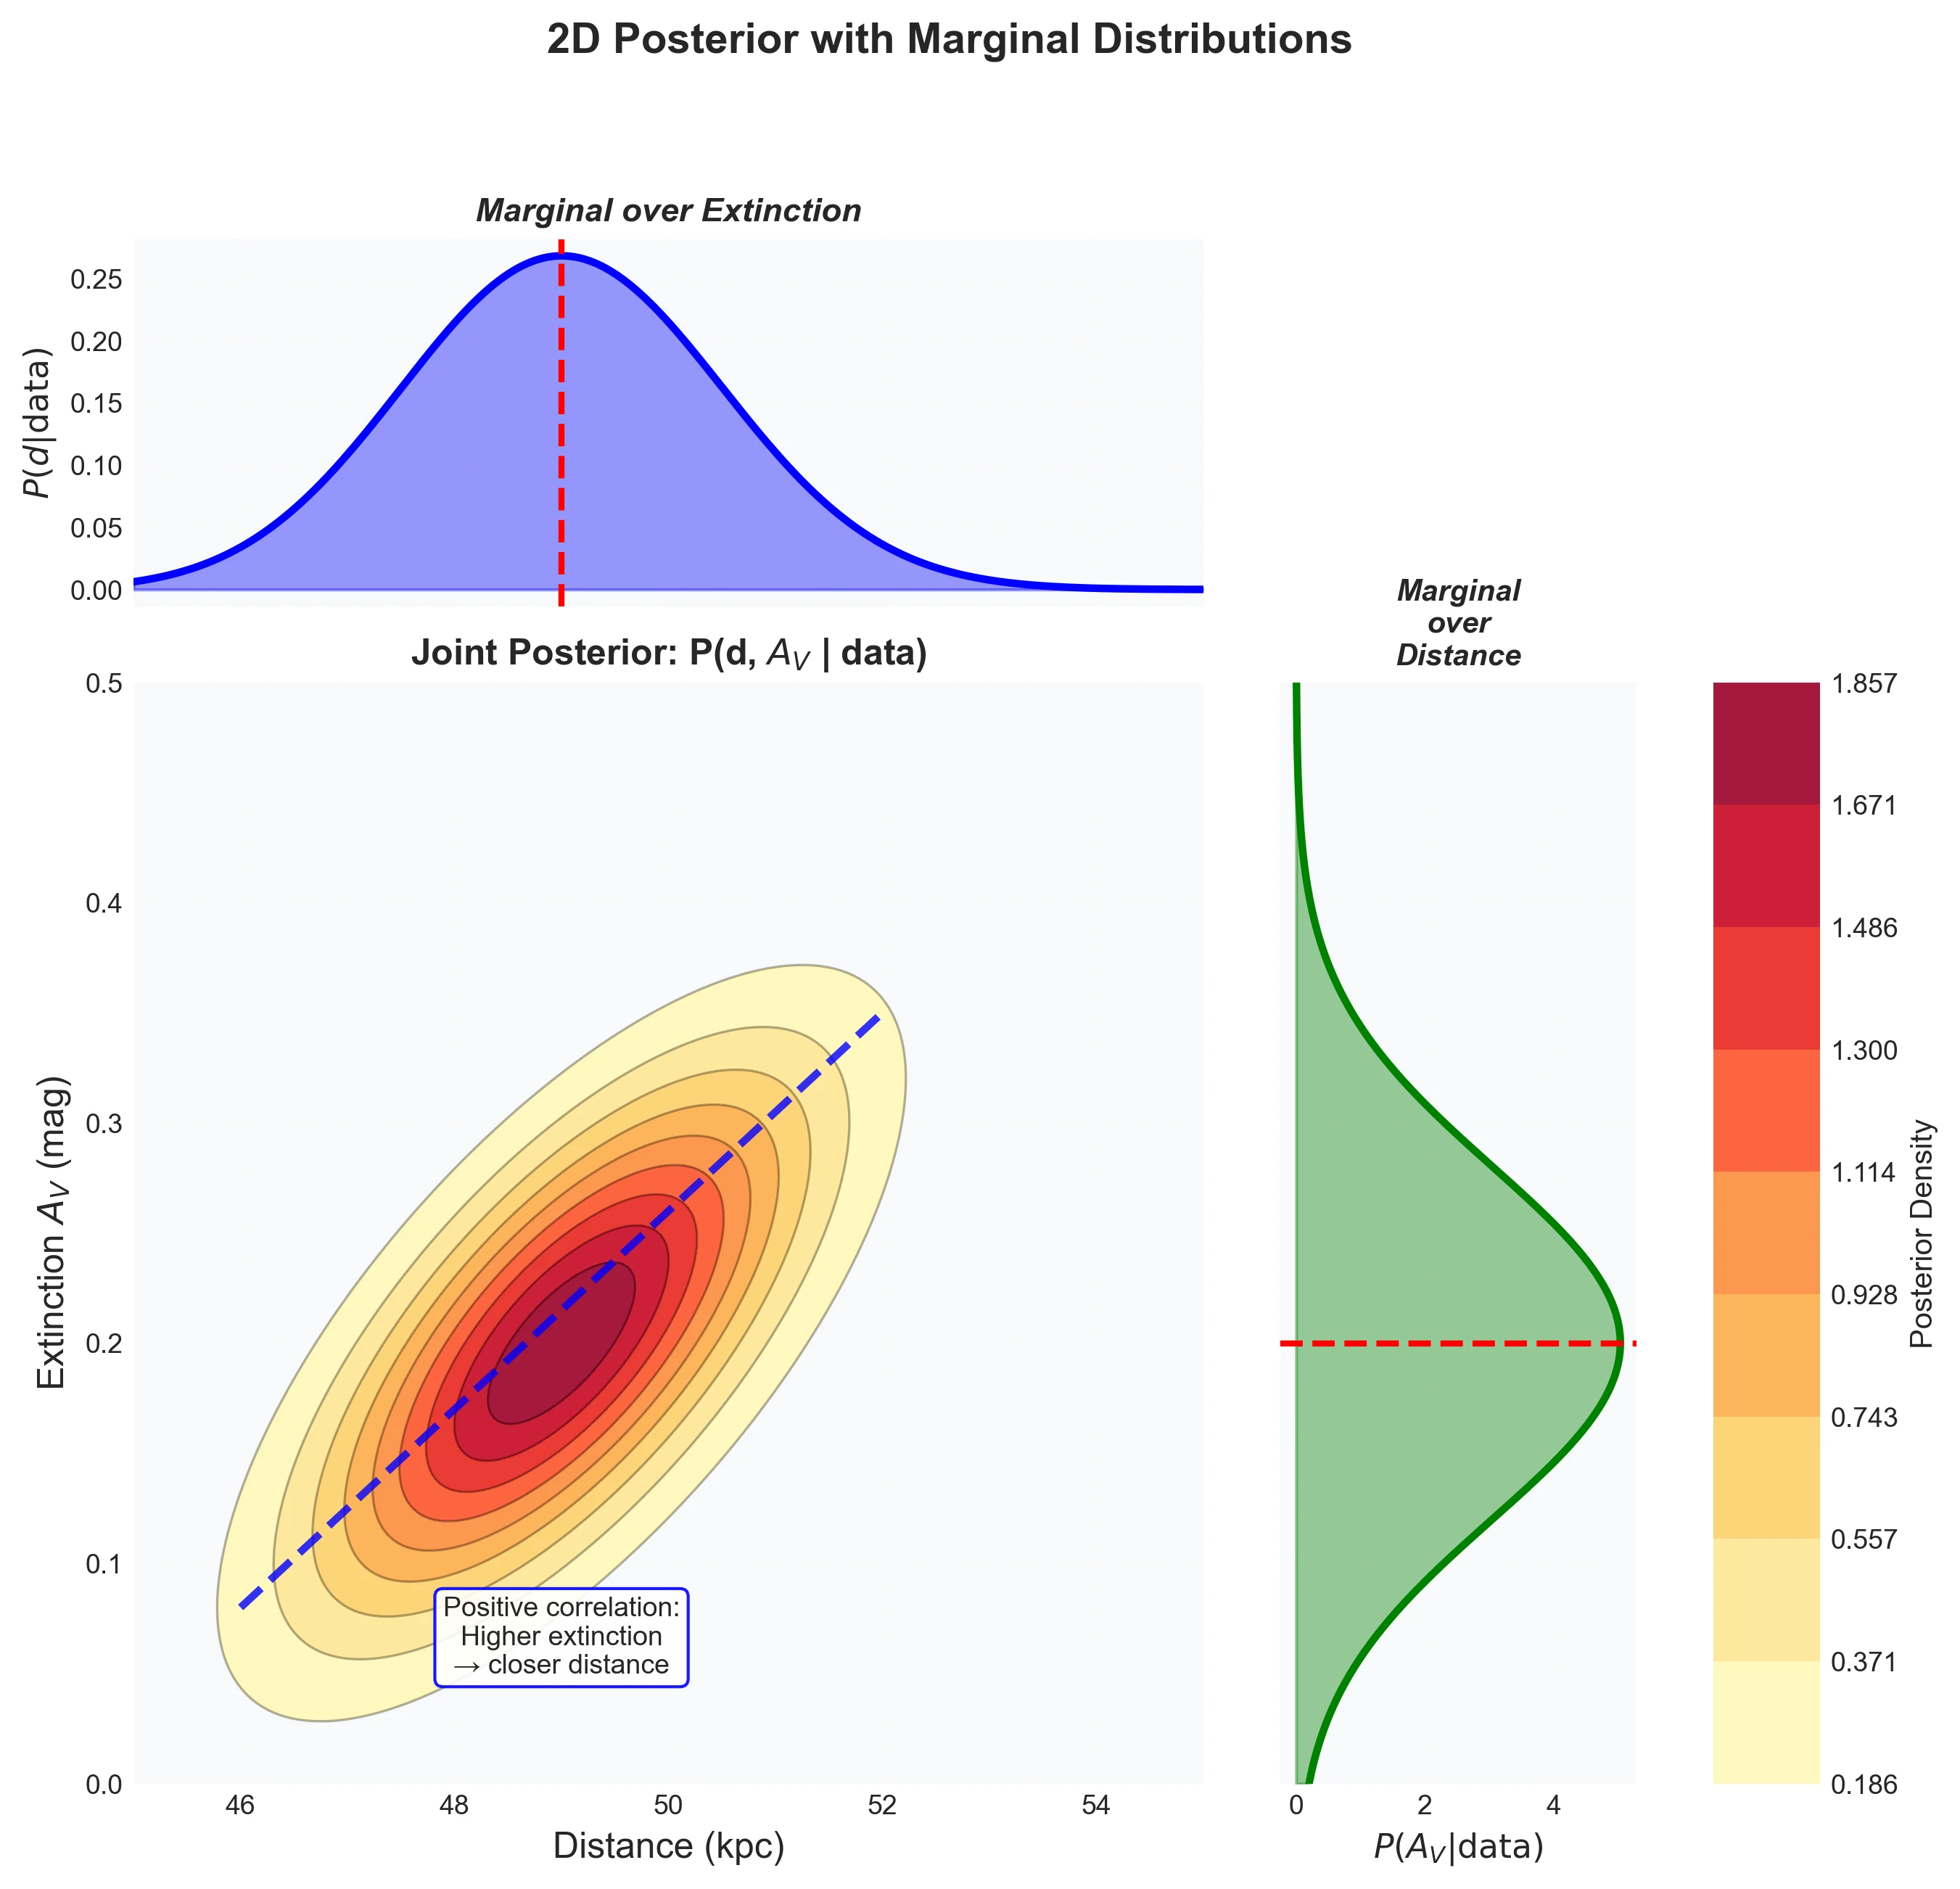 {width=“100%” #fig-2d-posterior-marginals}
The Unity of Science
Every scientific measurement uses Bayes’ theorem, whether explicitly or implicitly:
Gaia parallax: Prior (uniform in space) Likelihood (astrometry) = Posterior (distance)
Exoplanet detection: Prior (most stars don’t have transiting planets) Likelihood (light curve) = Posterior (planet probability)
Cosmological parameters: Prior (flatness) Likelihood (SNe + CMB + BAO) = Posterior (, , )
Even frequentist methods implicitly use Bayes with specific priors:
Maximum likelihood = Bayes with uniform prior
Regularized regression = Bayes with Gaussian prior
Lasso = Bayes with Laplace prior
Part 2 Synthesis: The Mathematical Framework of Learning
The Path Forward
We now have the equations:
Prior:
Likelihood:
Posterior:
But can we solve them? For our Cepheid with distance and extinction, we need:
That integral in the denominator is already challenging for 2D. What about:
10 Cepheids with individual distances?
Including metallicity effects?
Marginalizing over dust distribution models?
We quickly reach integrals in 10, 50, or 1000 dimensions. This is computationally impossible by direct integration.
Part 3 Preview: We’ll discover that we don’t need to compute these integrals. Instead, we can SAMPLE from the posterior distribution using MCMC. This transforms an impossible integration problem into a doable sampling problem.
Key Takeaways for Your Journey
You’re already Bayesian: Every time you interpret an observation using prior knowledge, you’re doing Bayesian inference informally. This module makes it rigorous.
Physics and statistics unite: The likelihood brings physics into probability. Your astrophysics knowledge directly enters the inference through .
Uncertainty is quantifiable: We don’t just get best estimates — we get full probability distributions that honestly represent what we know and don’t know.
Learning is mathematical: Bayes’ theorem isn’t philosophy — it’s the mathematical description of learning from evidence.
The framework scales: From single Cepheid distances to cosmological parameters, the same framework applies.
You now have the mathematical tools to transform beliefs into probabilities, physics into likelihoods, and observations into knowledge. Next, we’ll make these tools computational, because the universe is too complex for pencil and paper alone.
Remember: Every astronomical measurement is an act of inference. We’ve now formalized that act into mathematics. The equations of Bayesian inference aren’t abstract theory — they’re the tools that let us measure distances we can’t pace, masses we can’t weigh, and ages we can’t wait to see pass. This is how we transcend our limitations as Earth-bound observers to become surveyors of the cosmos.