Part 3: Taylor Series, Error Order, and Derivative Methods
Module 1: Foundations of Discrete Computing | COMP 521
Part 1 showed how finite differences arise from Taylor series. Part 2 showed why floating-point arithmetic limits accuracy. Part 3 puts those ideas together: verify the theory numerically, build custom formulas on purpose, and decide when finite differences are the wrong tool.
Learning Objectives
By the end of this section, you will be able to:
Verify Taylor-series error predictions with numerical experiments and explain where round-off changes the observed trend.
Design a custom finite-difference stencil by matching and canceling Taylor coefficients.
Measure convergence order from computed data and use that measurement to check whether a method is behaving as expected.
Diagnose situations in which finite differences are a poor choice because of noise, cost, or scale.
Compare analytical derivatives, finite differences, and automatic differentiation when making coding decisions in scientific workflows.
Introduction: From Theory to Practice
Why this matters: numerical analysis becomes useful only when it changes what you do in code. This reading is where the theory from Module 1 turns into practical method design and scientific judgment.
The main question is no longer “what is a derivative?” The main question is “how should I compute a derivative in a real scientific workflow, and how do I know the result is trustworthy?” Taylor series gives the truncation model, floating-point arithmetic gives the round-off model, and numerical experiments tell us whether the implemented method actually behaves the way the theory predicts.
import math

import matplotlib.pyplot as plt
import numpy as np


def finite_diff_preview(f, x: float, h: float, method: str) -> float:
    """Return a minimal finite-difference preview for the opening experiment."""
    if method == "forward":
        return (float(f(x + h)) - float(f(x))) / h
    if method == "central":
        return (float(f(x + h)) - float(f(x - h))) / (2.0 * h)
    if method == "central4":
        return (
            -float(f(x + 2.0 * h))
            + 8.0 * float(f(x + h))
            - 8.0 * float(f(x - h))
            + float(f(x - 2.0 * h))
        ) / (12.0 * h)
    raise ValueError("method must be 'forward', 'central', or 'central4'.")


preview_function = np.sin
preview_x = 1.0
preview_true = float(np.cos(preview_x))
preview_h_values = np.logspace(-14, -1, 80)

fig, ax = plt.subplots(figsize=(7, 4.5))
for method_name in ["forward", "central", "central4"]:
    preview_errors = np.array(
        [
            abs(finite_diff_preview(preview_function, preview_x, h_value, method_name) - preview_true)
            for h_value in preview_h_values
        ]
    )
    ax.loglog(preview_h_values, preview_errors, label=method_name)

ax.set_xlabel("step size $h$")
ax.set_ylabel("absolute derivative error")
ax.set_title(r"Preview: error curves for $f(x)=\sin x$ at $x=1\,\mathrm{rad}$")
ax.legend()
ax.grid(True, which="both", alpha=0.25)
plt.show()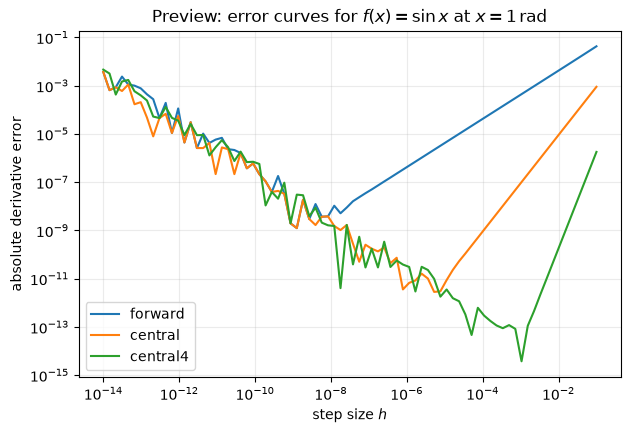
What to notice: the right-hand side of each curve shows truncation error, so the slope reveals the method order. The left-hand upturn appears when round-off begins to dominate, which is why making smaller eventually stops helping.
Interpretation: the preview answers the opening prediction in two stages. On the truncation-dominated side, higher-order methods win because their error falls faster with . On the round-off-dominated side, even a formally better method can lose if the subtraction becomes numerically brittle.
import math

import matplotlib.pyplot as plt
import numpy as np


def finite_diff(f, x: float, h: float, method: str = "central") -> float:
    """Return a finite-difference approximation to the first derivative."""
    if not np.isfinite(x):
        raise ValueError("x must be finite.")
    if not np.isfinite(h) or h <= 0.0:
        raise ValueError("h must be a positive finite value.")

    method_name = method.lower()
    if method_name == "forward":
        return (float(f(x + h)) - float(f(x))) / h
    if method_name == "central":
        return (float(f(x + h)) - float(f(x - h))) / (2.0 * h)
    if method_name == "central4":
        return (
            -float(f(x + 2.0 * h))
            + 8.0 * float(f(x + h))
            - 8.0 * float(f(x - h))
            + float(f(x - 2.0 * h))
        ) / (12.0 * h)
    raise ValueError("method must be 'forward', 'central', or 'central4'.")


def one_sided_second_derivative(f, x: float, h: float) -> float:
    """Return a one-sided second-derivative approximation at a boundary."""
    if not np.isfinite(x):
        raise ValueError("x must be finite.")
    if not np.isfinite(h) or h <= 0.0:
        raise ValueError("h must be a positive finite value.")
    return (float(f(x + 2.0 * h)) - 2.0 * float(f(x + h)) + float(f(x))) / (h**2)


def observed_order(errors_coarse: float, errors_fine: float) -> float:
    """Estimate method order from two errors at h and h/2."""
    if errors_coarse <= 0.0 or errors_fine <= 0.0:
        raise ValueError("errors must be strictly positive.")
    return math.log(errors_coarse / errors_fine, 2.0)
Build a finite polynomial before taking an infinite limit
Why this matters: a Taylor polynomial is a controlled local approximation. Writing an infinite sum with an equals sign makes a stronger claim, and we should know what justifies it before using it in a calculation.
Near , write and seek . Match the value and derivatives of at . At , the th derivative of the polynomial is , so
The constant matches the value, the linear term adds slope, and the quadratic term adds curvature. Matching at one point does not make two functions equal throughout an interval. Taylor’s theorem supplies the missing statement: if has continuous derivatives through order on the intervening interval,
for some between and . The equality includes the remainder. Dropping it gives an approximation. A known derivative bound gives
At fixed degree this controls the error as shrinks. At fixed , increasing the degree improves a general function’s approximation only if the remainder actually becomes smaller. An infinite Taylor series equals the function where as ; smoothness alone does not ensure that limit. For example, the smooth function for , with , has every derivative zero at 0. Its Taylor series there is zero, but the function is positive away from 0. Finite local error statements and equality to an infinite series are different claims.
Predict → Run → Explain: how much accuracy does another term buy?
For at , every derivative at the expansion point is 1. For , the next derivative is bounded by , so the remainder is at most . Predict which requires more terms for the same absolute error: or .
def exp_polynomial(h, degree):
    term = total = 1.0  # The constant term.
    for k in range(1, degree + 1):
        term = term * h / k  # Reuse h**(k-1)/(k-1)! to obtain h**k/k!.
        total += term
    return total

for h in (0.2, 1.0):
    for degree in (1, 2, 4, 8):
        estimate = exp_polynomial(h, degree)
        error = abs(np.exp(h) - estimate)
        bound = np.e * h**(degree+1) / math.factorial(degree+1)
        print(f"h={h}, degree={degree}: error={error:.3e}, bound={bound:.3e}")
h=0.2, degree=1: error=2.140e-02, bound=5.437e-02
h=0.2, degree=2: error=1.403e-03, bound=3.624e-03
h=0.2, degree=4: error=2.758e-06, bound=7.249e-06
h=0.2, degree=8: error=1.440e-12, bound=3.835e-12
h=1.0, degree=1: error=7.183e-01, bound=1.359e+00
h=1.0, degree=2: error=2.183e-01, bound=4.530e-01
h=1.0, degree=4: error=9.948e-03, bound=2.265e-02
h=1.0, degree=8: error=3.059e-06, bound=7.491e-06
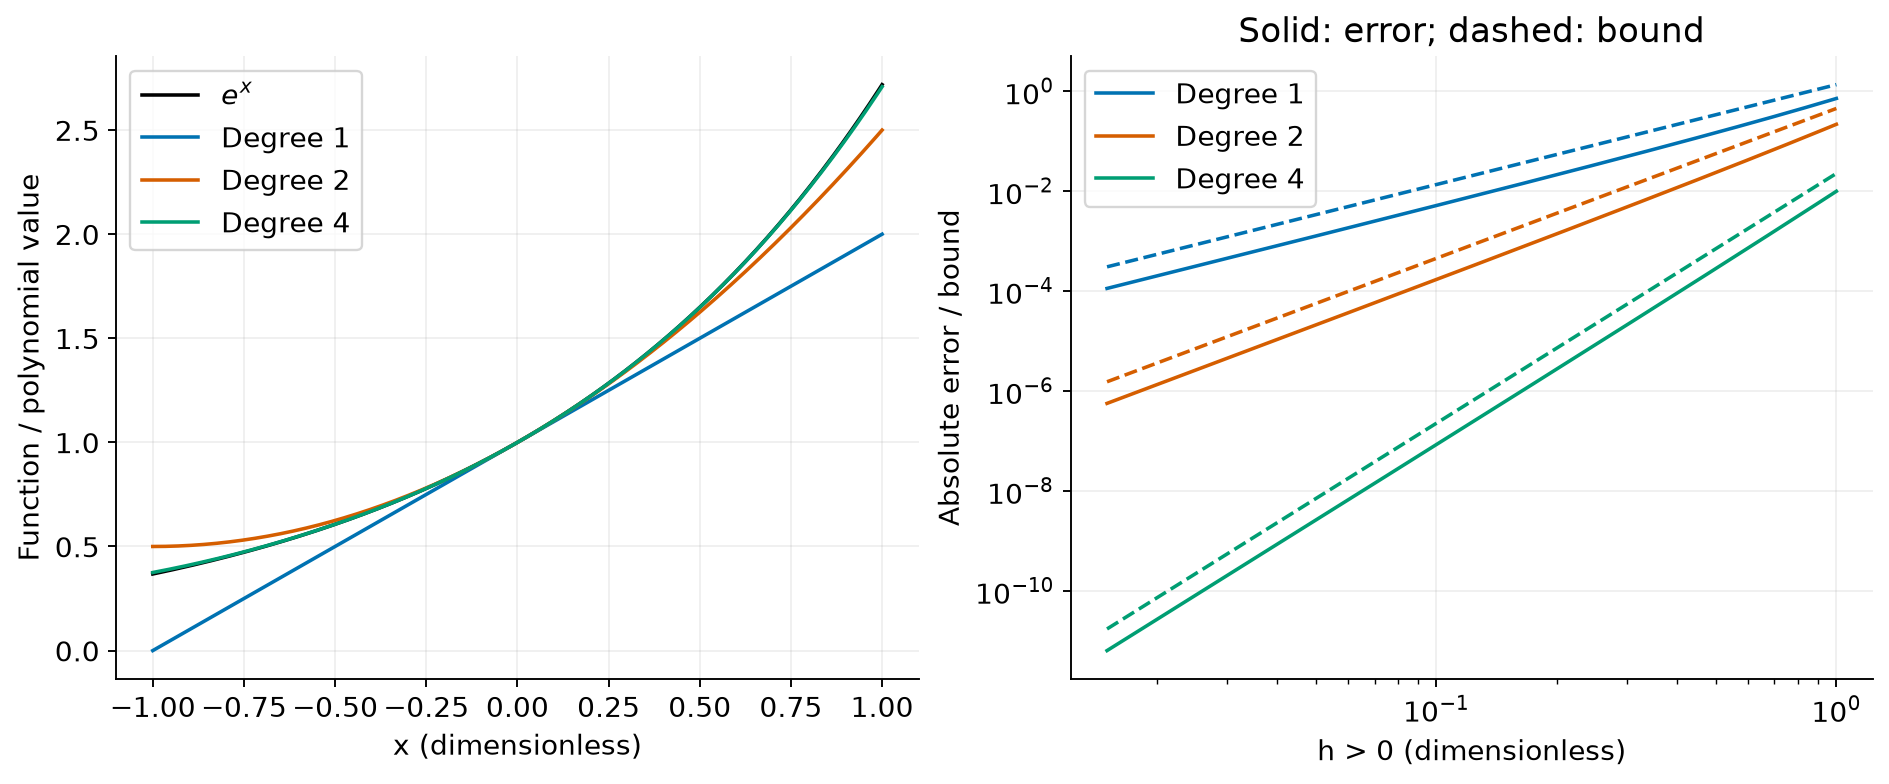
Left: matching value, slope, and curvature improves the local shape. Right: solid residual curves are compared with dashed remainder bounds for degrees 1, 2, and 4 on . The bound is an upper limit, not the observed error.
Every added term in this recurrence costs one multiplication, one division, and one addition. Degree 8 uses 24 scalar arithmetic operations after initialization, compared with 6 for degree 2. That is an operation count, not a timing benchmark, and general derivatives may be expensive to obtain. Choose a degree from an accuracy target and a justified bound, then check the computed error. More arithmetic can eventually add rounding without useful accuracy. Optimized library functions need not use this classroom algorithm.
Answer: distance and remainder matter together
needs more terms because the powers of do less to suppress the omitted terms. For this positive exponential example, adding terms reduces truncation error. The finite theorem gives a bound without requiring us to compute an infinite sum, and the residual plot checks whether the actual calculation stays below that bound.
Verifying Error Predictions
Why this matters: if a method does not show the predicted slope in a controlled test, you should not trust it in a harder scientific problem.
For this experiment, the analytical information is known exactly. We choose and evaluate the derivative at , so the true derivative is and the exact value is .
What is approximated numerically is the derivative itself, using forward, central, and fourth-order central finite-difference formulas evaluated over a range of step sizes.
What the theory predicts is not just “one method is better.” It predicts specific slopes on a log-log plot, specific convergence ratios under halving, and a specific failure mode when round-off takes over.
The forward-difference truncation model is
This equation says that, before round-off dominates, halving should reduce the forward-difference truncation error by about a factor of 2.
The central-difference truncation model is
This equation says that, before round-off dominates, halving should reduce the central-difference truncation error by about a factor of 4.
The fourth-order central-difference truncation model is
This equation says that, before round-off dominates, halving should reduce the fourth-order central-difference truncation error by about a factor of 16.
More generally, if the leading error behaves like
this equation says that the error is controlled by a power law in the step size.
Then halving the step size changes the leading error by about
This equation turns a theoretical order into a practical convergence-ratio check that you can measure from computed data.
For forward difference, Taylor series predicts
This equation says that the leading forward-difference error is proportional to the second derivative of the function at the evaluation point.
For , we have , so at the prediction becomes
This equation says that the forward-difference error should be negative at because .
For central difference, Taylor series predicts
This equation says that the leading central-difference error is proportional to the third derivative and therefore falls more quickly with .
For , we have , so at the prediction becomes
This equation says that the central-difference error should also be negative here, but much smaller for moderate because it is second order rather than first order.
The experiment below checks four things at once:
what is known analytically: ,
what is approximated numerically: forward, central, and fourth-order central derivatives,
what the theory predicts: slopes of 1, 2, and 4 on a log-log truncation plot,
what the computation tests: whether the measured error follows those slopes before round-off turns the curves upward.
This cell reuses the shared helper functions defined earlier.
What students should compare in the output: the slope on the right side of each curve, the ordering of the methods in the truncation-dominated regime, and the left-side upturn where shrinking stops helping.
f = np.sin
x0 = 1.0
true_value = float(np.cos(x0))
h_values = np.logspace(-14, -1, 80)

errors = {}
for method_name in ["forward", "central", "central4"]:
    errors[method_name] = np.array(
        [abs(finite_diff(f, x0, h_value, method_name) - true_value) for h_value in h_values]
    )

fig, ax = plt.subplots(figsize=(7, 4.5))
for method_name in ["forward", "central", "central4"]:
    ax.loglog(h_values, errors[method_name], label=method_name)
ax.set_xlabel("step size $h$")
ax.set_ylabel("absolute derivative error")
ax.set_title(r"Finite-difference error for $f(x)=\sin x$ at $x=1\,\mathrm{rad}$")
ax.legend()
ax.grid(True, which="both", alpha=0.25)
plt.show()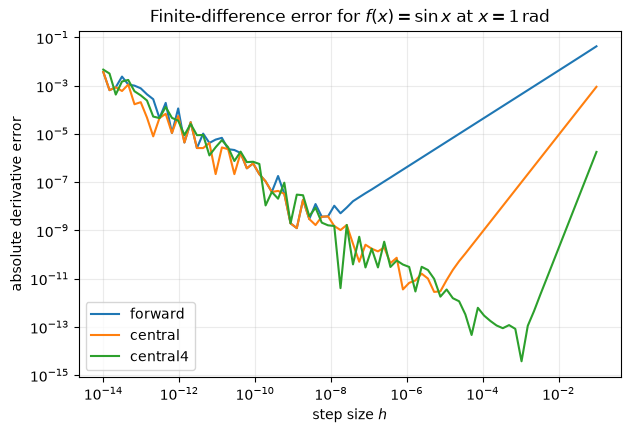
The plotted curves should show straight-line truncation behavior on the right and round-off upturn on the left. That is the practical version of the theory from Parts 1 and 2.
This cell reuses the shared helper functions defined earlier.
What the table is checking: whether halving changes the error by about the factor Taylor series predicts before round-off interferes.
ratio_h_values = [1.0e-1, 5.0e-2, 2.5e-2, 1.25e-2]
print("Observed convergence orders before round-off dominates")
print("-" * 64)
print(f"{'method':10s} {'h':>10s} {'abs error':>14s} {'observed p':>14s}")

for method_name in ["forward", "central", "central4"]:
    method_errors = [
        abs(finite_diff(f, x0, h_value, method_name) - true_value)
        for h_value in ratio_h_values
    ]
    for idx, (h_value, error_value) in enumerate(zip(ratio_h_values, method_errors)):
        if idx == 0:
            print(f"{method_name:10s} {h_value:10.2e} {error_value:14.3e} {'-':>14s}")
        else:
            p_value = observed_order(method_errors[idx - 1], error_value)
            print(f"{'':10s} {h_value:10.2e} {error_value:14.3e} {p_value:14.3f}")
Observed convergence orders before round-off dominates
----------------------------------------------------------------
method h abs error observed p
forward 1.00e-01 4.294e-02 -
5.00e-02 2.126e-02 1.014
2.50e-02 1.057e-02 1.007
1.25e-02 5.273e-03 1.004
central 1.00e-01 9.001e-04 -
5.00e-02 2.251e-04 1.999
2.50e-02 5.628e-05 2.000
1.25e-02 1.407e-05 2.000
central4 1.00e-01 1.799e-06 -
5.00e-02 1.125e-07 3.999
2.50e-02 7.035e-09 4.000
1.25e-02 4.397e-10 4.000
This table checks whether the measured order approaches the Taylor-series prediction before floating-point effects interfere.
The takeaway is simple: when the observed slope matches the predicted slope in the right regime, the implementation and the theory are telling the same story.
Designing Custom Finite Difference Formulas
Why this matters: real scientific codes often need derivatives at boundaries, interfaces, or irregular data locations where the standard centered stencil is unavailable.
Student mental model: designing a stencil is solving a cancellation problem with Taylor coefficients.
Suppose we want at a boundary point and only have access to , , and . Boundary points force one-sided formulas because the data do not exist symmetrically on both sides.
The derivative we want is the second derivative . The unwanted terms are , , and as many higher-order terms as possible. The strategy is to choose a linear combination that cancels the unwanted Taylor coefficients and leaves the target derivative behind.
What is known exactly in this section is the Taylor expansion of each nearby sample. What is approximated numerically is the boundary second derivative, where symmetry is unavailable. What the theory predicts is that the missing left-hand data will cost accuracy.
Start with the forward Taylor expansion:
This equation says that a sample one step away contains the value, slope, curvature, and higher-order corrections.
Now write the expansion two steps away:
This equation says that moving farther away changes the Taylor coefficients in a predictable way, which is exactly what lets us engineer cancellations.
To remove the first-derivative term, form the combination :
This equation says that the constant and first-derivative terms cancel, leaving the second derivative as the leading surviving term.
Now divide by :
This equation gives a one-sided approximation to the second derivative using only boundary-accessible function values.
The truncation model for this stencil is
This equation says that the one-sided second-derivative stencil is only first-order accurate, which is the price we pay for losing symmetry at the boundary.
This cell reuses the shared helper functions defined earlier.
What students should compare in the output: how the absolute error shrinks when is halved, and whether the measured order stays near 1 instead of drifting toward the centered-method orders from earlier.
f_exp = np.exp
x_boundary = 0.0
true_second = float(np.exp(x_boundary))
h_values_boundary = [1.0e-1, 5.0e-2, 2.5e-2, 1.25e-2]
errors_boundary = []

print("One-sided second derivative for f(x) = e^x at x = 0")
print("-" * 64)
print(f"{'h':>10s} {'approx':>14s} {'abs error':>14s} {'observed p':>14s}")
for idx, h_value in enumerate(h_values_boundary):
    approx = one_sided_second_derivative(f_exp, x_boundary, h_value)
    error_value = abs(approx - true_second)
    errors_boundary.append(error_value)
    if idx == 0:
        print(f"{h_value:10.2e} {approx:14.8f} {error_value:14.3e} {'-':>14s}")
    else:
        p_value = observed_order(errors_boundary[idx - 1], error_value)
        print(f"{h_value:10.2e} {approx:14.8f} {error_value:14.3e} {p_value:14.3f}")
One-sided second derivative for f(x) = e^x at x = 0
----------------------------------------------------------------
h approx abs error observed p
1.00e-01 1.10609220 1.061e-01 -
5.00e-02 1.05149013 5.149e-02 1.043
2.50e-02 1.02536852 2.537e-02 1.021
1.25e-02 1.01259164 1.259e-02 1.011
This numerical check should show observed order near 1, which confirms the first-order Taylor prediction for the boundary stencil.
This confirms the first-order convergence predicted by Taylor series. Losing symmetry costs an order of accuracy.
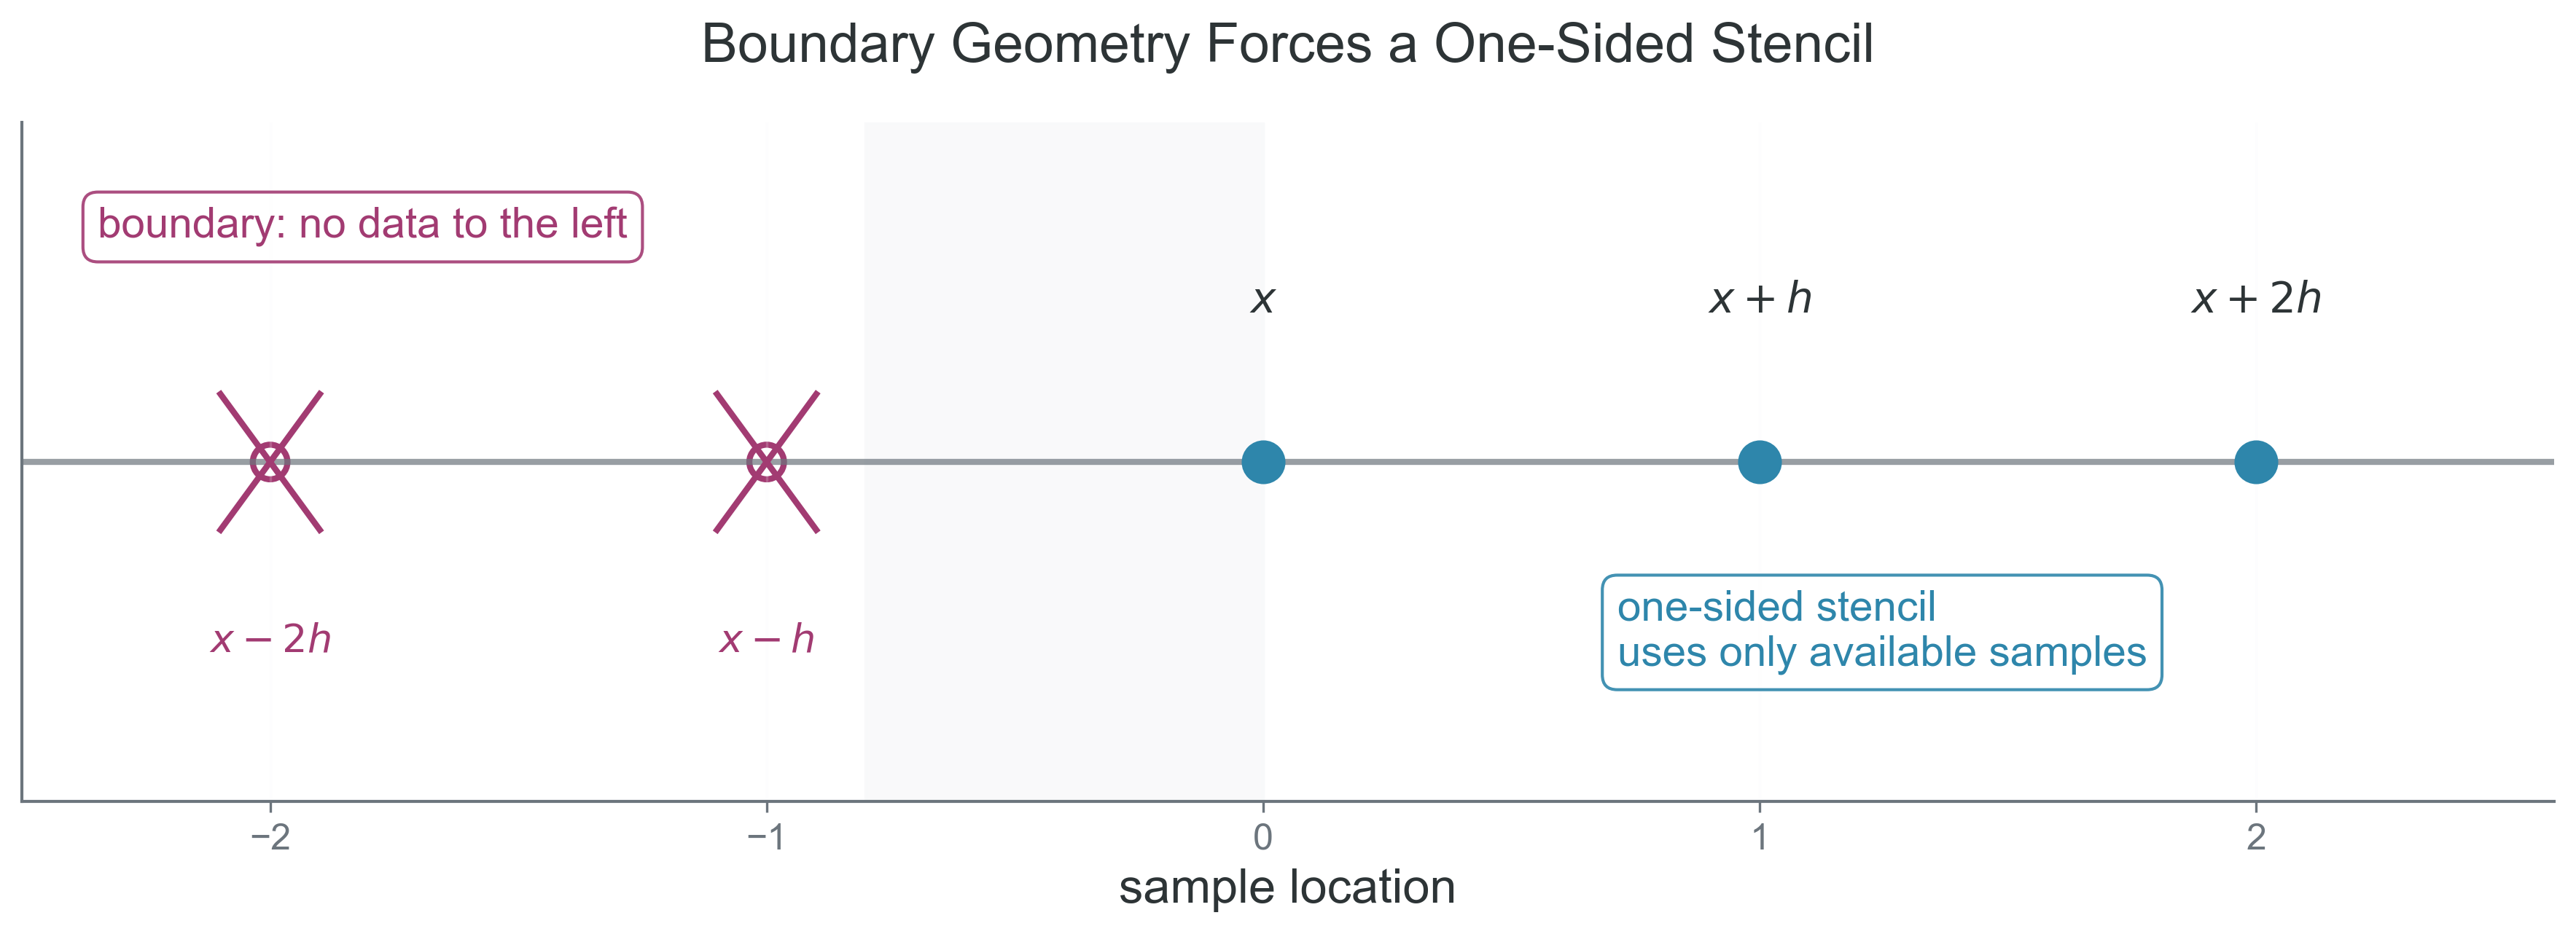
Figure 2:What to notice in this figure: the lack of symmetry at the boundary forces all of the sample points onto one side of , so the stencil loses the cancellation pattern that made the centered formulas more accurate.
General Recipe for Custom Methods
Why this matters: once you see stencil design as a systematic process, you can build methods for boundaries, PDE grids, and irregular geometries instead of memorizing isolated formulas.
Use this recipe when you need a custom stencil:
Choose the sample locations your problem actually provides, such as , , , or a one-sided boundary set.
Expand each sample value about the point where you want the derivative.
Assign unknown stencil weights to the samples you plan to combine.
Match the target derivative by forcing its coefficient to become 1 after the appropriate division by .
Cancel the lower-order unwanted terms, starting with constants and then moving through the derivative terms you do not want.
Identify the first term that survives, because that term sets the truncation order.
Verify the observed order numerically on a smooth function with a known derivative.
The structured summary below is the compact version of the workflow:
| Design step | Question to ask | Typical output |
|---|---|---|
| Geometry | Which sample points are available? | centered or one-sided stencil points |
| Taylor model | What derivatives appear in each expansion? | coefficient table in powers of |
| Cancellation | Which terms must vanish? | a linear system for the stencil weights |
| Accuracy | Which term survives first? | the order in |
| Validation | Does the implementation show the predicted slope? | numerical verification against the expected order |
This is a stencil-design workflow, not a formula to memorize. This same logic reappears in PDE finite-difference stencils, ghost-cell formulas, and boundary-condition enforcement.
When NOT to Use Numerical Derivatives
Why this matters: good numerical work includes knowing when not to apply a familiar tool.
Analytical Derivatives Available
Why this matters: if symbolic differentiation is easy and the expression is stable, finite differences are usually inferior because they add truncation and round-off error to a problem that did not need them.
Consider the polynomial
This equation defines a function whose derivative is easy to compute exactly by hand.
The analytical derivative is
This equation says that we can evaluate the derivative directly, with no step-size tuning and no finite-difference approximation error.
This cell reuses the shared helper functions defined earlier.
What students should compare in the output: the exact derivative, the finite-difference approximation, and the small but nonzero difference that appears only because the numerical method introduces approximation and floating-point error.
def polynomial(x: float) -> float:
    """Return a cubic polynomial used for a clean derivative comparison."""
    return x**3 - 2.0 * x**2 + 5.0 * x - 3.0


def polynomial_derivative(x: float) -> float:
    """Return the exact derivative of the comparison polynomial."""
    return 3.0 * x**2 - 4.0 * x + 5.0


x_poly = 2.0
exact_poly = polynomial_derivative(x_poly)
numeric_poly = finite_diff(polynomial, x_poly, 1.0e-5, method="central")

print(f"Exact derivative:          {exact_poly:.12f}")
print(f"Finite-difference result:  {numeric_poly:.12f}")
print(f"Absolute difference:       {abs(numeric_poly - exact_poly):.3e}")
Exact derivative: 9.000000000000
Finite-difference result: 9.000000000103
Absolute difference: 1.034e-10
Finite differences are often a useful fallback, not the gold standard.
Noisy Data
Why this matters: differentiation amplifies high-frequency variation, so even modest measurement noise can overwhelm the derivative.
Suppose a velocity curve or luminosity signal is measured with small observational noise. The function values may still look reasonable, but numerical differentiation magnifies the noise because differences divide by a small spacing.
What is known exactly here is the smooth underlying signal. What is approximated numerically is the derivative of noisy samples, and what theory predicts is amplification of the shortest-scale fluctuations.
This cell reuses the NumPy and Matplotlib imports from the setup cell, but does not depend on the shared helper functions.
rng = np.random.default_rng(536)
x_noise = np.linspace(0.0, 2.0 * np.pi, 250)
y_true = np.sin(x_noise)
y_noisy = y_true + 0.01 * rng.standard_normal(len(x_noise))
dy_dx_numeric = np.gradient(y_noisy, x_noise)
dy_dx_true = np.cos(x_noise)

fig, ax = plt.subplots(figsize=(7, 4.5))
ax.plot(x_noise, dy_dx_true, label="true derivative")
ax.plot(x_noise, dy_dx_numeric, label="derivative of noisy data")
ax.set_xlabel("$x$")
ax.set_ylabel("derivative estimate")
ax.set_title("Noise amplification under numerical differentiation")
ax.legend()
ax.grid(True, alpha=0.25)
plt.show()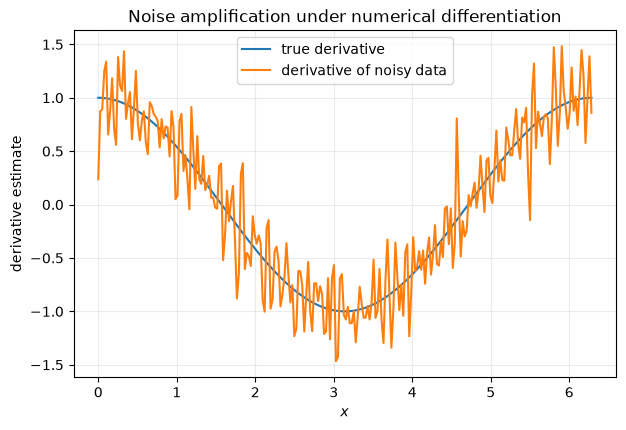
What to notice: the derivative curve becomes jagged even though the original noise is mild. The amplification is strongest at small scales because differencing divides by the sample spacing, which is exactly why direct numerical derivatives are dangerous on noisy measurements.
If the scientific quantity is noisy, smoothing, model fitting, or a weak-form approach is often more defensible than direct finite differencing.
The takeaway is that a visually reasonable signal can still produce a scientifically misleading derivative.
Expensive Function Evaluations
Why this matters: some “functions” are really whole simulations, optimization solves, or Monte Carlo estimates.
A single function evaluation might mean integrating an ODE system for a stellar model, running a radiative-transfer iteration, or estimating a likelihood with thousands of random samples. In that setting, even a central difference costs two expensive evaluations per scalar derivative, and higher-order stencils cost more.
As a concrete example, suppose one function call means integrating an orbit for 105 timesteps or solving a PDE relaxation to tolerance. Then a gradient with 100 parameters already requires hundreds of such solves if you use finite differences.
The takeaway is that cost alone can make an otherwise valid derivative estimate a poor scientific choice.
You Need Many Derivatives
Why this matters: finite differences scale linearly with the number of differentiated inputs, which becomes absurd for modern optimization problems.
If you need derivatives with respect to many parameters, the cost explodes:
def finite_difference_call_count(n_parameters: int, method: str = "central") -> int:
    """Return the number of function calls needed for one gradient."""
    if n_parameters <= 0:
        raise ValueError("n_parameters must be positive.")
    calls_per_parameter = {"forward": 1, "central": 2, "central4": 4}[method]
    return n_parameters * calls_per_parameter + (1 if method == "forward" else 0)


for n_parameters in [10, 10_000, 1_000_000]:
    forward_calls = finite_difference_call_count(n_parameters, method="forward")
    central_calls = finite_difference_call_count(n_parameters, method="central")
    print(
        f"parameters = {n_parameters:>9d}  "
        f"forward calls = {forward_calls:>9d}  "
        f"central calls = {central_calls:>9d}"
    )
parameters = 10 forward calls = 11 central calls = 20
parameters = 10000 forward calls = 10001 central calls = 20000
parameters = 1000000 forward calls = 1000001 central calls = 2000000
Forward differences share one baseline evaluation across all coordinates, so a fresh gradient costs calls. If the baseline is already cached, the additional cost is . Central differences need calls.
For neural networks or large inverse problems, finite differences for millions of parameters is not merely inconvenient. It is computationally unreasonable.
The takeaway is that scaling with parameter count is a scientific design constraint, not just an implementation nuisance.
Automatic Differentiation
Why this matters: automatic differentiation is one of the core modern tools for optimization, inverse problems, and machine learning.
Automatic differentiation differentiates the implemented computation itself. It is not symbolic algebra, and it is not finite differencing. It is also not taking derivatives of some idealized mathematical object floating in Platonic heaven. Instead, it applies the chain rule to the executed computation graph and returns derivatives accurate up to the floating-point precision of that implemented computation.
What is known exactly here is the code path you actually execute. What is approximated or constrained numerically is everything imposed by floating-point arithmetic, control flow, and the smoothness of the implemented operations.
Here is the clean distinction:
| Method | Derivative quality | Cost | Typical use | Limitations |
|---|---|---|---|---|
| Symbolic differentiation | exact algebraic derivative before numerical evaluation | can become algebraically cumbersome | simple closed-form expressions, computer algebra | may be unavailable for black-box code or complex control flow |
| Finite differences | approximate derivative with truncation and round-off error | multiple function evaluations per derivative | black-box verification, quick experiments, small parameter counts | sensitive to , noise, and computational cost |
| Automatic differentiation | derivative of the implemented computation to machine precision | often comparable to a small multiple of function evaluation cost | optimization, neural networks, inverse problems | needs AD-compatible code and still inherits floating-point and differentiability limits |
This conceptual preview reuses finite_diff and math from the shared setup above. It is intentionally not a full dependency-heavy tutorial.
import jax
import jax.numpy as jnp


def jax_function(x):
    """Return a smooth function for an automatic-differentiation preview."""
    return jnp.sin(x) * jnp.exp(-x**2) + x**3


def analytical_derivative(x: float) -> float:
    """Return the analytical derivative of the preview function."""
    return (
        math.cos(x) * math.exp(-x**2)
        - 2.0 * x * math.sin(x) * math.exp(-x**2)
        + 3.0 * x**2
    )


x_ad = 1.0
ad_value = float(jax.grad(jax_function)(x_ad))
exact_value = analytical_derivative(x_ad)
fd_value = finite_diff(lambda z: math.sin(z) * math.exp(-(z**2)) + z**3, x_ad, 1.0e-5)

print(f"Analytical derivative:      {exact_value:.12f}")
print(f"Automatic differentiation: {ad_value:.12f}")
print(f"Finite difference:         {fd_value:.12f}")
print(f"|AD - exact|:              {abs(ad_value - exact_value):.3e}")
print(f"|FD - exact|:              {abs(fd_value - exact_value):.3e}")
This preview is intentionally shown without in-page execution so the reading stays lightweight and render-stable. The key point is narrower and more honest: AD removes finite-difference truncation error and step-size tuning, but it still inherits the floating-point and smoothness limits of the implemented computation.
The takeaway is that AD is powerful because it matches the code you run, not because it transcends numerical analysis.
When to Use Each Method
Why this matters: decision frameworks are useful only if they reflect actual computational trade-offs.
Use this checklist as a heuristic, not a law:
Check smoothness and noise first, including for a black-box function. If the data are noisy, model or smooth the signal and test sensitivity to that choice before trusting its derivative. At a non-smooth point, establish whether the derivative you want exists.
If an analytical derivative is easy to derive and evaluate stably, use it.
If the function is a smooth black box and you only need a few derivatives, finite differences may be reasonable; sweep the step size to check convergence and noise amplification.
If you need many derivatives and have access to differentiable source code, automatic differentiation is usually the right tool.
If the function evaluation is extremely expensive, rethink whether derivative-free reformulation, surrogate modeling, or adjoint methods would be better.
The right choice depends on smoothness, cost, noise, and access to the source code of the implemented computation.
| Method | Best when | Main strength | Main weakness | Typical COMP 521 use case |
|---|---|---|---|---|
| Analytical derivative | closed-form math is available | no truncation error and no step-size tuning | may be tedious or unavailable | checking toy models and benchmark functions |
| Finite differences | black-box function, small derivative count | easy to implement and easy to inspect | sensitive to , noise, and evaluation cost | validating convergence ideas and debugging |
| Automatic differentiation | differentiable source code and many parameters | scalable accurate gradients for implemented code | depends on AD-compatible operations | optimization and neural-network training |
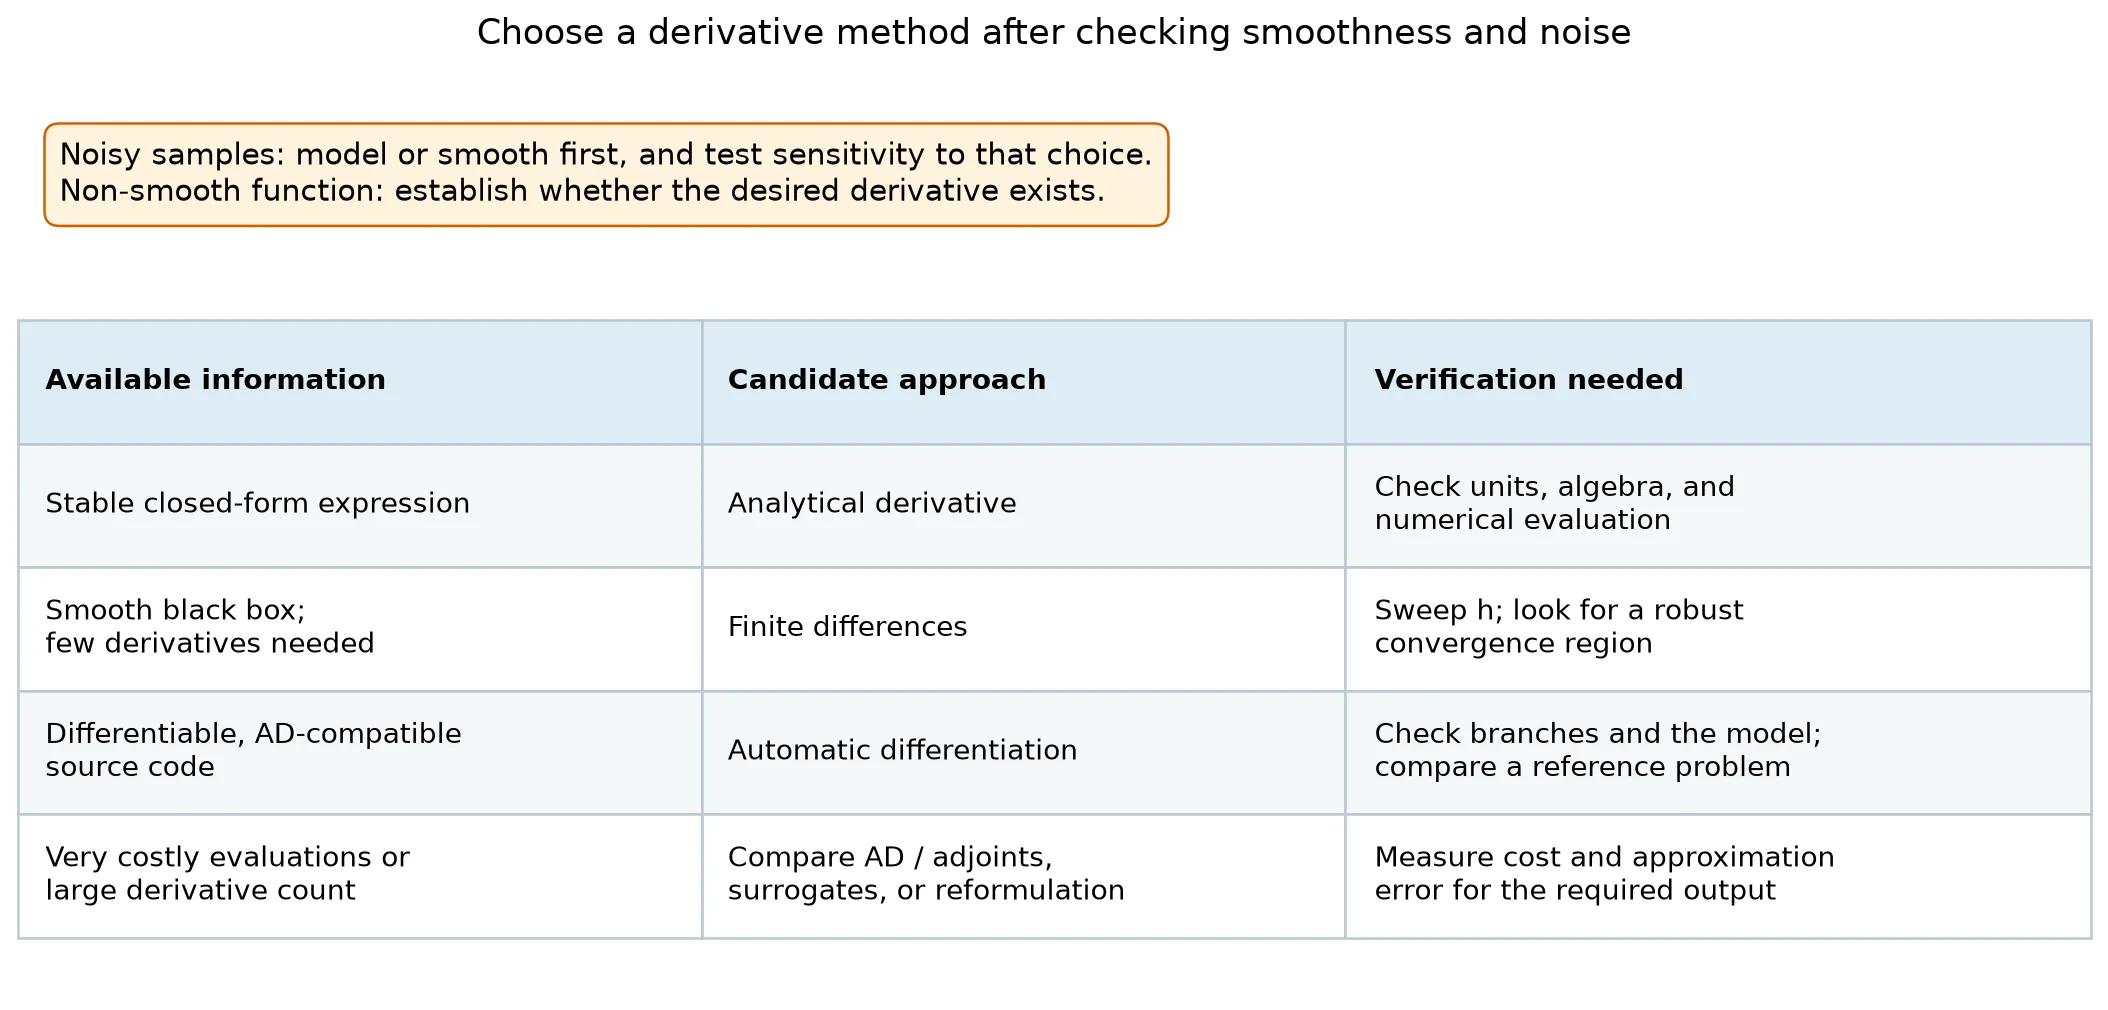
Figure 3:Assess noise and smoothness before selecting a derivative method, including when the function is a black box. The table pairs available information with candidate approaches and checks; these are conditional choices, not guarantees. Smoothing noisy data changes the estimated signal, so test sensitivity to the smoothing or model choice as well as to the derivative calculation.
Verification Strategy
Why this matters: scientific verification is stronger than “two numbers seem close.”
If you know a true derivative, compare against it. If you do not know a true derivative, compare multiple step sizes and multiple stencils. Agreement between two wrong methods is still possible, so method comparison must be tied to convergence expectations, not just raw closeness.
This section separates three different checks that students often blur together:
exact-reference testing: compare against a derivative you know analytically,
cross-method comparison: compare different numerical stencils against one another,
convergence-order testing: check whether refinement behaves with the slope theory predicts.
For the mixed test function
we can still differentiate analytically and use that exact derivative as a benchmark.
The analytical derivative is
This equation gives us a trustworthy target for checking several numerical stencils at once.
This cell reuses the shared helper functions defined earlier.
What students should compare in the output: how the different stencils rank at the same , how the error changes with , and whether the better-looking result is also the one supported by convergence expectations.
def mixed_function(x: float) -> float:
    """Return a smooth benchmark function for verification."""
    return math.sin(x) * math.exp(-(x**2)) + x**3


def mixed_derivative(x: float) -> float:
    """Return the analytical derivative of the benchmark function."""
    return math.exp(-(x**2)) * (math.cos(x) - 2.0 * x * math.sin(x)) + 3.0 * x**2


x_verify = 0.7
true_verify = mixed_derivative(x_verify)
h_verify_values = [1.0e-2, 1.0e-4, 1.0e-6]

print(f"Verification at x = {x_verify}")
print("-" * 72)
print(f"{'method':10s} {'h':>10s} {'approx':>14s} {'abs error':>14s}")
for method_name in ["forward", "central", "central4"]:
    for h_value in h_verify_values:
        approx = finite_diff(mixed_function, x_verify, h_value, method_name)
        error_value = abs(approx - true_verify)
        print(f"{method_name:10s} {h_value:10.1e} {approx:14.8f} {error_value:14.3e}")
Verification at x = 0.7
------------------------------------------------------------------------
method h approx abs error
forward 1.0e-02 1.39857624 1.254e-02
forward 1.0e-04 1.38615574 1.239e-04
forward 1.0e-06 1.38603309 1.239e-06
central 1.0e-02 1.38618793 1.561e-04
central 1.0e-04 1.38603186 1.561e-08
central 1.0e-06 1.38603185 2.247e-11
central4 1.0e-02 1.38603187 1.867e-08
central4 1.0e-04 1.38603185 2.924e-13
central4 1.0e-06 1.38603185 2.247e-11
This comparison teaches a practical lesson: reliable verification uses both exact-reference testing and cross-method comparison, but it becomes compelling only when convergence-order testing tells the same story.
Use this verification checklist when validating a derivative computation:
Exact-reference testing: test on functions with known derivatives first.
Cross-method comparison: compare multiple stencils at the same evaluation point.
Convergence-order testing: compare multiple values and verify the expected order.
If convergence fails, the cause may be a bug, the wrong asymptotic regime, round-off domination, or loss of smoothness.
Agreement between methods is encouraging, but not by itself proof of correctness.
From Taylor expansions to quadrature panels
Taylor-series reasoning does not disappear after finite differences. It explains the order claims for the quadrature rules.
On one left-rectangle panel of width , expand a smooth integrand about the left endpoint:
Integrating the expansion gives
The omitted area on one panel is therefore . A fixed interval contains about panels, so the composite left-rectangle error is , not . This local-to-global count is the source of the first order you will measure in a convergence study.
For the trapezoid rule, symmetric endpoint samples cancel the leading odd Taylor term and give global order 2. Simpson’s symmetric two-panel weights cancel further terms and give global order 4 when the required derivatives are smooth. These are claims about a refinement regime; test them before the floating-point floor and away from a discontinuity or branch point.
Bridge to later numerical methods
The same habits you built here will reappear when you solve
because root-finding methods depend on local approximations and convergence behavior.
The same logic will reappear when you approximate
because quadrature rules are also built by matching and canceling Taylor terms.
The same reasoning returns again for differential equations such as
because ODE solvers are designed around local truncation error, stability, and the repeated accumulation of floating-point effects.
Block 2 uses the quadrature case first. Block 3 then introduces root finding, whose bracketing and initial-guess contracts are different from integration. Block 4 introduces time stepping, where local error is accumulated through a trajectory and stability adds a further constraint. The throughline is the same: Taylor-series reasoning tells us what the method is trying to approximate, and numerical verification tells us whether the implementation behaves that way.
The takeaway to carry forward is that every new method still demands both approximation logic and verification evidence.
Final Checklist
Before you leave Module 1, make sure you can:
verify a predicted convergence order with computed data,
derive a one-sided stencil by canceling Taylor terms,
explain why noisy data and expensive function evaluations change the method choice,
describe what automatic differentiation does and what it does not promise,
turn a local panel error into a composite quadrature order,
distinguish the integration, root-finding, and time-stepping contracts,
carry Taylor-series reasoning into later topics such as , , and .
Next: numerical integration. Root finding follows in a later reading.