The Balancing Act — Hydrostatic Equilibrium
Section 4 of 7
Estimating the Central Pressure
Part 3: Estimating the Central Pressure
Hydrostatic equilibrium tells us the slope of the pressure profile, but not yet the pressure scale itself. In astronomy we often know a star’s mass and radius before we know its internal structure. A scaling argument lets us infer interior conditions directly from those observable quantities.
Reading the Math: the central pressure
Hydrostatic equilibrium gives the slope of the pressure profile, not the pressure itself. To turn that slope into a number we use the move that drives this whole module — Reading the Math: approximate the derivative, extract the scaling, then name the assumption you just made. We will run it again for the core temperature, for fusion, for radiation transport, and for the entire main sequence. Here is its first full pass.
① Approximate the derivative. We do not know in detail, but we know its two endpoints: at the center () the pressure is ; at the surface () it has dropped to essentially nothing, . Approximate the derivative by the average slope between those endpoints:
The minus sign is not bookkeeping — it is the physics: pressure decreases outward. This single replacement, a derivative turned into a ratio of global scales, is the engine of every scaling in Module 3.
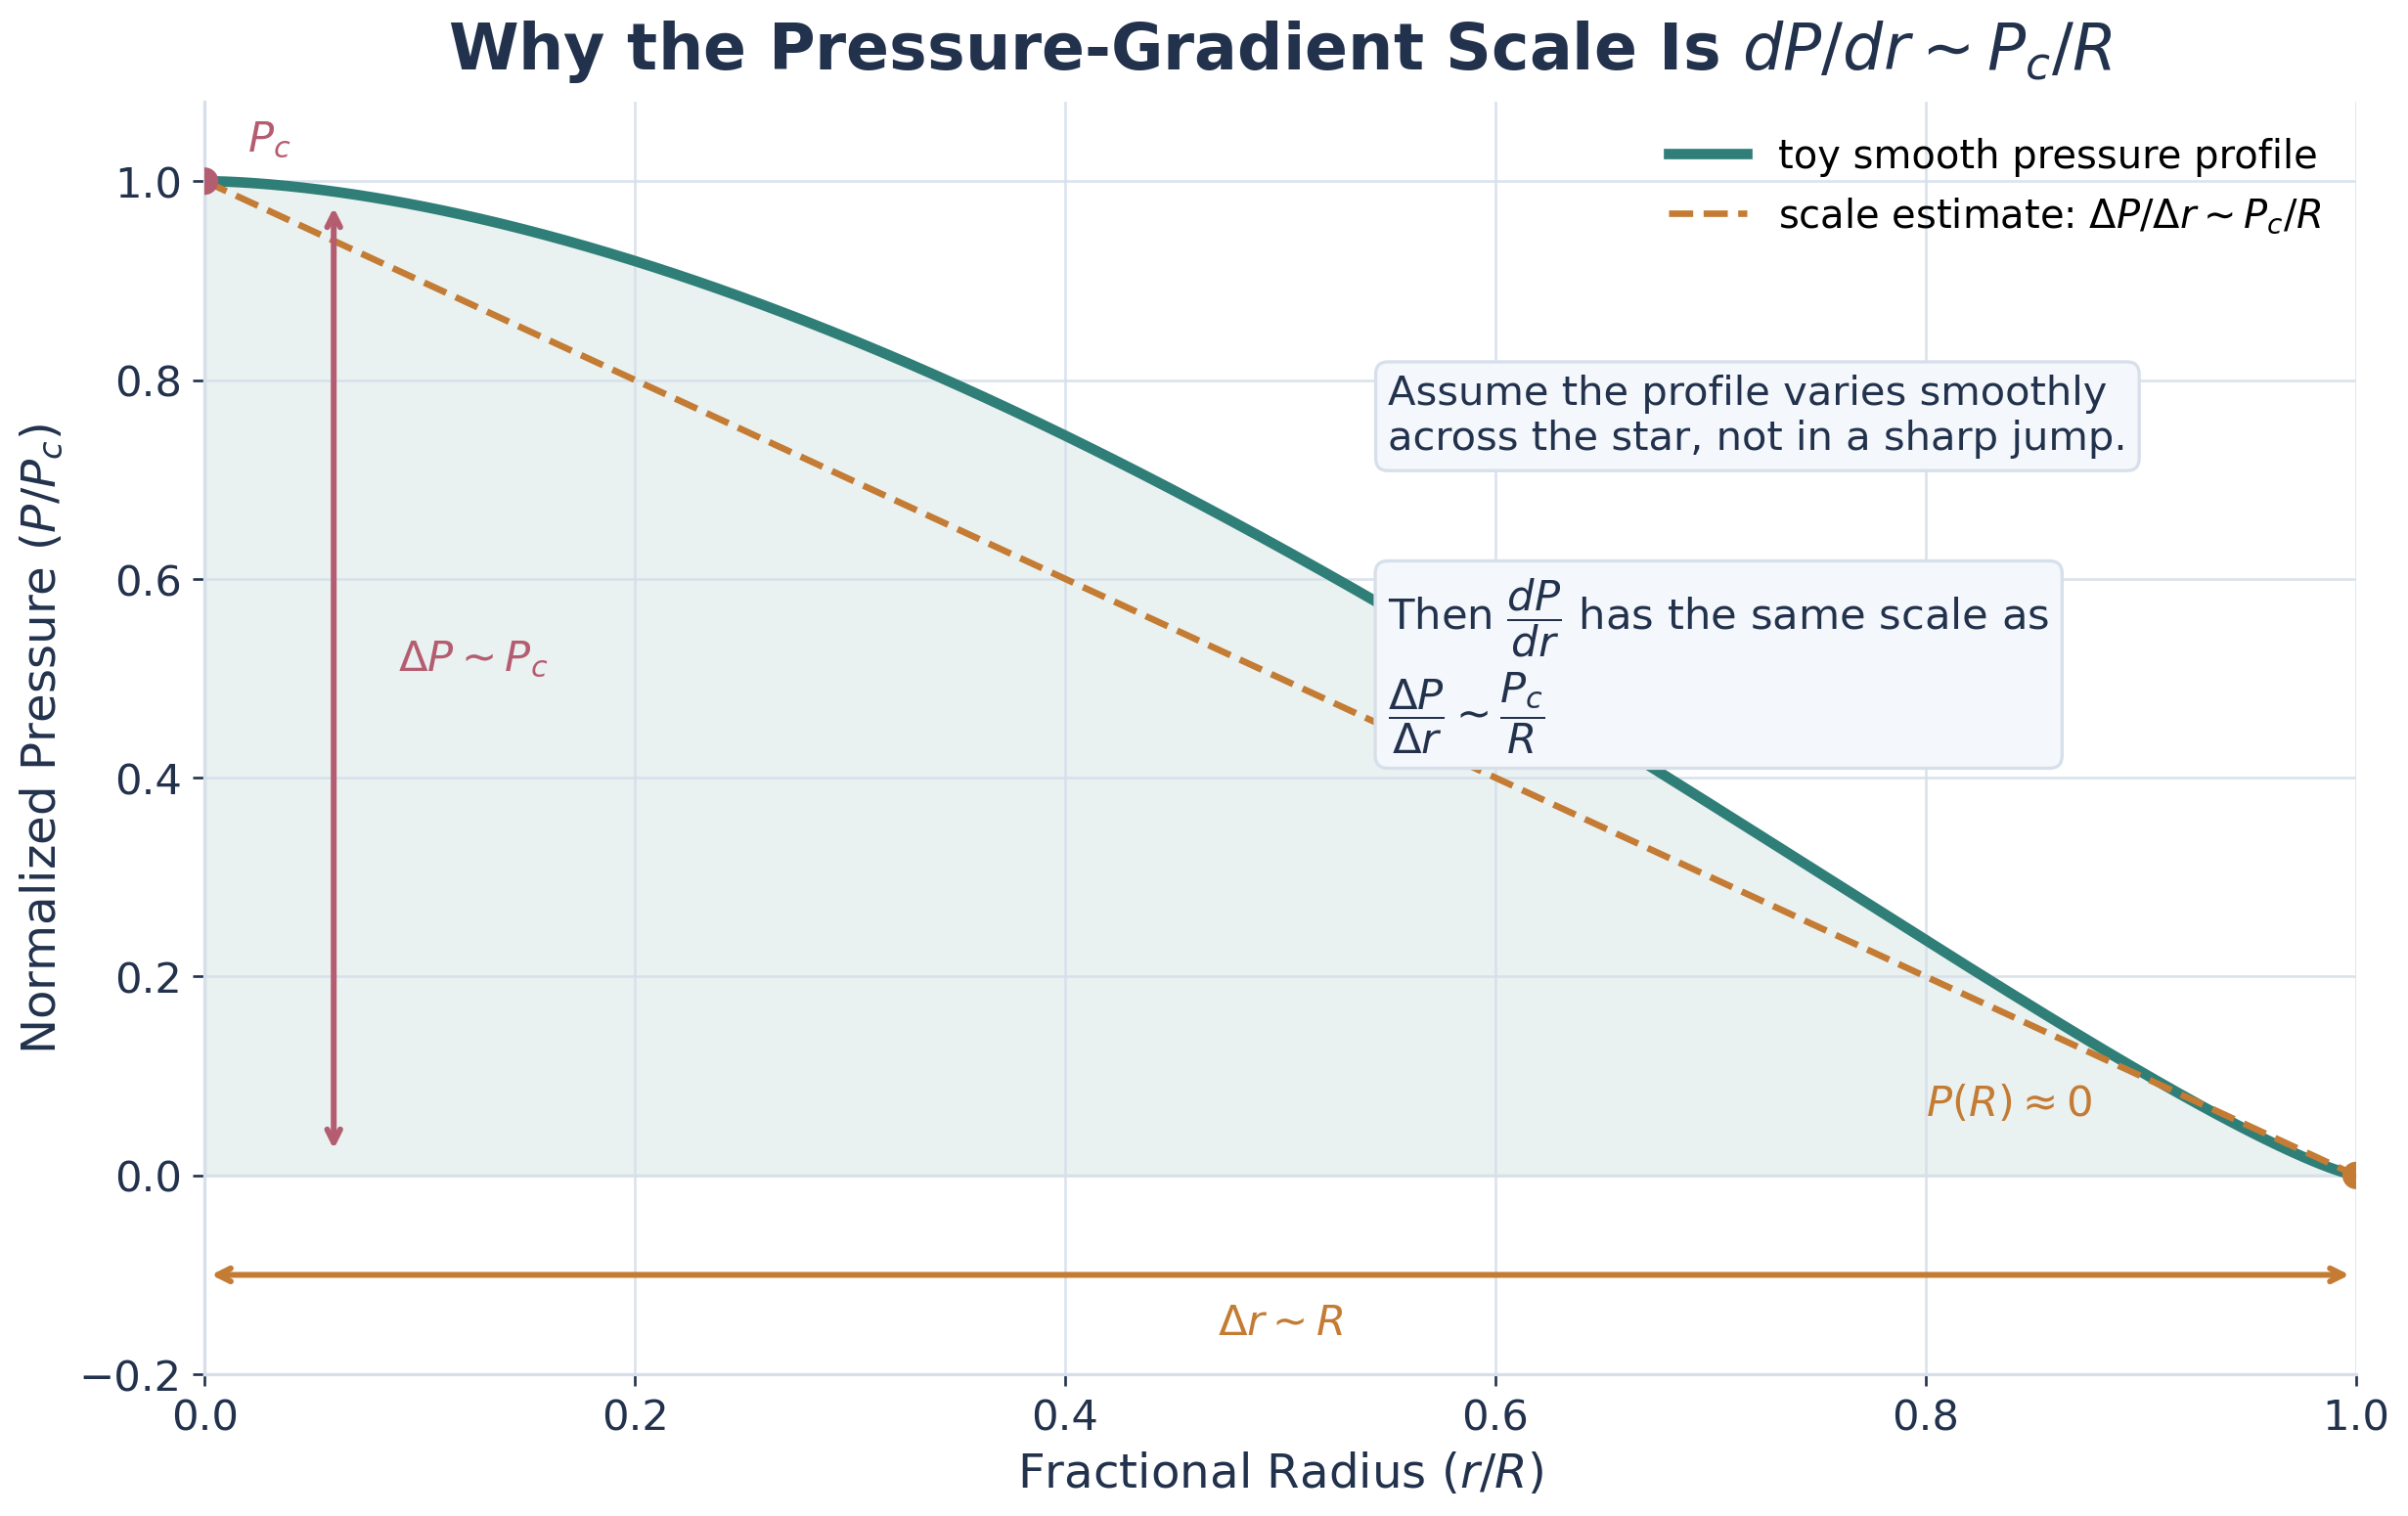
② Extract the scaling. Put that approximate gradient into hydrostatic equilibrium, , and replace the two remaining local quantities by their global scales — the mean density and the surface gravity :
The minus signs match on both sides — the approximation respects the physics — so cancel them and multiply through by to read off the central-pressure scaling.
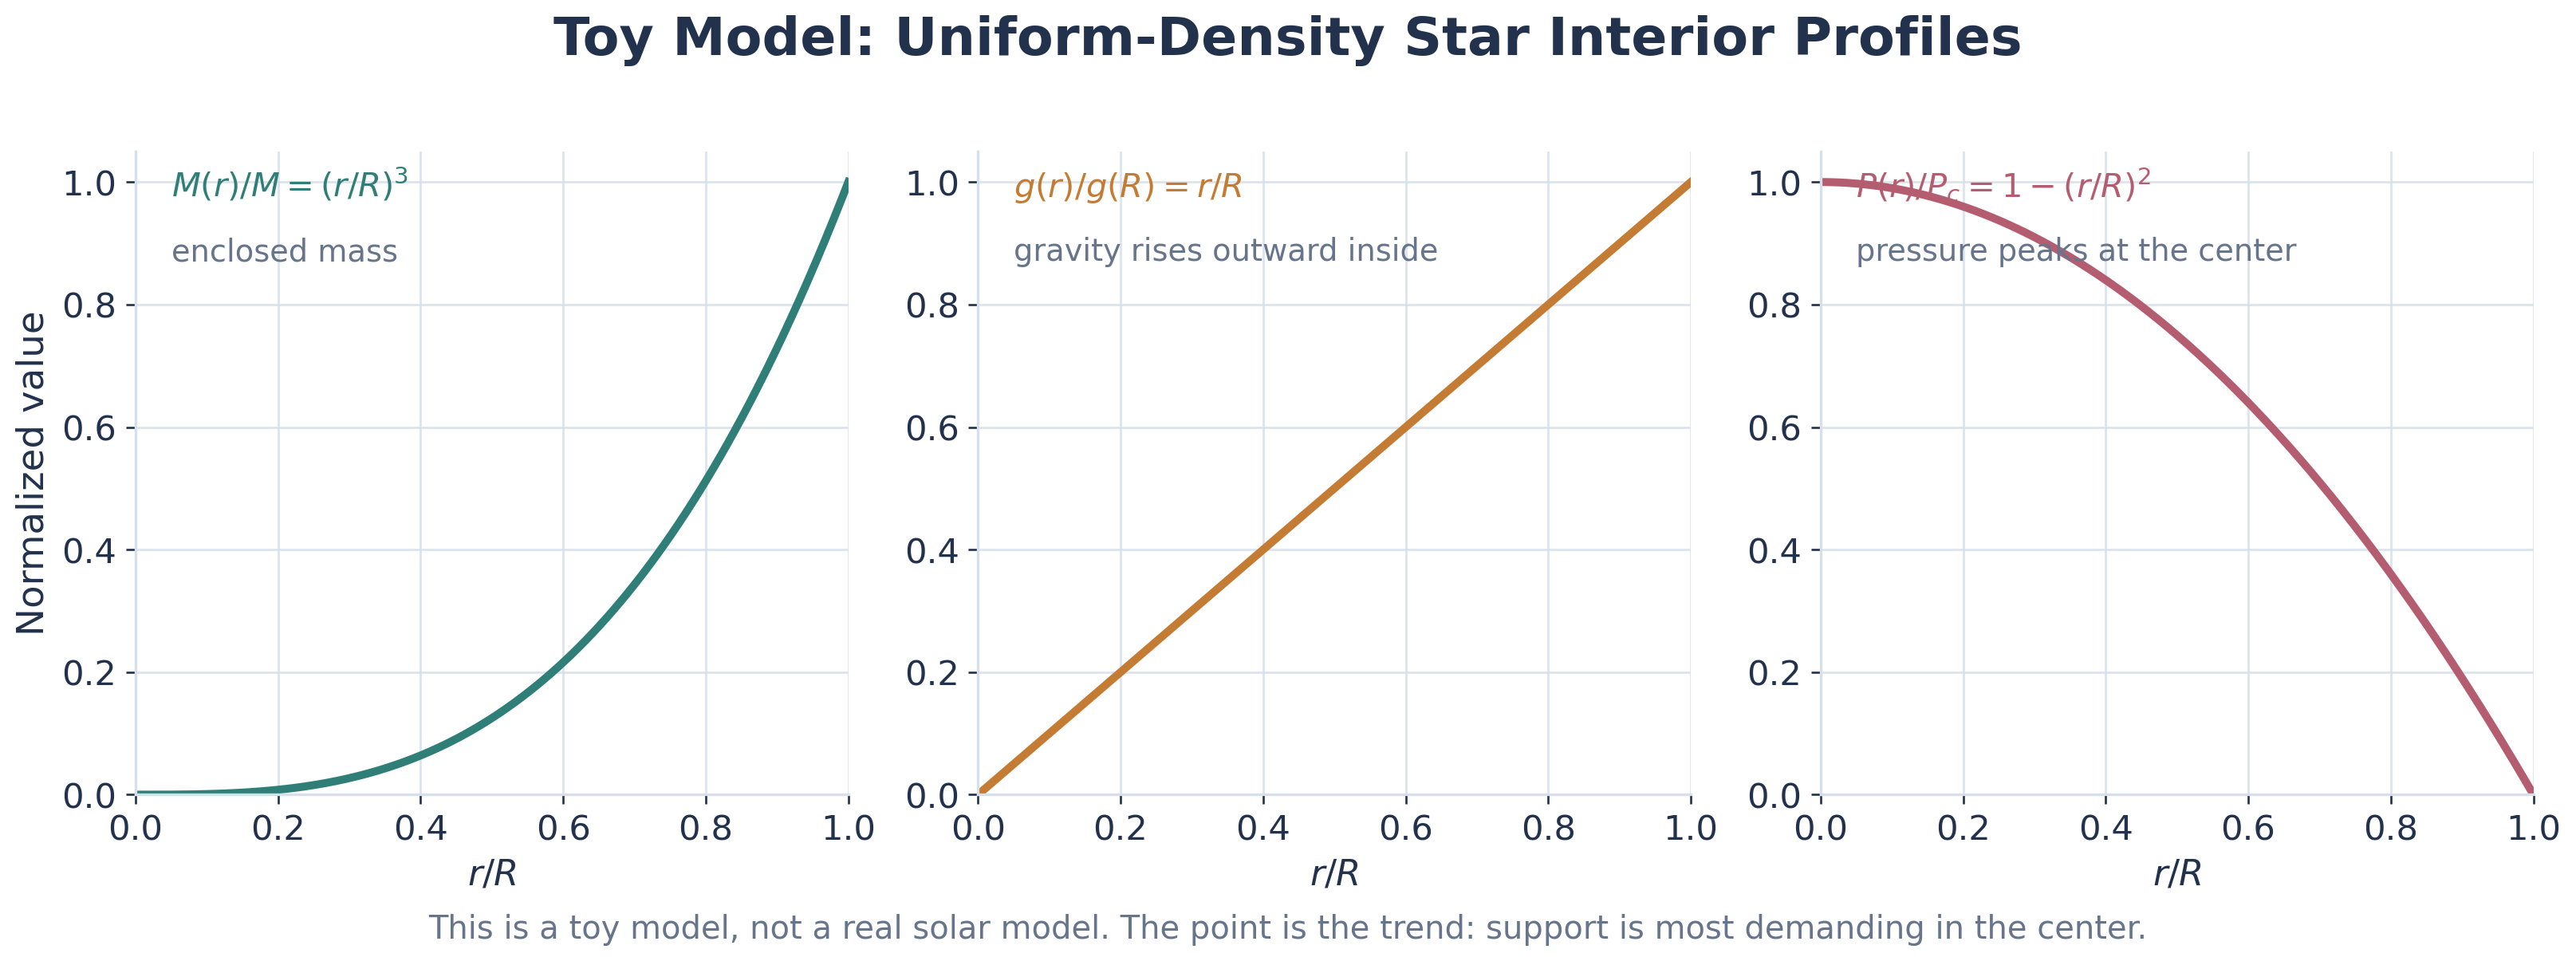
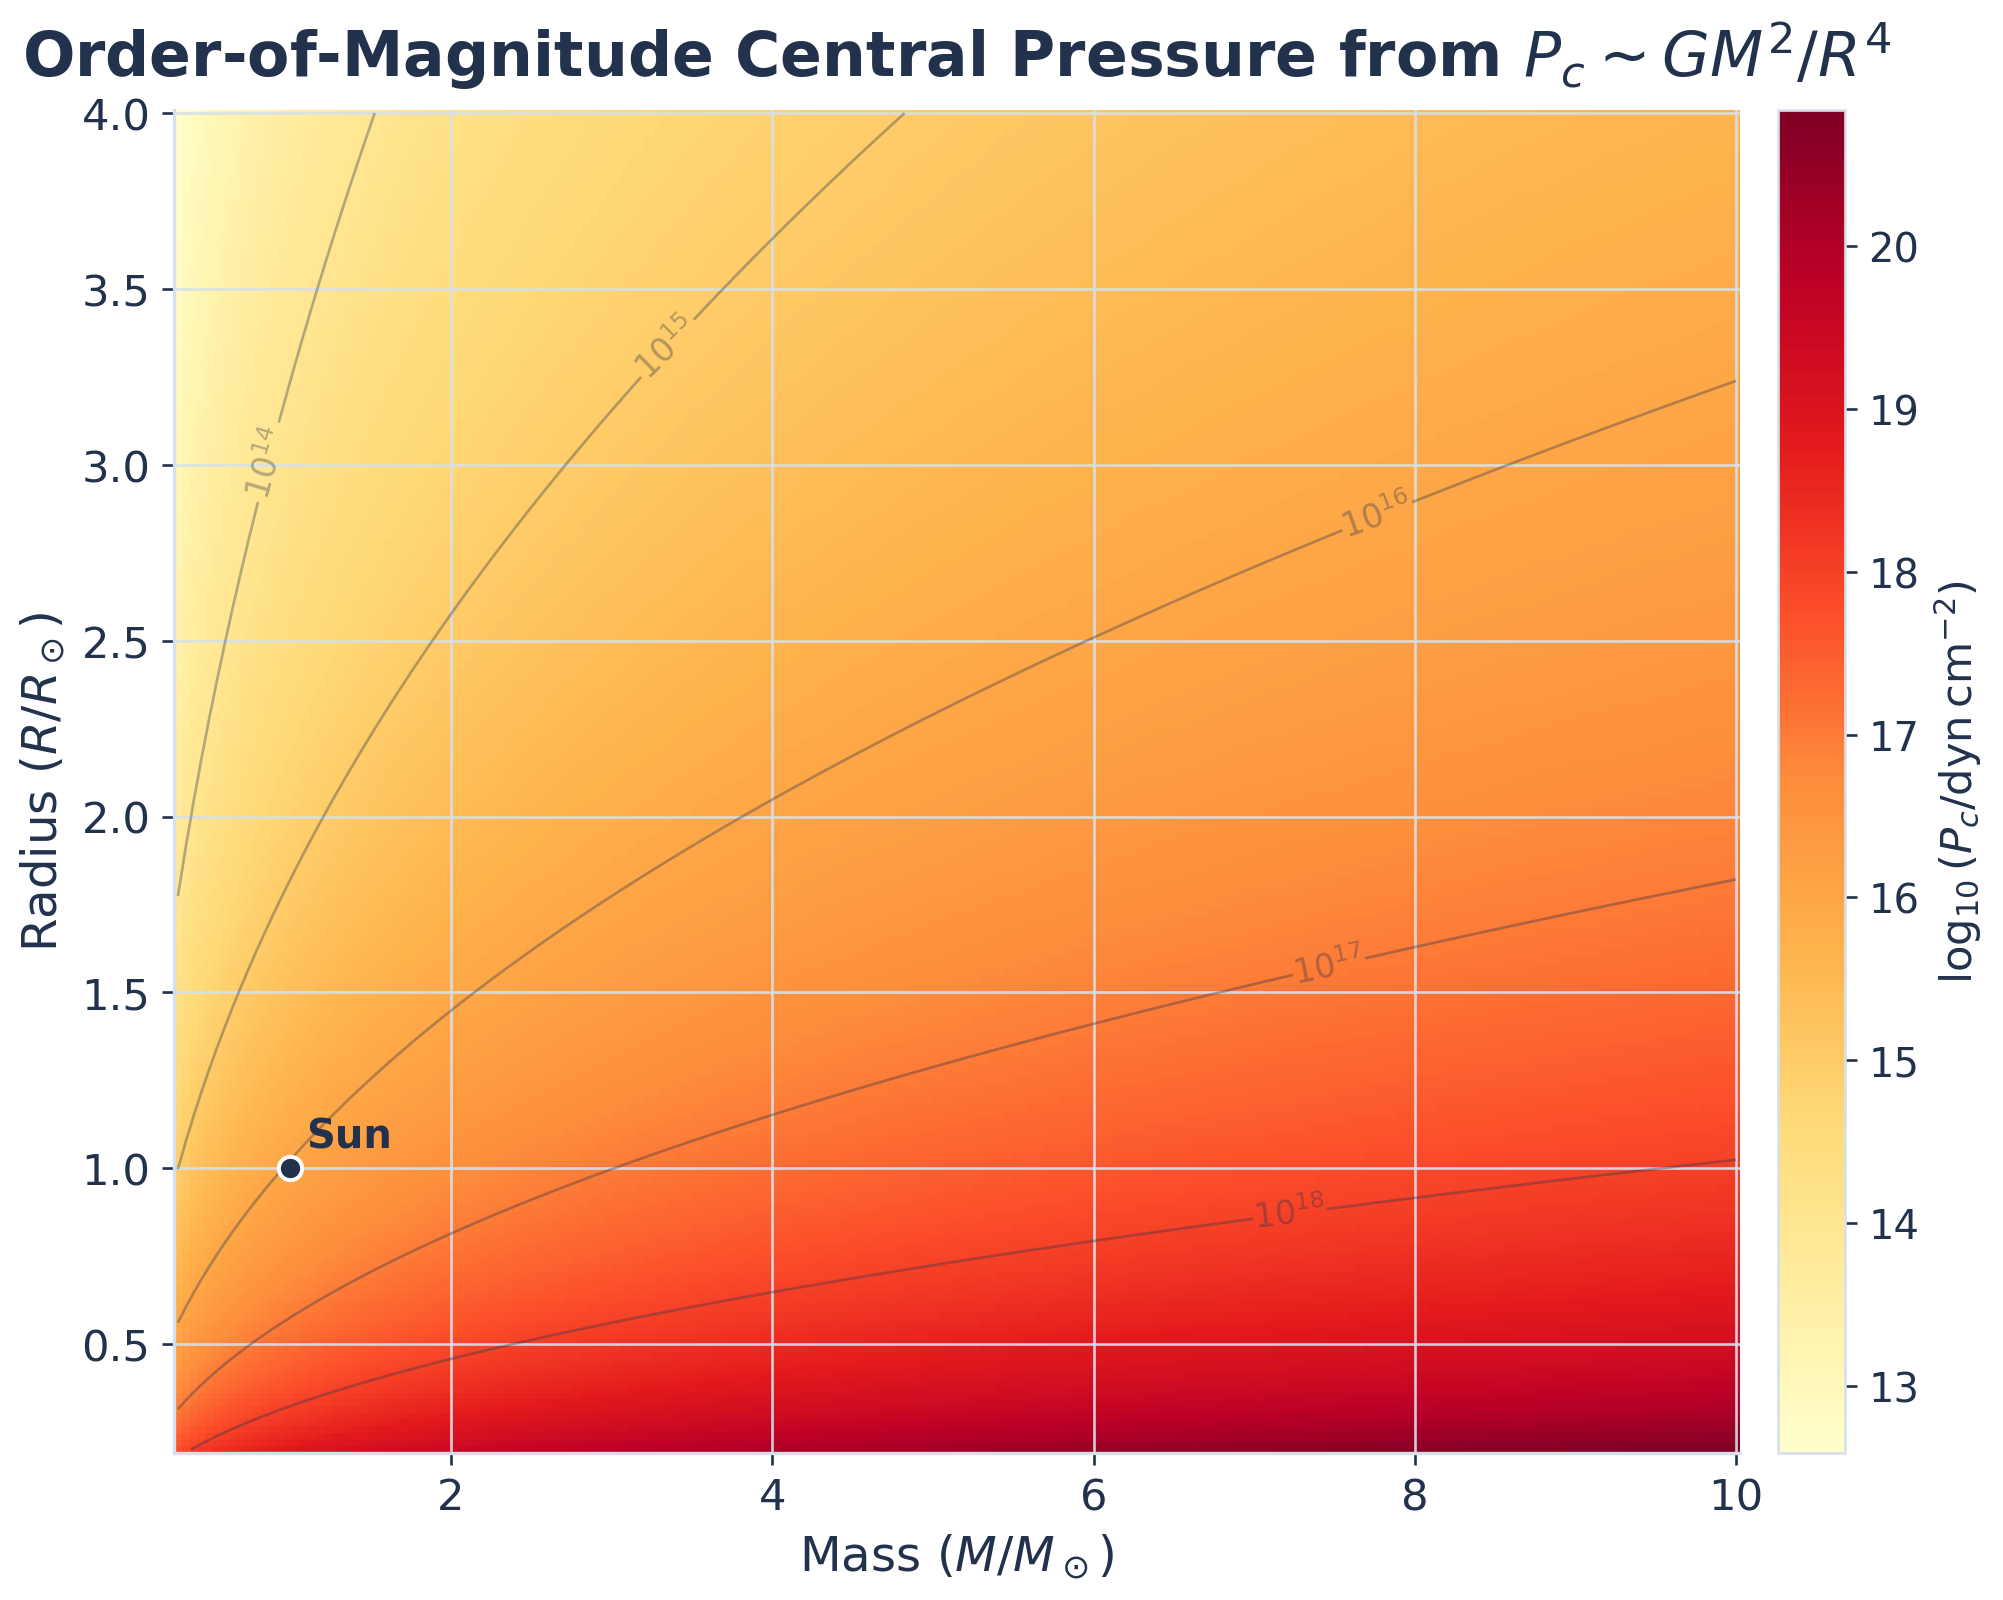
Stronger gravity demands higher internal pressure, and smaller radii make that demand rise sharply: . That is why compact stars require enormous internal pressure even when their total mass is not especially large.
③ Name the assumption. Every arrow above hid an approximation. Collect them — this is the audit you return to whenever a scaling disagrees with a real star, and the list Reading 5 will stress-test one row at a time:
| We assumed | by replacing | What it costs |
|---|---|---|
| pressure vanishes at the surface | in | negligible: |
| the star has one density | real stars are centrally concentrated → underestimates (here by ) | |
| one length scale | yields a scale, not the true profile |
The exponents survive all three approximations; only the coefficient suffers. That is the deal a scaling makes — right exponents, approximate coefficient — and it is exactly why the worked estimate below lands a factor of low yet still nails the dependence.
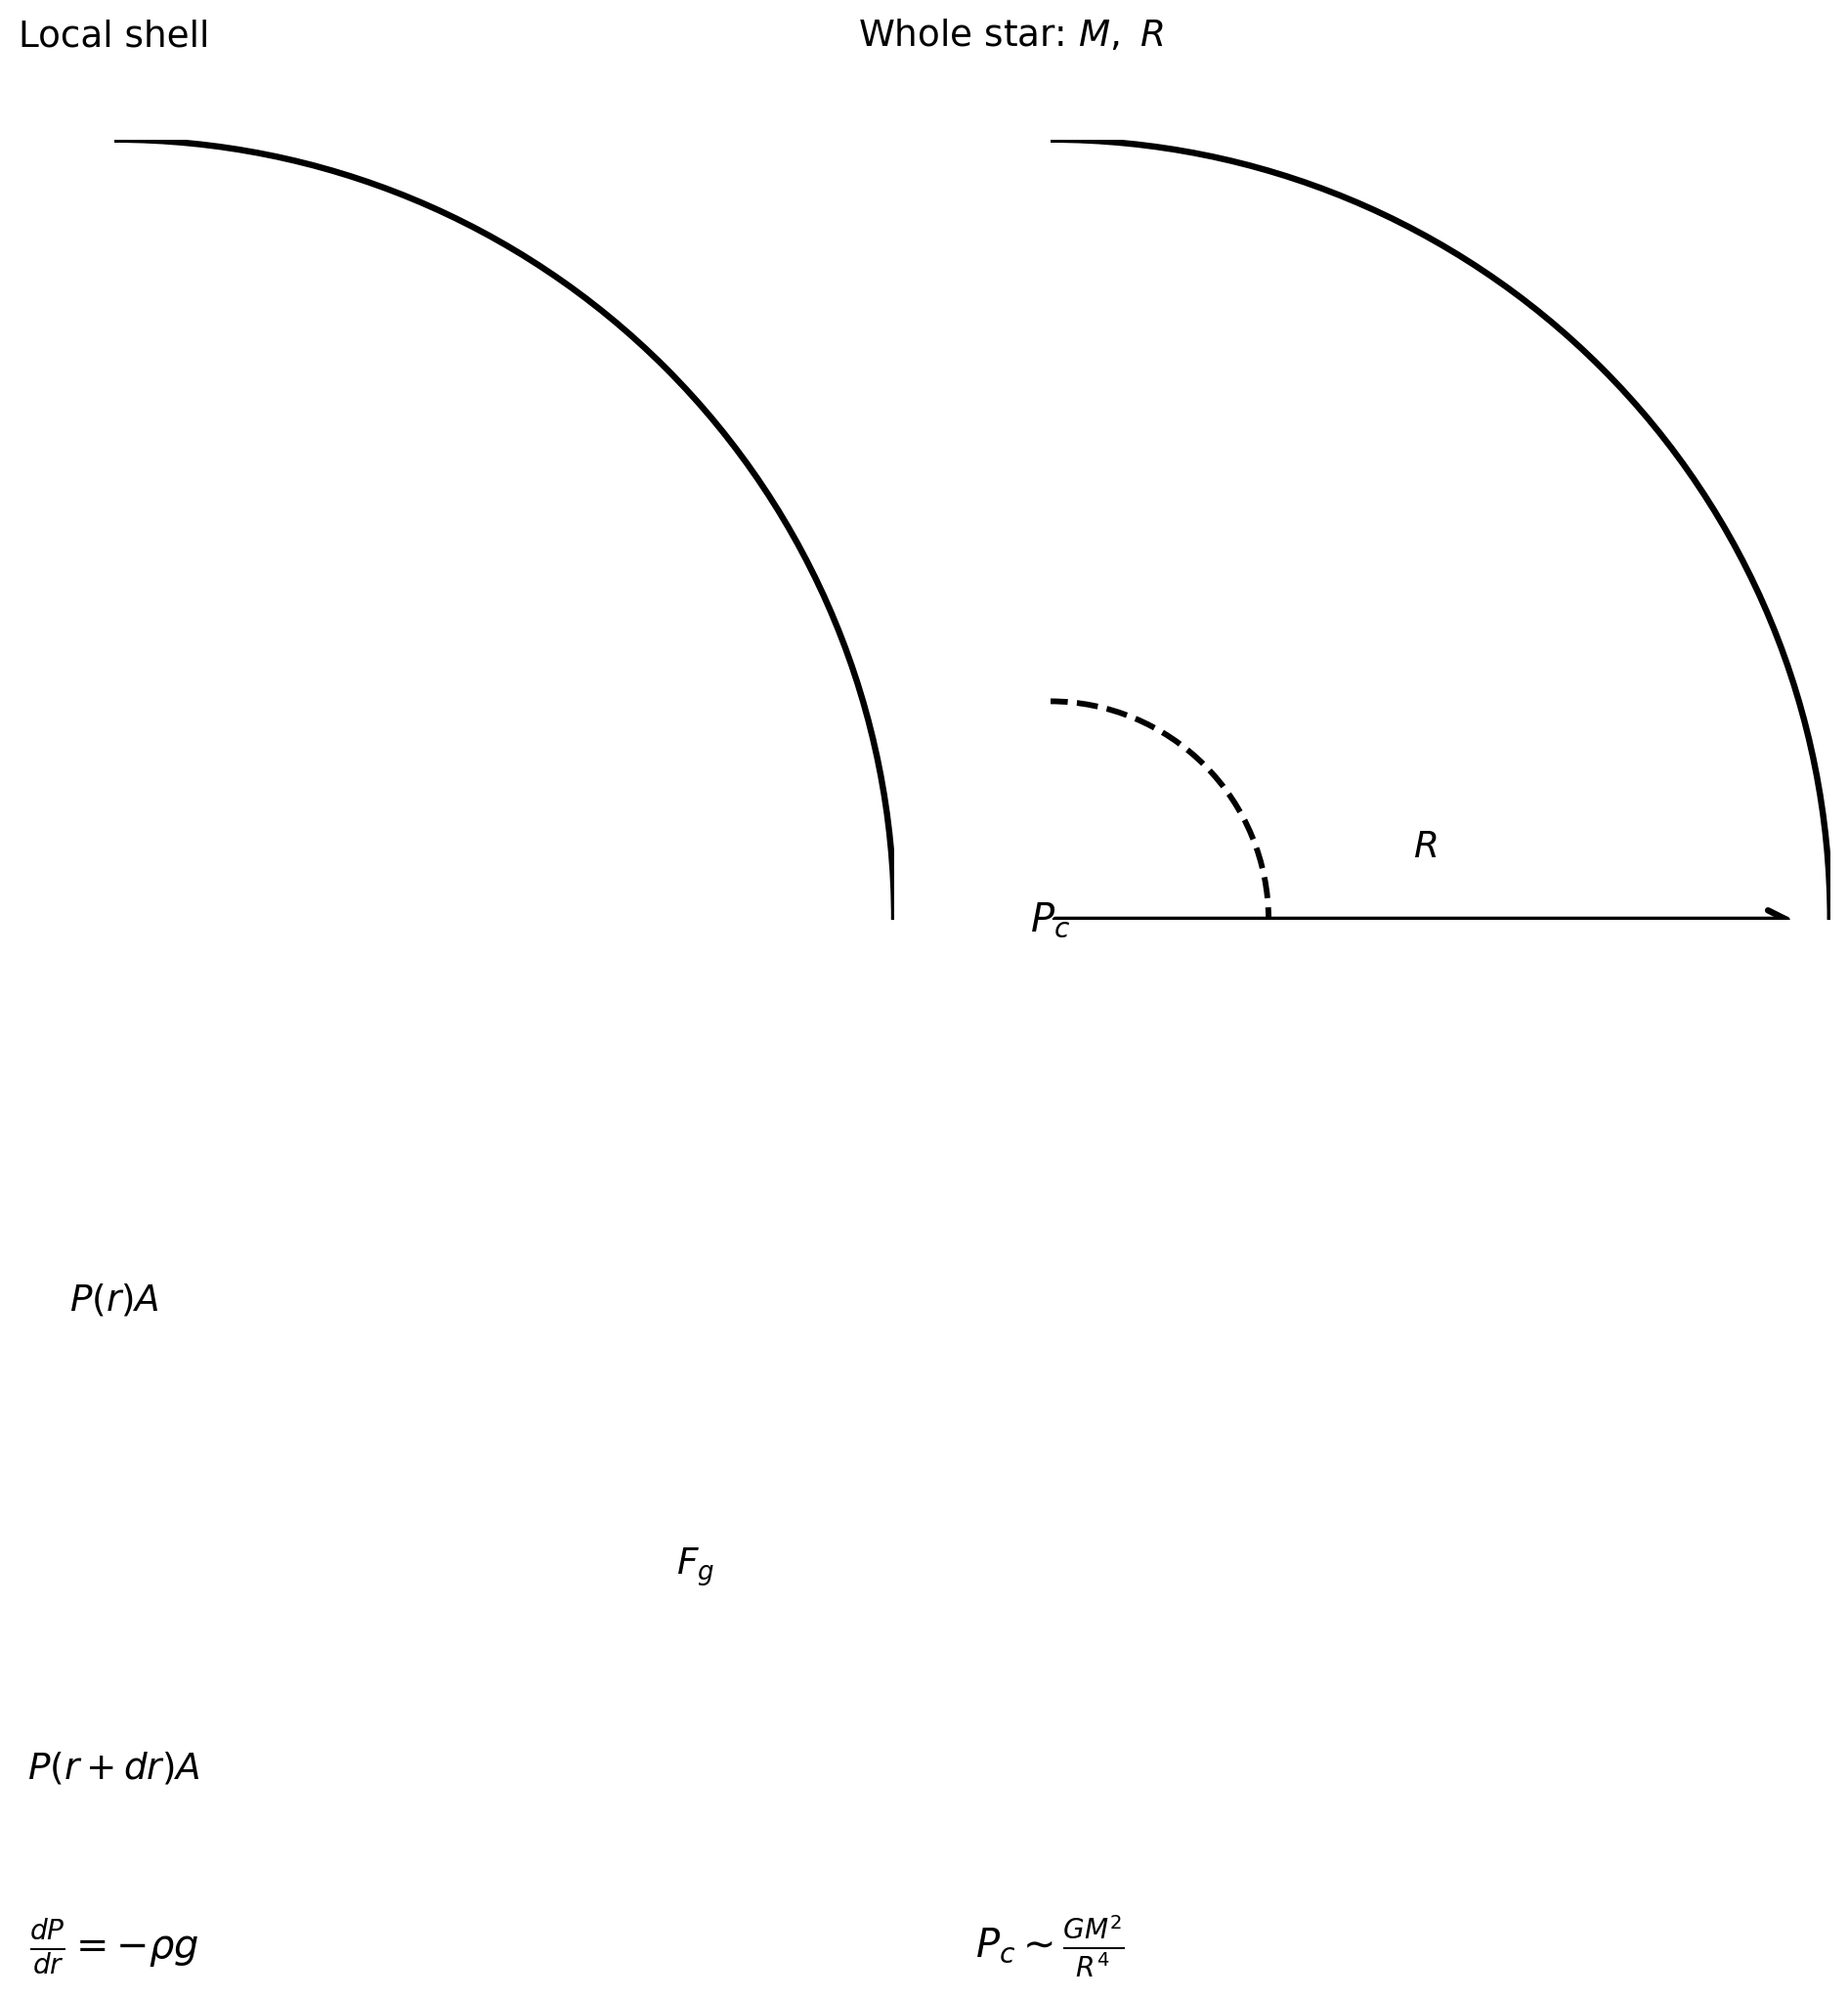
Stellar masses and radii are measurable
Stellar masses and radii can be measured, even when central conditions cannot.
Hydrostatic equilibrium plus a mean-density approximation
Apply the local force-balance law with the interior replaced by global scales, and .
The required central pressure scale is P_c ~ GM²/R⁴
The required central-pressure scale is . Massive or compact stars therefore need much larger central pressure.
Numeric answer
A star has the same mass as the Sun but half the Sun’s radius. Using , by what factor does the required central pressure increase?
Because at fixed mass, shrinking the radius by a factor of 2 gives . The required central pressure increases by a large factor: . Packing the same mass into a smaller radius makes gravity harder to balance, so the star needs a much steeper pressure gradient and a much larger central pressure.
Worked example: the Sun’s central pressure
Problem
Estimate the Sun’s central pressure from the scaling , using , , and . Express the answer in and in atmospheres.
StepEvaluate the powers
and .
StepCombine the coefficients
.
Dimensional check
. Since , this is — a pressure. ✓
Result
— about ten billion atmospheres (dividing by ). Detailed solar models give , so this estimate is low by about a factor of 20 — expected, because the Sun is centrally concentrated rather than uniform in density.
Problem
Verify that has units of pressure in CGS by tracking the units of each factor.
Using , , and : . Since , this equals — exactly the CGS unit of pressure.