Ages & Lifetimes
Section 1 of 6
What We Know and What We Do Not
By the end of this reading, you will be able to:
Every star is a clock, and its mass sets the alarm. In Module 2 you measured stellar luminosities, temperatures, radii, and masses — the HR diagram became a familiar landscape. But a snapshot doesn’t tell you how long anything lasts. A star shining at is burning through its fuel far faster than one at . How much faster? What fuel? How long until it runs out? These questions demand a new kind of reasoning — timescale reasoning — and the answers launch us into the physics of stellar structure and evolution. Timescale reasoning pays off twice. The separation between these clocks is what earns us the right to model a star as a static, balanced structure — the assumption every later reading in this module leans on — and the longest clock sets how long the star can shine.
Part 1: What We Know — and What We Don’t
The HR Diagram Is a Snapshot
In Module 2 you built the Hertzsprung-Russell diagram piece by piece — distances, luminosities, temperatures, and masses for hundreds of stars. The result is a map of the stellar population: most stars on the main sequence, with giants above and white dwarfs below. But the HR diagram is a snapshot — a single frame from a movie you haven’t seen. It shows where stars are, not how they got there or where they’re going. In a star cluster, the massive stars are already gone from the main sequence (evolved into giants or exploded) while the low-mass ones still happily burn hydrogen. That difference in lifetime is the first clue that mass controls a star’s fate.
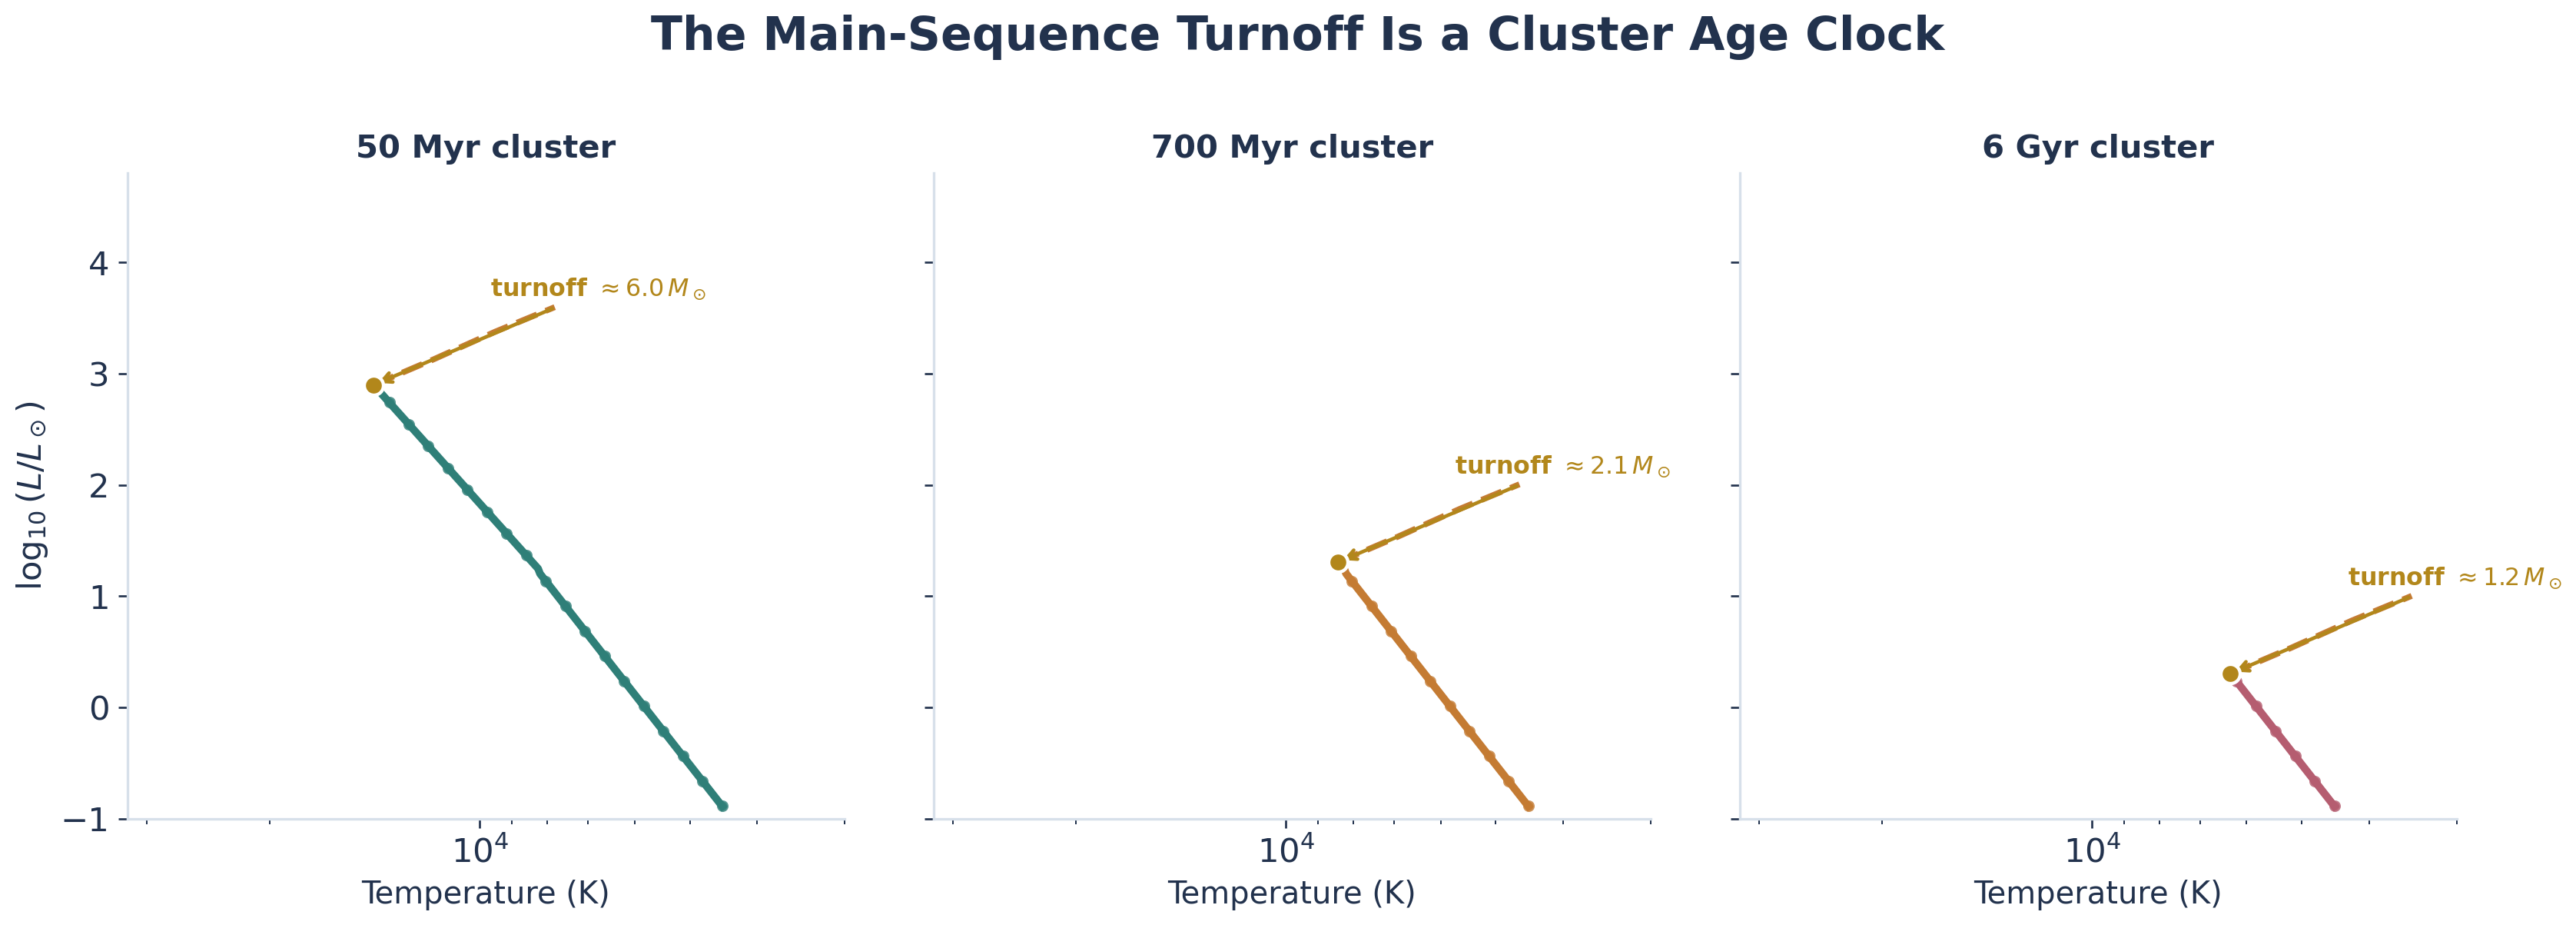
That cluster pattern is also our first age indicator. If the most massive star still on the main sequence is only about , the cluster must be old enough for stars to have already died. If a bright blue star is still on the main sequence, the cluster is young. The observational clue is the
Main-sequence turnoff
The point on a star cluster’s HR diagram where the most massive stars are just leaving the main sequence. Because nuclear lifetime falls steeply with mass, the turnoff mass is a clock: a high (blue) turnoff means a young cluster, a low (red) turnoff an old one.
The Module 3 Question
In Module 2 you asked: what can we measure about a star from its light? Now the deeper question:
Why does a star with mass have that particular luminosity, temperature, and radius — and how long can it last?
Answering it requires physics: what holds a star up against gravity, what generates its energy, and what happens when the source runs out. But first we need the timescales — because the first thing a physicist asks about any system is: how long does each process take?
Quick check
You know the mass-luminosity relation . If a star’s total fuel is proportional to its mass but its burn rate is proportional to , how should lifetime scale with mass?
Lifetime fuel / burn rate . More massive stars live much shorter lives — a factor of 10 in mass means a factor of shorter lifetime.