The Death of Giants
Section 1 of 6
Onion-Shell Burning
By the end of this reading, you will be able to:
Guiding question: massive stars build iron cores and then catastrophically collapse. Why iron? Why collapse? And how does that build the rest of the periodic table?
A star lives fast and dies violently. It burns hydrogen in its core for about , but the later stages shrink dramatically: helium burning lasts about , carbon burning about , neon burning about , oxygen burning about months, and silicon burning about day. That pattern is the point. Each new fuel requires a higher temperature, releases less energy per unit mass, and is consumed while neutrino losses become increasingly severe. The star therefore builds an onion-like structure of burning shells around an inert iron-group core.
This reading follows one causal chain from beginning to end: (1) successive burning stages build heavier elements; (2) the binding-energy curve makes iron-group nuclei the endpoint of exothermic fusion; (3) loss of pressure support triggers collapse; (4) collapse releases gravitational energy, mostly in neutrinos; (5) the explosion and neutron-capture processes enrich later generations of stars and planets. The central question is not just what happens in a massive star, but why gravity eventually wins.
Part 1: Onion-Shell Burning
The observational clue is that supernovae are not just bright flashes. Their spectra reveal heavy elements, their remnants reveal expanding layered ejecta, and in one famous case a burst of neutrinos arrived before the light. This reading explains how those measurements point back to an iron core, a collapse, and an explosion that rearranges the periodic table.
After the Main Sequence: Massive Stars
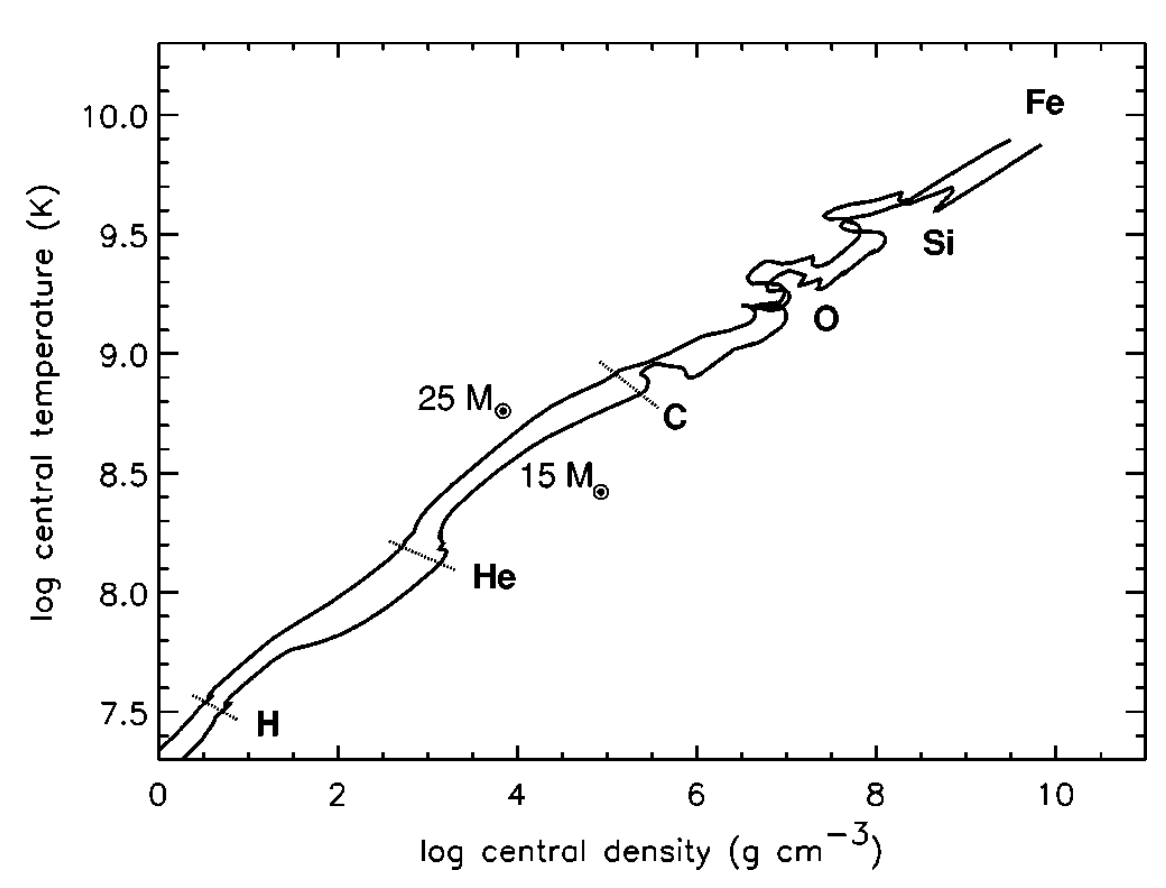
Low-mass stars () end as white dwarfs — they never get hot enough to burn carbon (Reading 2). But massive stars are different: their larger gravitational potential wells compress the core to higher temperatures after helium exhaustion, igniting carbon fusion at .
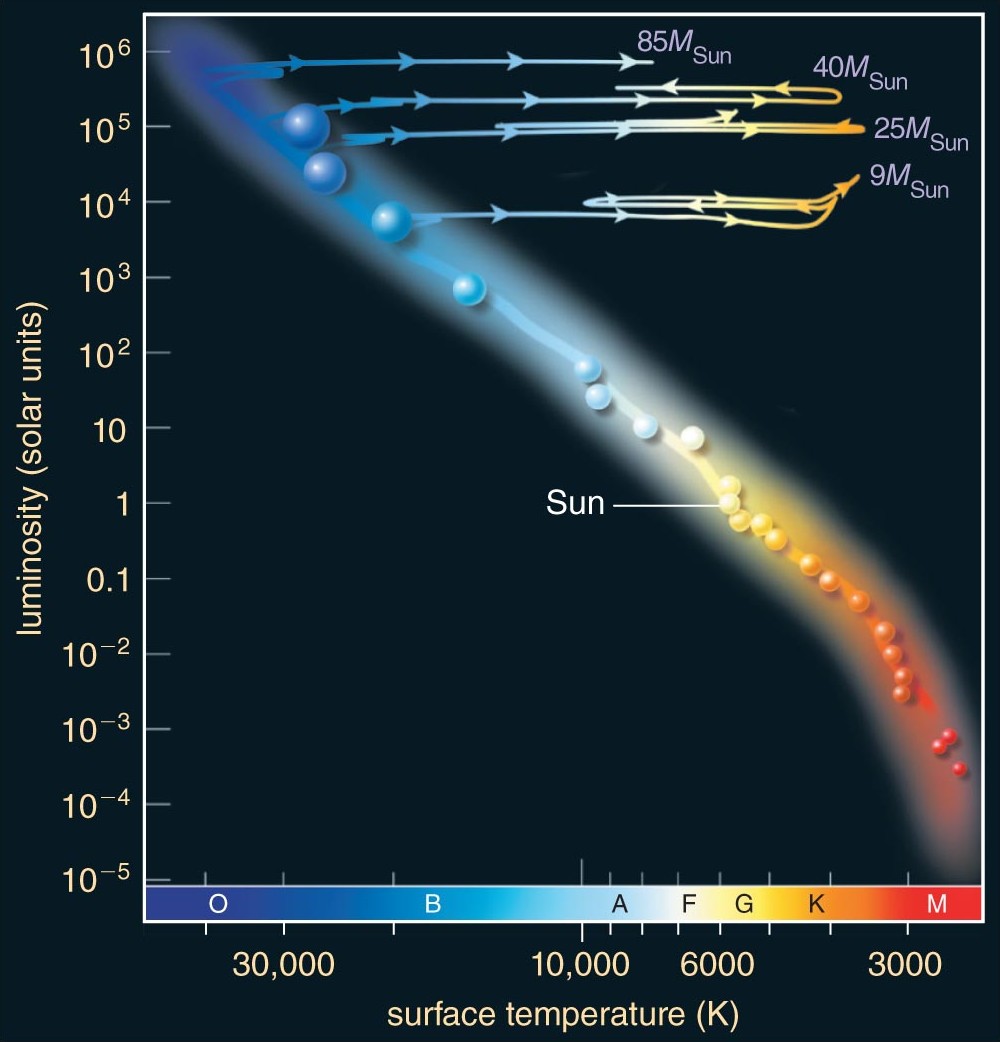
And they don’t stop there. Each time a fuel is exhausted, the core contracts further (virial theorem), heats up, and ignites the next fuel. The star builds a nested series of burning shells — like an onion, with the heaviest elements at the center. This is
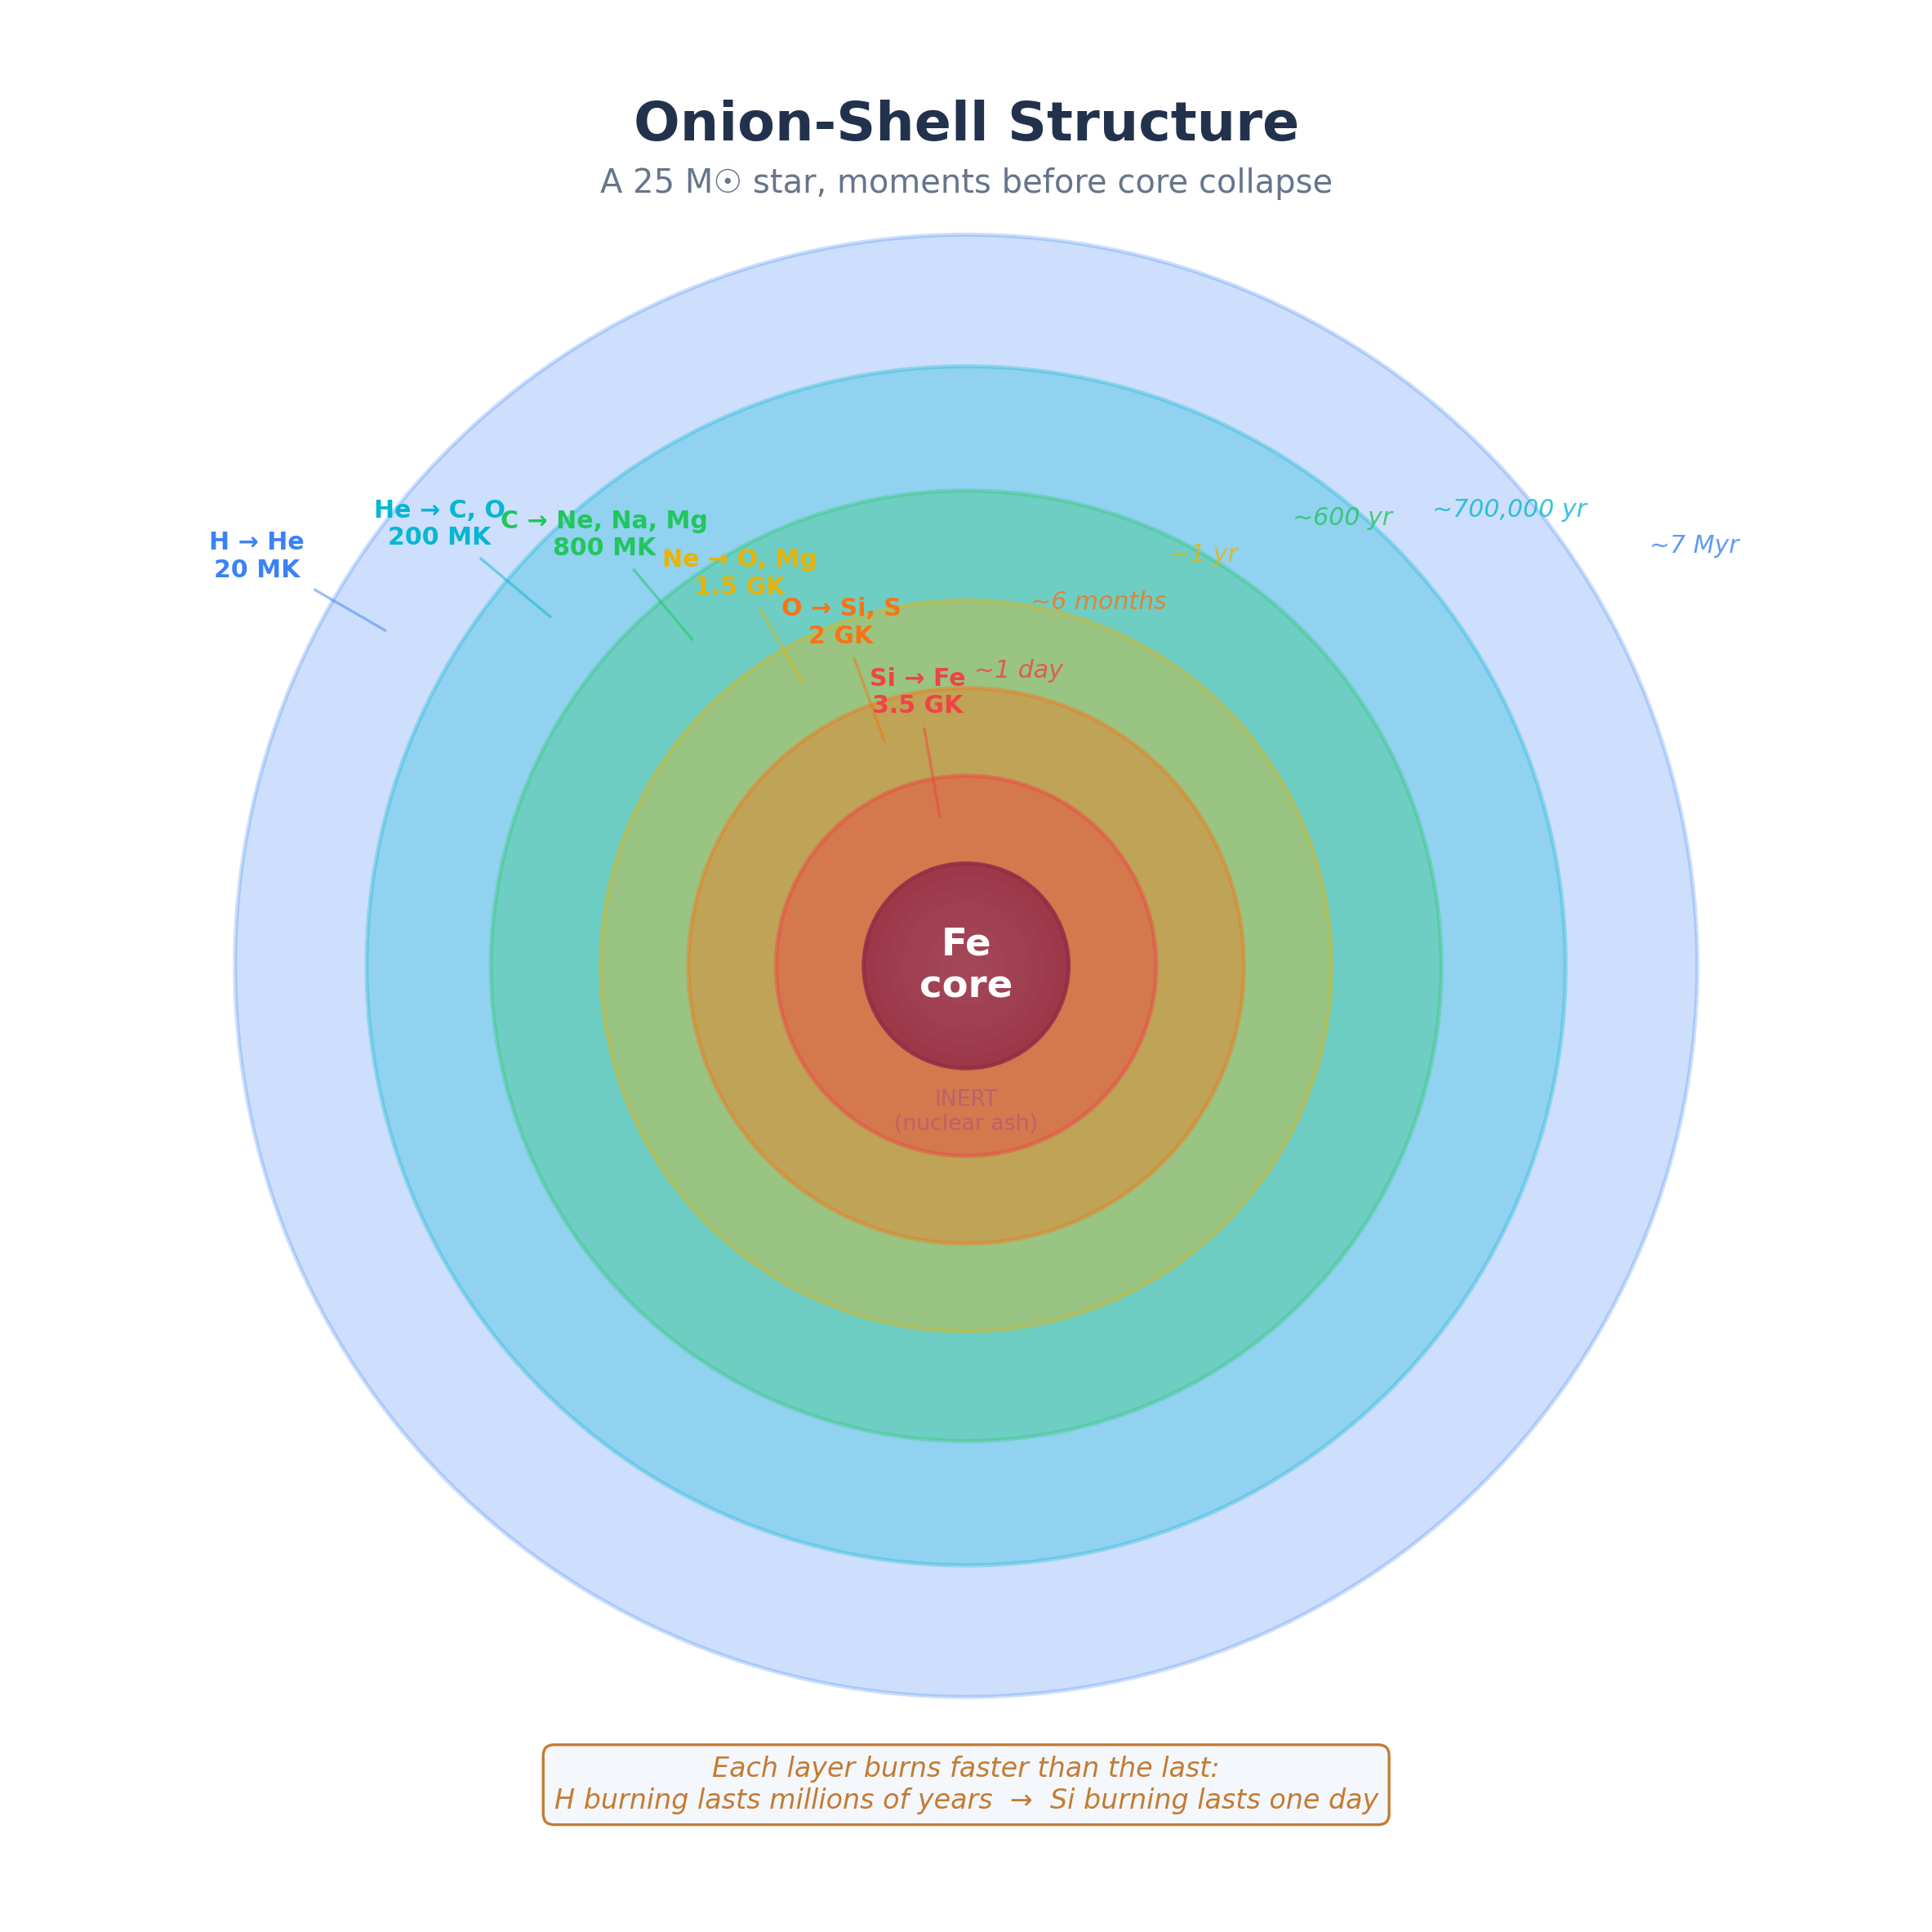
Onion-shell burning
The layered interior of an evolved massive star, in which concentric shells fuse progressively heavier fuels (H, He, C, Ne, O, Si) at higher temperatures inward, surrounding an inert iron-group core. Each inner shell burns hotter and faster than the one outside it.
| Stage | Fuel to product | Duration ( star) | |
|---|---|---|---|
| 1. Hydrogen | |||
| 2. Helium | |||
| 3. Carbon | |||
| 4. Neon | |||
| 5. Oxygen | |||
| 6. Silicon |
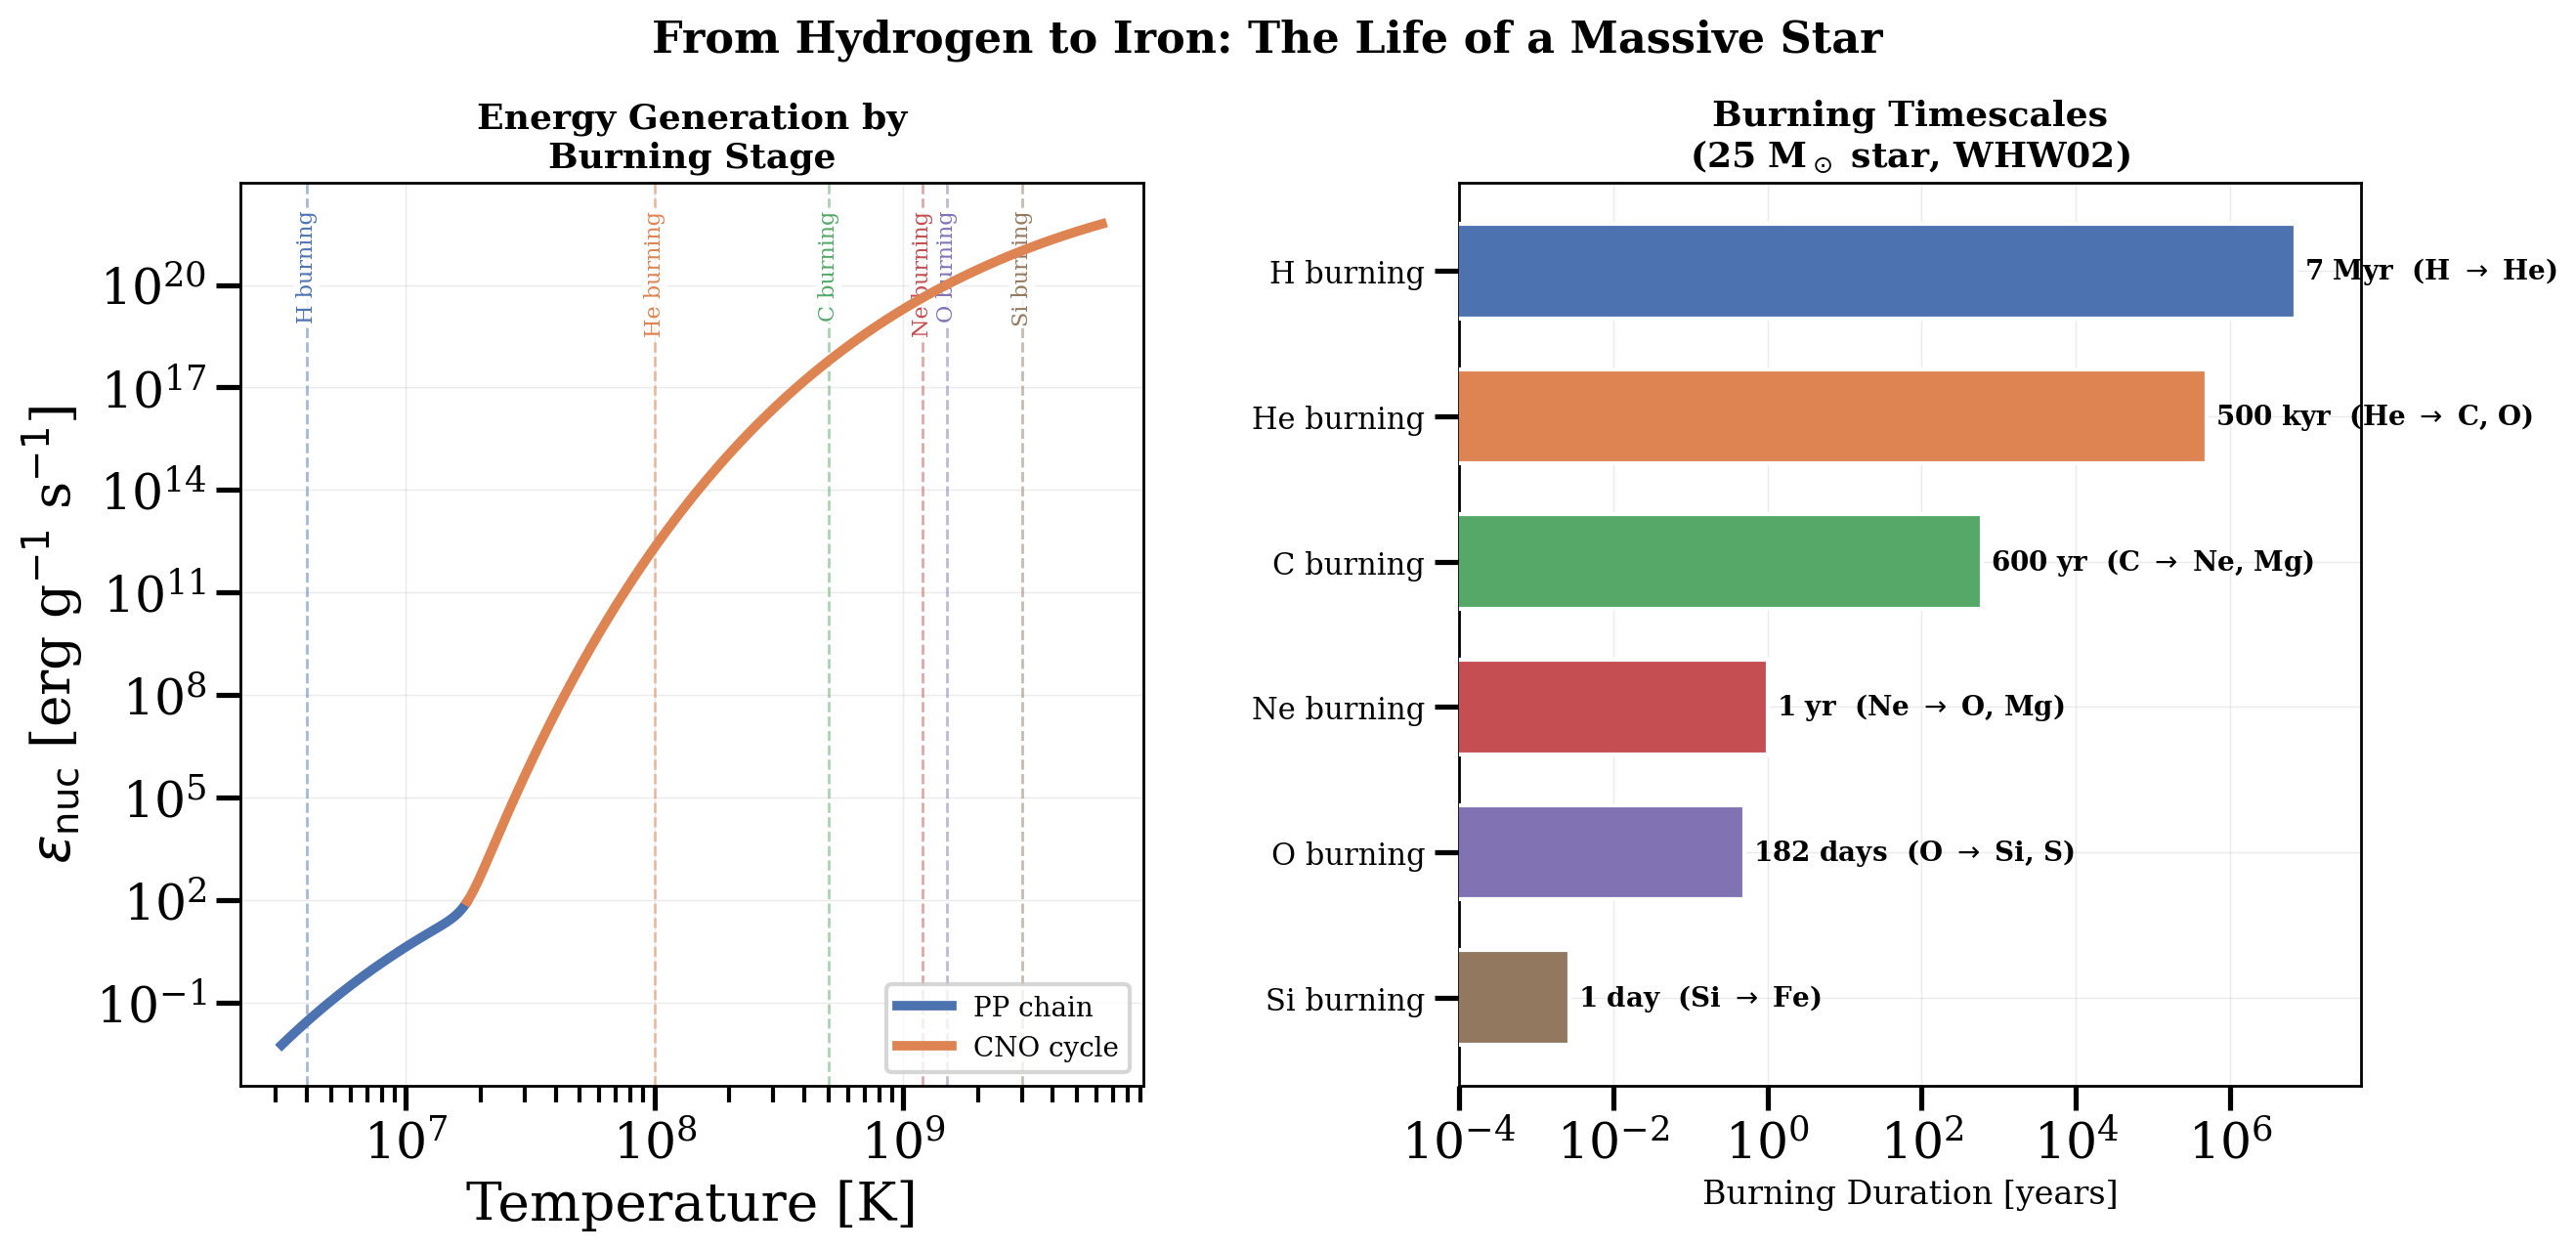
Why Each Stage Is Shorter
The accelerating timescale needs a causal explanation, not just a list of durations. A burning stage lasts roughly
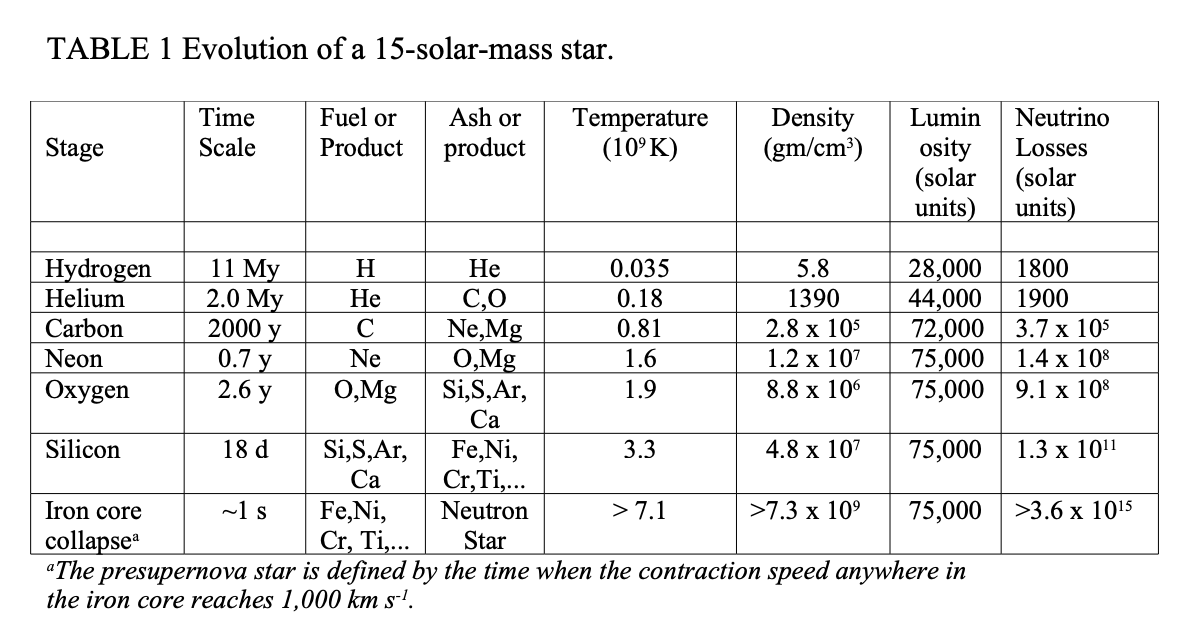
where is the energy released per unit mass of fuel (), is the fuel mass (), is the photon luminosity, and is the neutrino luminosity (). The numerator has units of energy and the denominator units of power, so the ratio has units of time: .
Each successive stage is shorter for three connected reasons:
- The Coulomb barrier is higher. Heavier nuclei have larger charge, so the core must reach a higher temperature before tunneling makes fusion fast enough to matter.
- The energy payoff is smaller. As nuclei approach the iron peak, the gain in binding energy per nucleon shrinks, so less energy is released per kilogram of fuel.
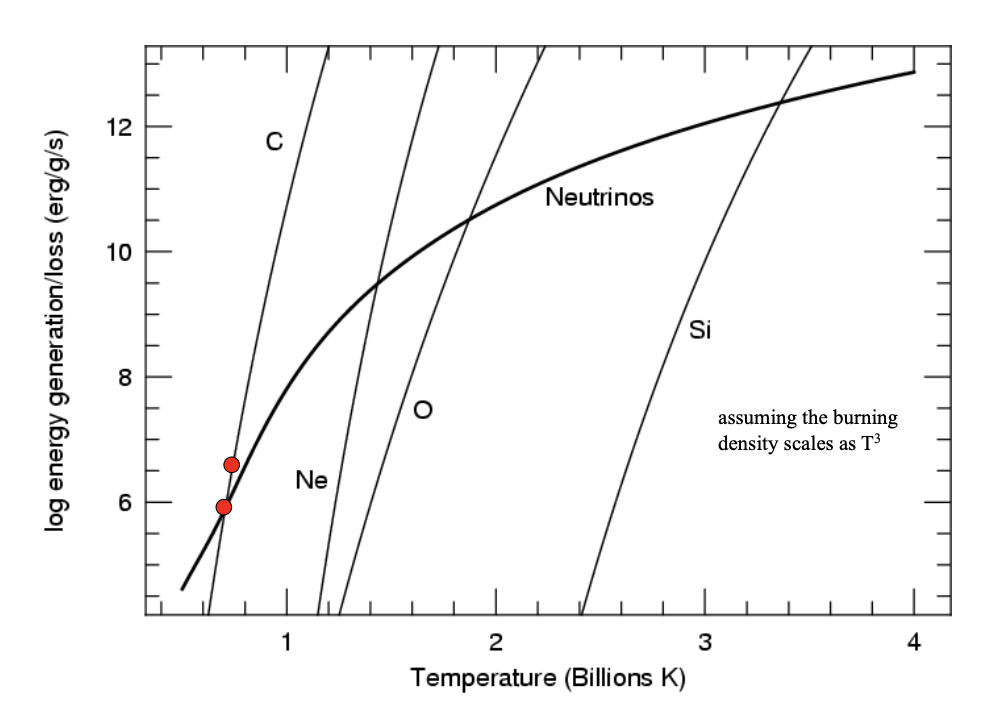
- Neutrino losses become enormous. In advanced stages the core is hot enough that neutrino-producing processes carry energy away directly. Unlike photons, neutrinos escape almost immediately, so this energy is lost instead of supporting the star.
These effects all push downward: the star gets less useful energy from each kilogram of fuel while losing energy faster.
For a star, the contrast is extreme. Converting one day to years, , so
The years cancel, so the ratio is dimensionless. Silicon burning lasts less than one-billionth of the hydrogen-burning lifetime.
Multiple choice
If neutrino losses were turned off during the late burning stages, would carbon/oxygen/silicon burning last longer, shorter, or about the same?
They would last longer. With and in advanced stages, neutrinos dominate the denominator. Remove them and the star need not burn fuel so fast to maintain pressure support. The late stages would still be shorter than hydrogen burning (higher Coulomb barrier, smaller energy release), but far less compressed in time — the same energy reservoir divided by a much smaller loss rate gives a longer .
Quick check
Why does each successive burning stage require a higher ignition temperature?
Each successive fuel has nuclei with larger atomic number — carbon (), oxygen (), silicon () — and the Coulomb barrier scales as . For carbon-carbon fusion (versus for proton-proton), so the barrier is much higher. Even with quantum tunneling the probability drops exponentially with barrier height, so each stage needs a substantially higher temperature to reach a meaningful rate. That is why the onion layers run hottest at the center.