Weighing Stars
Section 4 of 4
The Mass–Luminosity Relation and Synthesis
Part 4: The Mass-Luminosity Relation — The Empirical Payoff
Multiple choice
The Sun () has . A main-sequence star with twice the Sun’s mass is how much more luminous?
(c). Using with : . Doubling mass raises luminosity by about an order of magnitude — not or .
Building the Relation from Data
Astronomers have spent over a century measuring binary-star masses. For each system with individual masses, the luminosity is also measured (from apparent brightness and distance). You might expect a mess — stars differ in composition, age, rotation, evolutionary state. But when you plot mass against luminosity, both in solar units, both logarithmic, the expected scatter simply isn’t there.
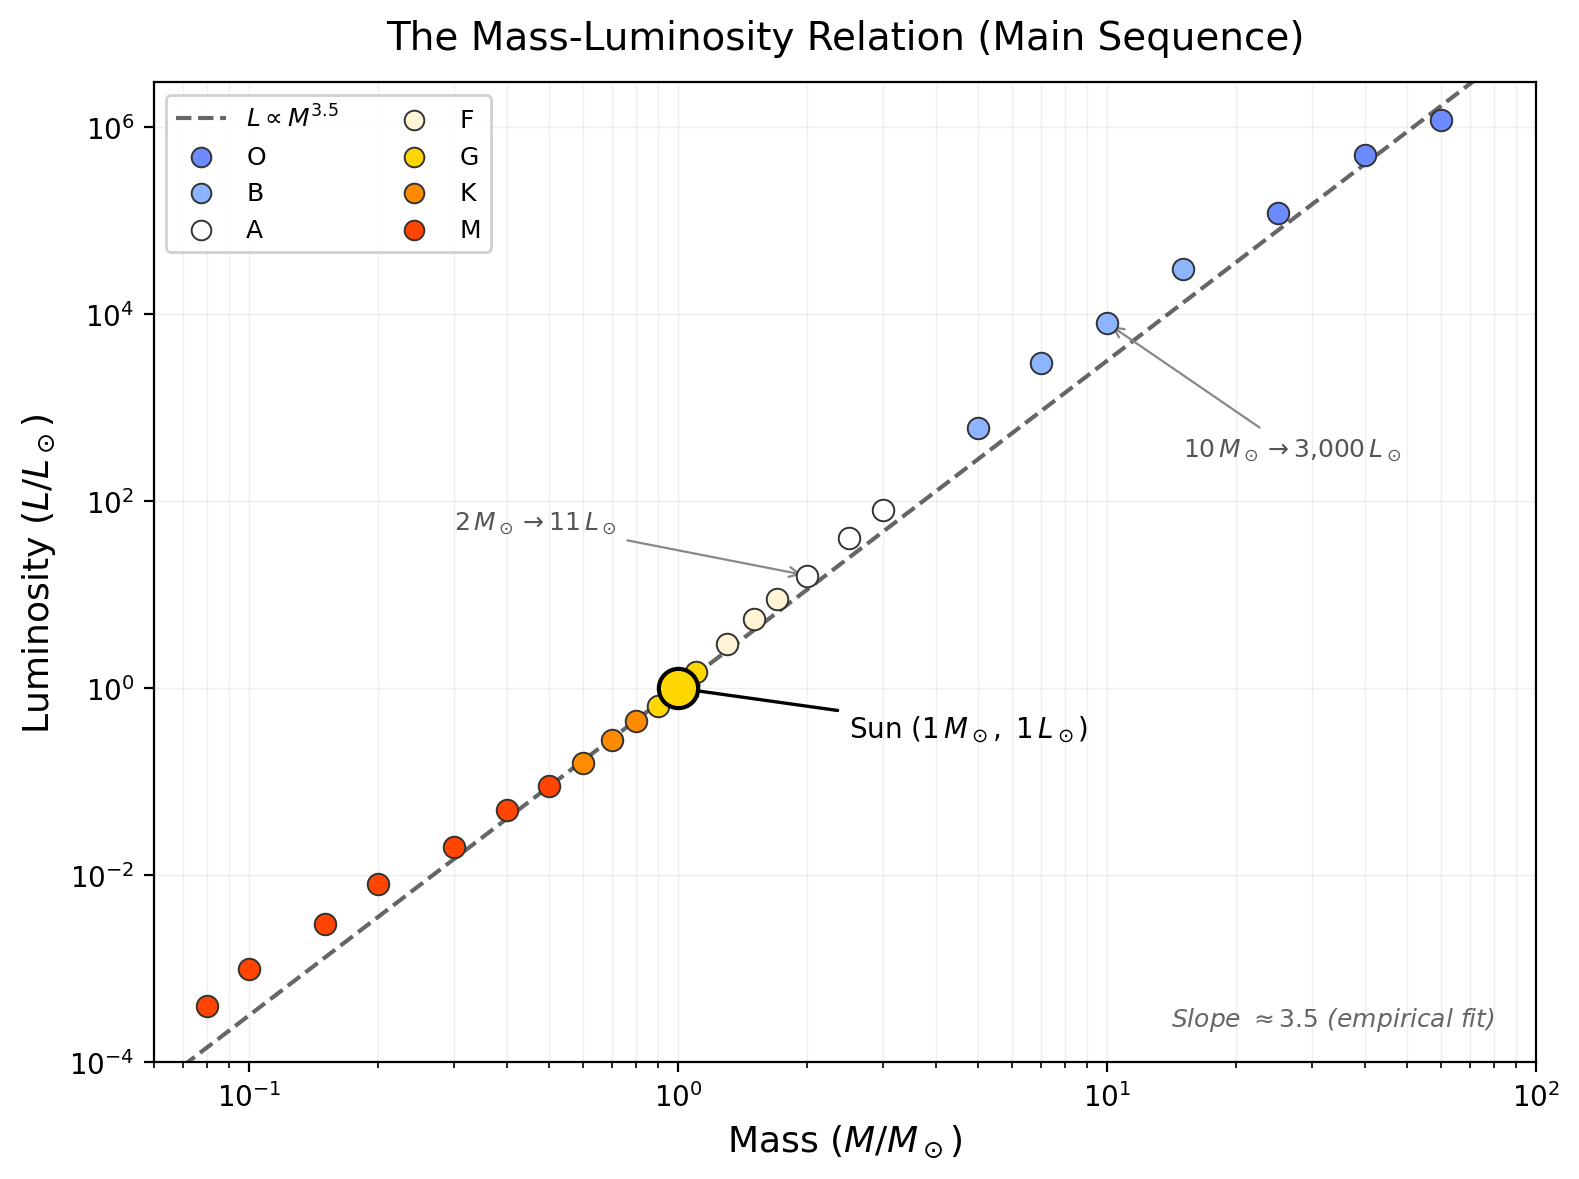
The idealized power law captures the trend; real data have scatter:
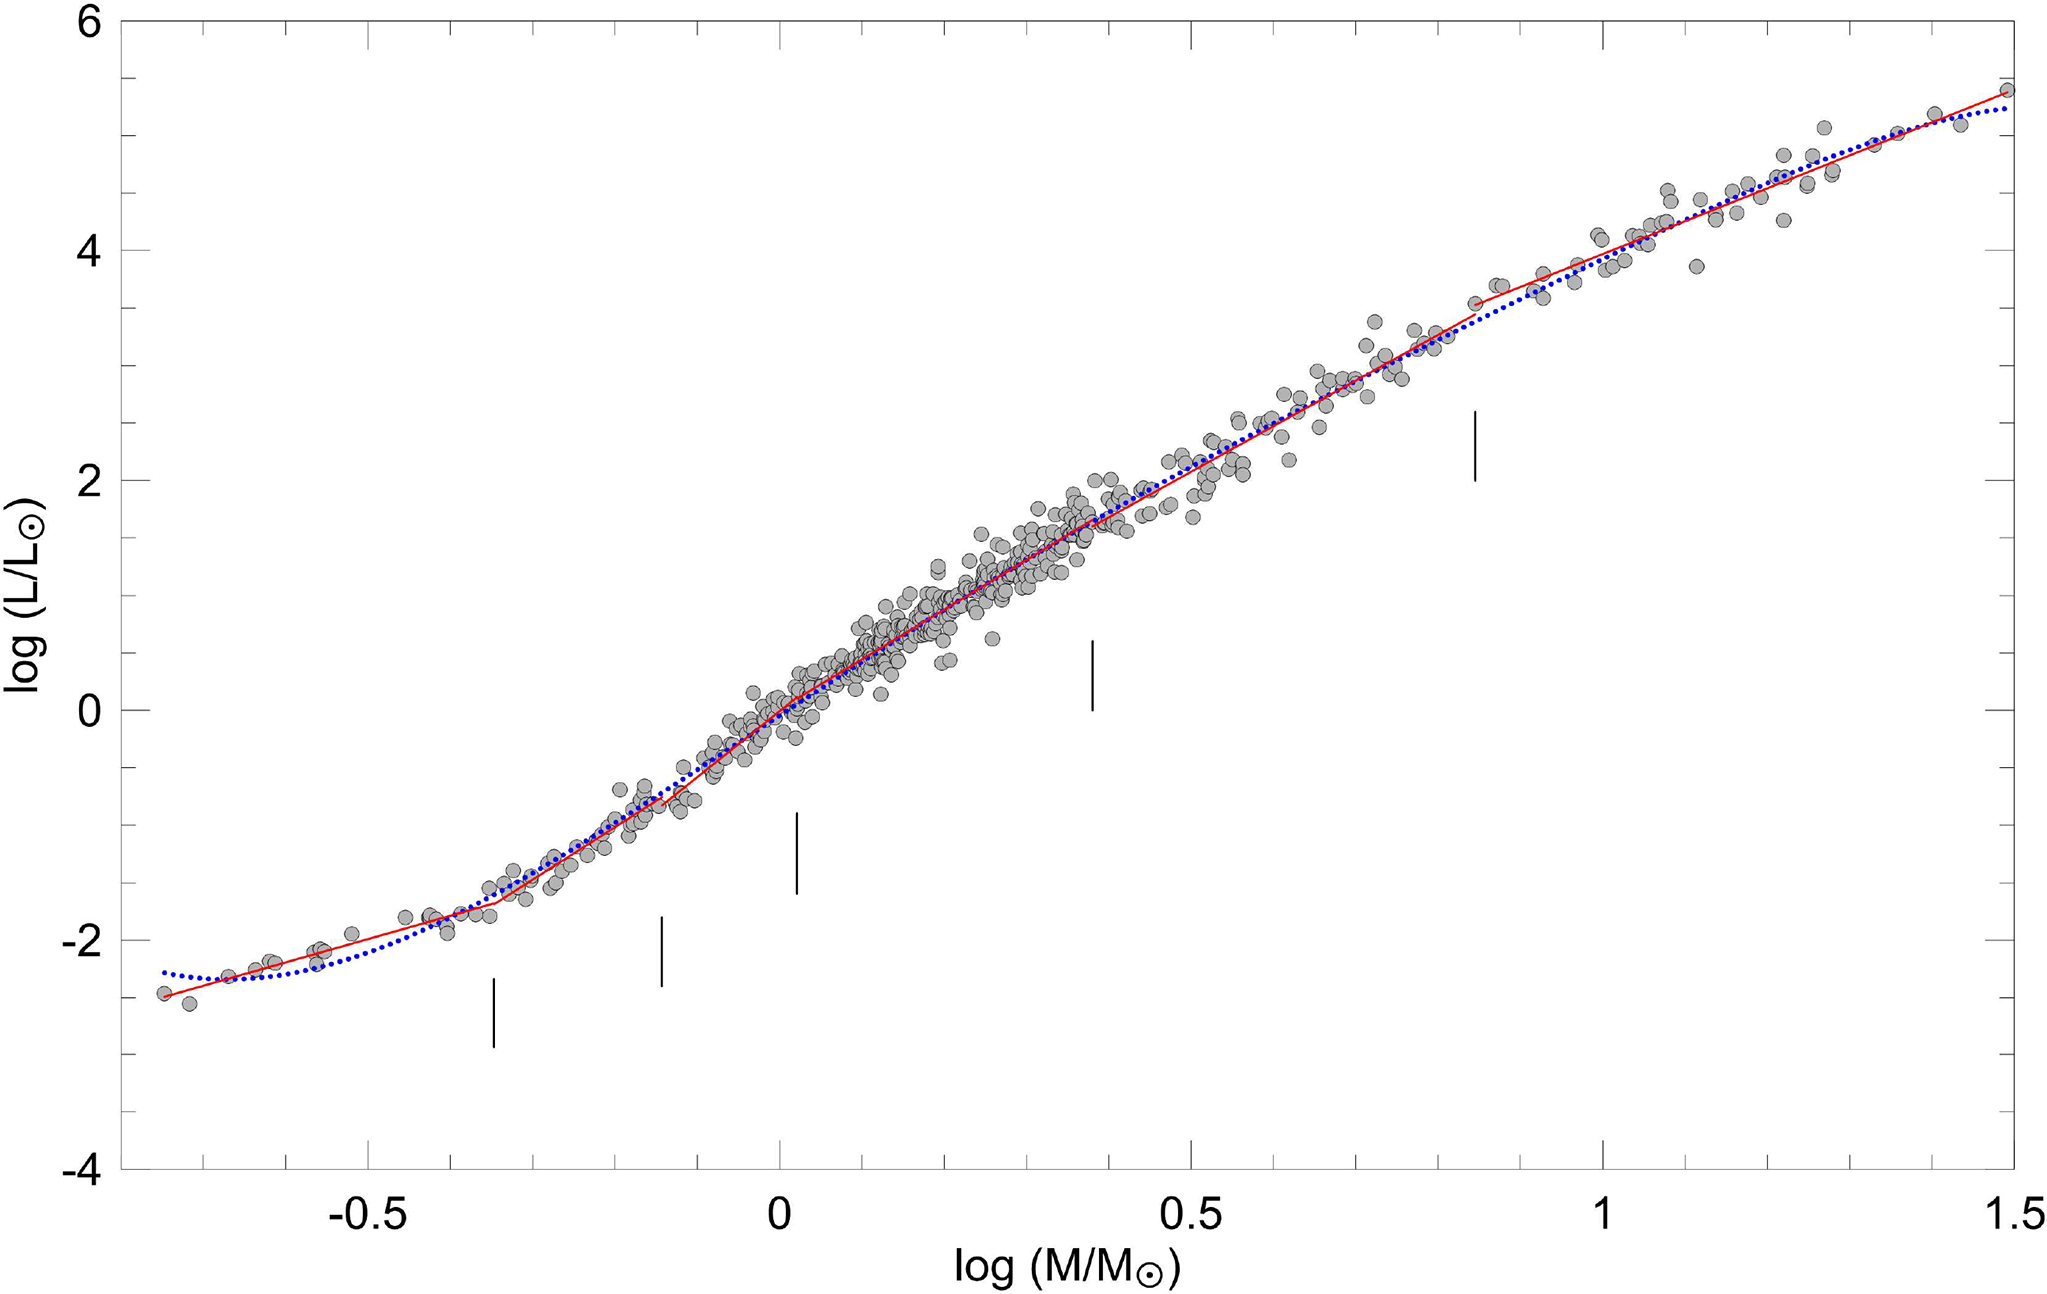
Main-sequence stars fall on a tight power law — the
The exponent is the lever arm: a small shift in mass produces a disproportionate shift in luminosity, so the main sequence is a mass sequence in disguise. In Module 3, the same leverage reappears in evolution — timescales and stellar endpoints trace back to how sharply luminosity responds to mass.
Mass-luminosity relation
The empirical scaling for main-sequence stars, calibrated entirely from binary-star masses. The steep exponent makes mass the master variable that predicts luminosity, lifetime, and fate.
The exponent is an approximation — slightly steeper at high masses (about above ) and shallower at low masses (about below ) — but it captures the essential behavior across a wide range.
What the Relation Tells Us
A modest change in mass produces a dramatic change in luminosity:
| Mass () | Factor vs. Sun | |
|---|---|---|
| fainter | ||
| fainter | ||
| the Sun | ||
| brighter | ||
| brighter | ||
| brighter |
The full range of main-sequence masses (about to ) spans roughly three orders of magnitude in mass — but the luminosity range spans ten orders of magnitude.
Why Mass Controls Lifetime
Once luminosity scales this steeply, lifetime becomes an exponent game. A star’s fuel scales with its mass ; its luminosity — the burn rate — scales as , so .
More massive stars live much shorter lives. The Sun’s main-sequence lifetime is about . A star lives — roughly 300 times shorter. A star lives . Pause on that: the universe is old, so a red dwarf born at the Big Bang is not even a quarter through its main-sequence life. Every low-mass star that has ever formed is still shining today. The graveyard of stellar evolution holds only the remains of massive stars — the ones that burned bright and fast.
Problem
- Estimate the luminosity of a main-sequence star.
- Estimate its main-sequence lifetime (Sun’s is ).
- Two main-sequence stars have and . Estimate the ratio of their masses.
- Why does the mass-luminosity relation apply only to main-sequence stars?
- .
- .
- .
- The exponent is calibrated for hydrogen-burning main-sequence stars. Giants’ luminosity depends on evolutionary state, not just mass; white dwarfs shine from stored heat, not fusion.
Observable → Model → Inference: The Binary Star Chain
Periodic shifts in spectral-line wavelengths (and brightness dips, if eclipsing)
A star’s lines oscillate blueshift-to-redshift over the orbital period; in eclipsing systems the combined light dips on the same cycle. Both are time-domain measurements.
Two stars orbiting a common center of mass under Newtonian gravity
Kepler’s third law connects the orbit to the total mass; the center-of-mass condition (Newton’s third law) connects the velocity amplitudes to the mass ratio.
Individual stellar masses — and, across many systems, the mass-luminosity relation
From , , , we get and ; from a large sample, , the most important empirical scaling in stellar astrophysics.
The inference runs as a cascade: the measured quantities (, , , and if eclipsing, or if visual with distance) feed the two-body model, which yields the orbital scale ( or ), then the dynamical outputs ( and ), then the individual masses (, ) — and finally the downstream physics: stellar fate.
You measure both radial-velocity amplitudes (, ) and the period of a double-lined spectroscopic binary. Can you report the two stellar masses? What single extra fact would you need to be sure?
Not exactly — and give the mass ratio (, inclination-independent) and the total mass only up to a factor, so you get (a lower limit). The missing fact is the inclination ; if the system also eclipses, and the masses become exact.
Summary: The Last Piece
- Mass is the master variable — it determines luminosity, temperature, radius, lifetime, and death. But it can’t be measured from a single star’s light.
- Binary stars reveal masses through orbital dynamics — visual binaries give orbits on the sky, spectroscopic binaries give Doppler velocities, eclipsing binaries give inclination and radii.
- Newton’s Kepler III for binaries () gives the total mass; the center-of-mass condition () gives the mass ratio from the velocity ratio.
- The mass-luminosity relation () is the most important empirical scaling in stellar astrophysics — a factor of 10 in mass produces in luminosity.
- Lifetime scales as — massive stars burn bright and die young; low-mass stars are dim but nearly eternal.
Glossary
- Center of mass
The balance point of a system, about which both stars orbit. For a binary it lies on the line joining the stars, always closer to the heavier one, fixed by .
- Eclipsing binary
A binary whose orbit is nearly edge-on, so the stars periodically eclipse each other. The eclipses pin the inclination near and reveal the relative stellar radii and temperature ratio.
- Inclination
The tilt angle of an orbital plane relative to the plane of the sky: is edge-on (eclipses possible, full radial velocity) and is face-on (no Doppler signal). It enters binary masses as a factor.
- Light curve
A plot of a source’s brightness versus time. For an eclipsing binary, the spacing, depth, and shape of its dips encode the period, radii, and temperature ratio.
- Main sequence
The band on the H–R diagram where stars spend most of their lives in stable hydrogen-core fusion. A main-sequence star’s position is set almost entirely by its mass.
- Mass ratio
The ratio of the two stellar masses — equal to the inverse ratio of their orbital sizes () and to the ratio of their velocity amplitudes (), independent of inclination.
- Mass-luminosity relation
The empirical scaling for main-sequence stars, calibrated entirely from binary-star masses. The steep exponent makes mass the master variable that predicts luminosity, lifetime, and fate.
- Spectroscopic binary
A binary detected from the periodic Doppler oscillation of its spectral lines as the stars orbit. It yields the period and radial-velocity amplitude even when the pair is far too close to resolve.
- Visual binary
A binary whose two stars are individually resolved through a telescope, so their orbits can be traced directly on the sky over years to decades.
- White dwarf
The dense, Earth-sized remnant left when a low- or intermediate-mass star exhausts its fuel — about a solar mass packed into a planetary volume, shining only from stored heat.