The HR Diagram
Section 3 of 6
The Theorist's HR Diagram
Part 3: The Theorist’s HR Diagram — Overlaying Physics
Same Patterns, Physical Axes
The observer’s diagram uses and spectral type. Theorists prefer physical quantities: luminosity (in ) and effective temperature (in K), related through calibrations — via the magnitude-luminosity relation, spectral type (e.g. G2 → ). The conversion is:
(treating the -band as a proxy for bolometric here). The theorist’s HR diagram plots against , temperature decreasing rightward. The remarkable fact: the same patterns appear on both versions — so they are real features of stellar physics, not artifacts of the measurement system.
Lines of Constant Radius
The theorist’s diagram lets you overlay theoretical relationships, the most important from the Stefan-Boltzmann law:
This connects , , and . On the HR diagram and are the axes, so fixing defines a line: (at fixed ).
These lines of constant radius are diagonals on the theorist’s HR diagram — each represents all combinations of and for a star of a given radius.
Numeric answer
At fixed radius, if a star’s temperature doubles, by what factor does its luminosity change?
Luminosity increases steeply: at fixed , so doubling gives . Same radius, much hotter surface, dramatically brighter.
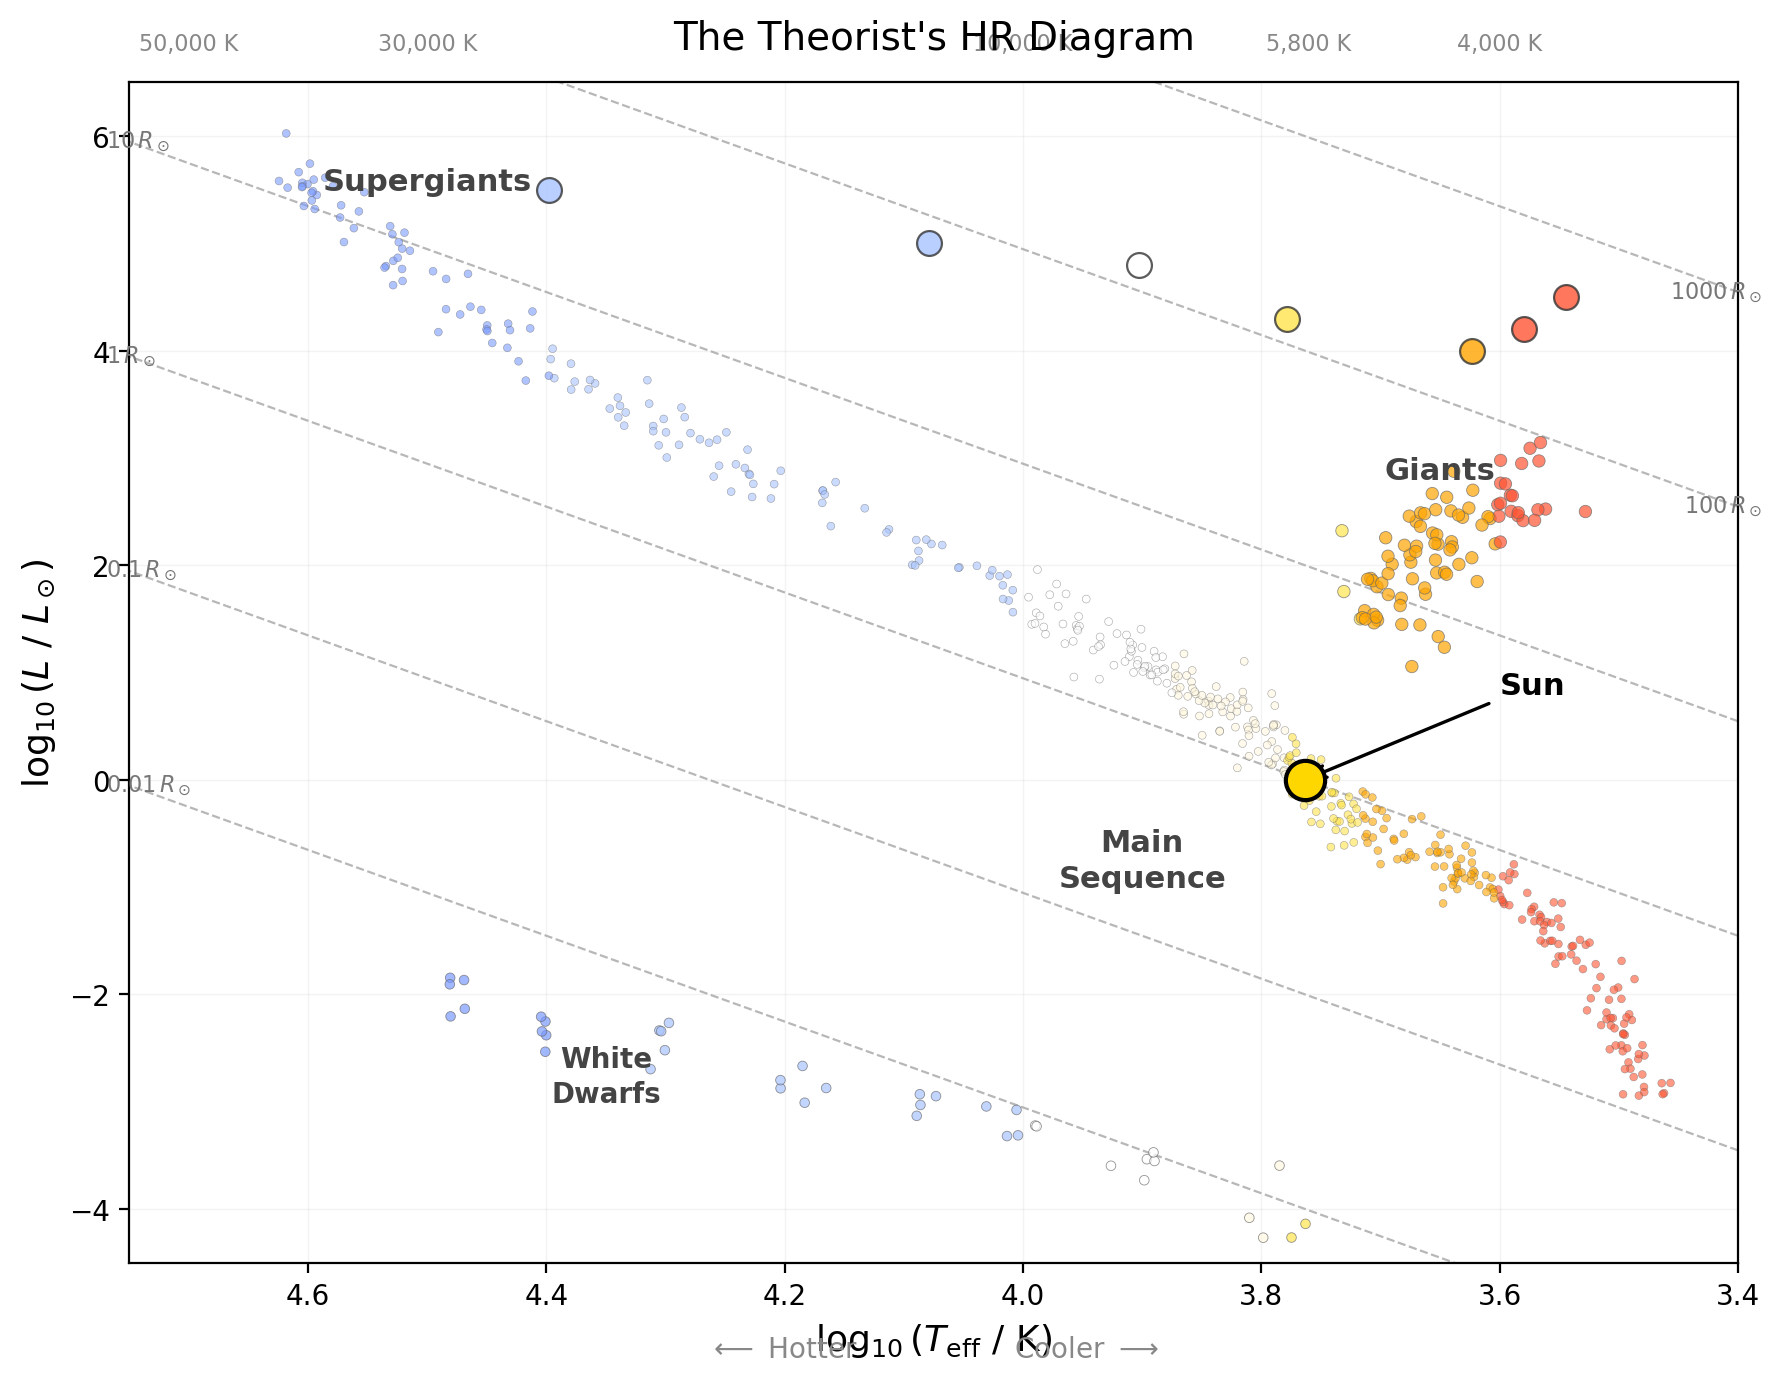
Reading the diagram with radius lines: main-sequence stars span (M dwarfs) to (O stars); giants sit on lines (luminous despite being cool); supergiants reach ; white dwarfs sit on lines (faint despite being hot).
Problem
A red giant has and . What is its radius compared to the Sun ()?
StepUse the ratio form (no CGS constants)
StepEvaluate
Dimensional check
All quantities are solar ratios — units cancel; the answer is in solar radii ✓.
Result
The red giant has — typical for the red giant branch. Placed at the Sun’s center it would reach about halfway to Mercury ✓.
Problem
- On the theorist’s HR diagram, which way do lines of constant radius slope?
- A white dwarf has and . Estimate its radius in .
- Where would a star with and appear? Is such a star observed?
- at fixed , so constant- lines slope upward to the left (hotter = more luminous, with the reversed temperature axis).
- — roughly Earth-sized ✓.
- — hot and moderately luminous, above and left of the Sun. Real B-type stars there are usually more luminous (larger radii), so this is a useful thought experiment.
Part 2 built a map from measurements alone; Part 3 added radius. But neither tells us what orders stars along the main sequence. To explain that, we need the hidden parameter that sets both luminosity and temperature: mass.