Ages & Lifetimes
Section 4 of 6
The Nuclear Timescale
Part 4: The Nuclear Timescale — The True Clock
Nuclear fusion converts a fraction of hydrogen’s rest-mass energy into radiation. Only the core hydrogen participates — roughly of the total mass for a Sun-like star — so the accessible fuel is . Dividing that reservoir by the luminosity gives the
Here is the conversion efficiency, the accessible fuel fraction for a Sun-like star, the total mass, and the speed of light. The equation is for main-sequence hydrogen burning, and varies with mass and mixing.
Nuclear timescale
The time core hydrogen fusion can sustain a star’s luminosity: — about 10 Gyr for the Sun. It is the longest of the three clocks and sets a star’s true main-sequence lifetime.
Problem
Estimate the Sun’s nuclear lifetime with , , , , .
StepReservoir over luminosity
Dimensional check
✓.
Result
— about twice the Sun’s current age (), so the Sun is roughly halfway through its hydrogen-burning life. Consistent with solar models and radiometric dating ✓.
Why Normalize to the Sun?
Rather than plug in constants every time, normalize to the Sun: write the equation for the star, write it for the Sun, and divide. The constants cancel and the answer is a dimensionless comparison to a star you know:
For similar hydrogen-burning stars matches (first factor 1), and for a rough comparison with similar fuel fractions this simplifies to . A value of means “one-fifth of the Sun’s lifetime.” Same grammar as Kelvin-Helmholtz — reservoir over loss rate — but a nuclear reservoir.
Quick ratio example. A star with and gives , so . Note the grammar: the scaling factor is dimensionless, and units appear only at the end.
The Scaling That Explains Everything
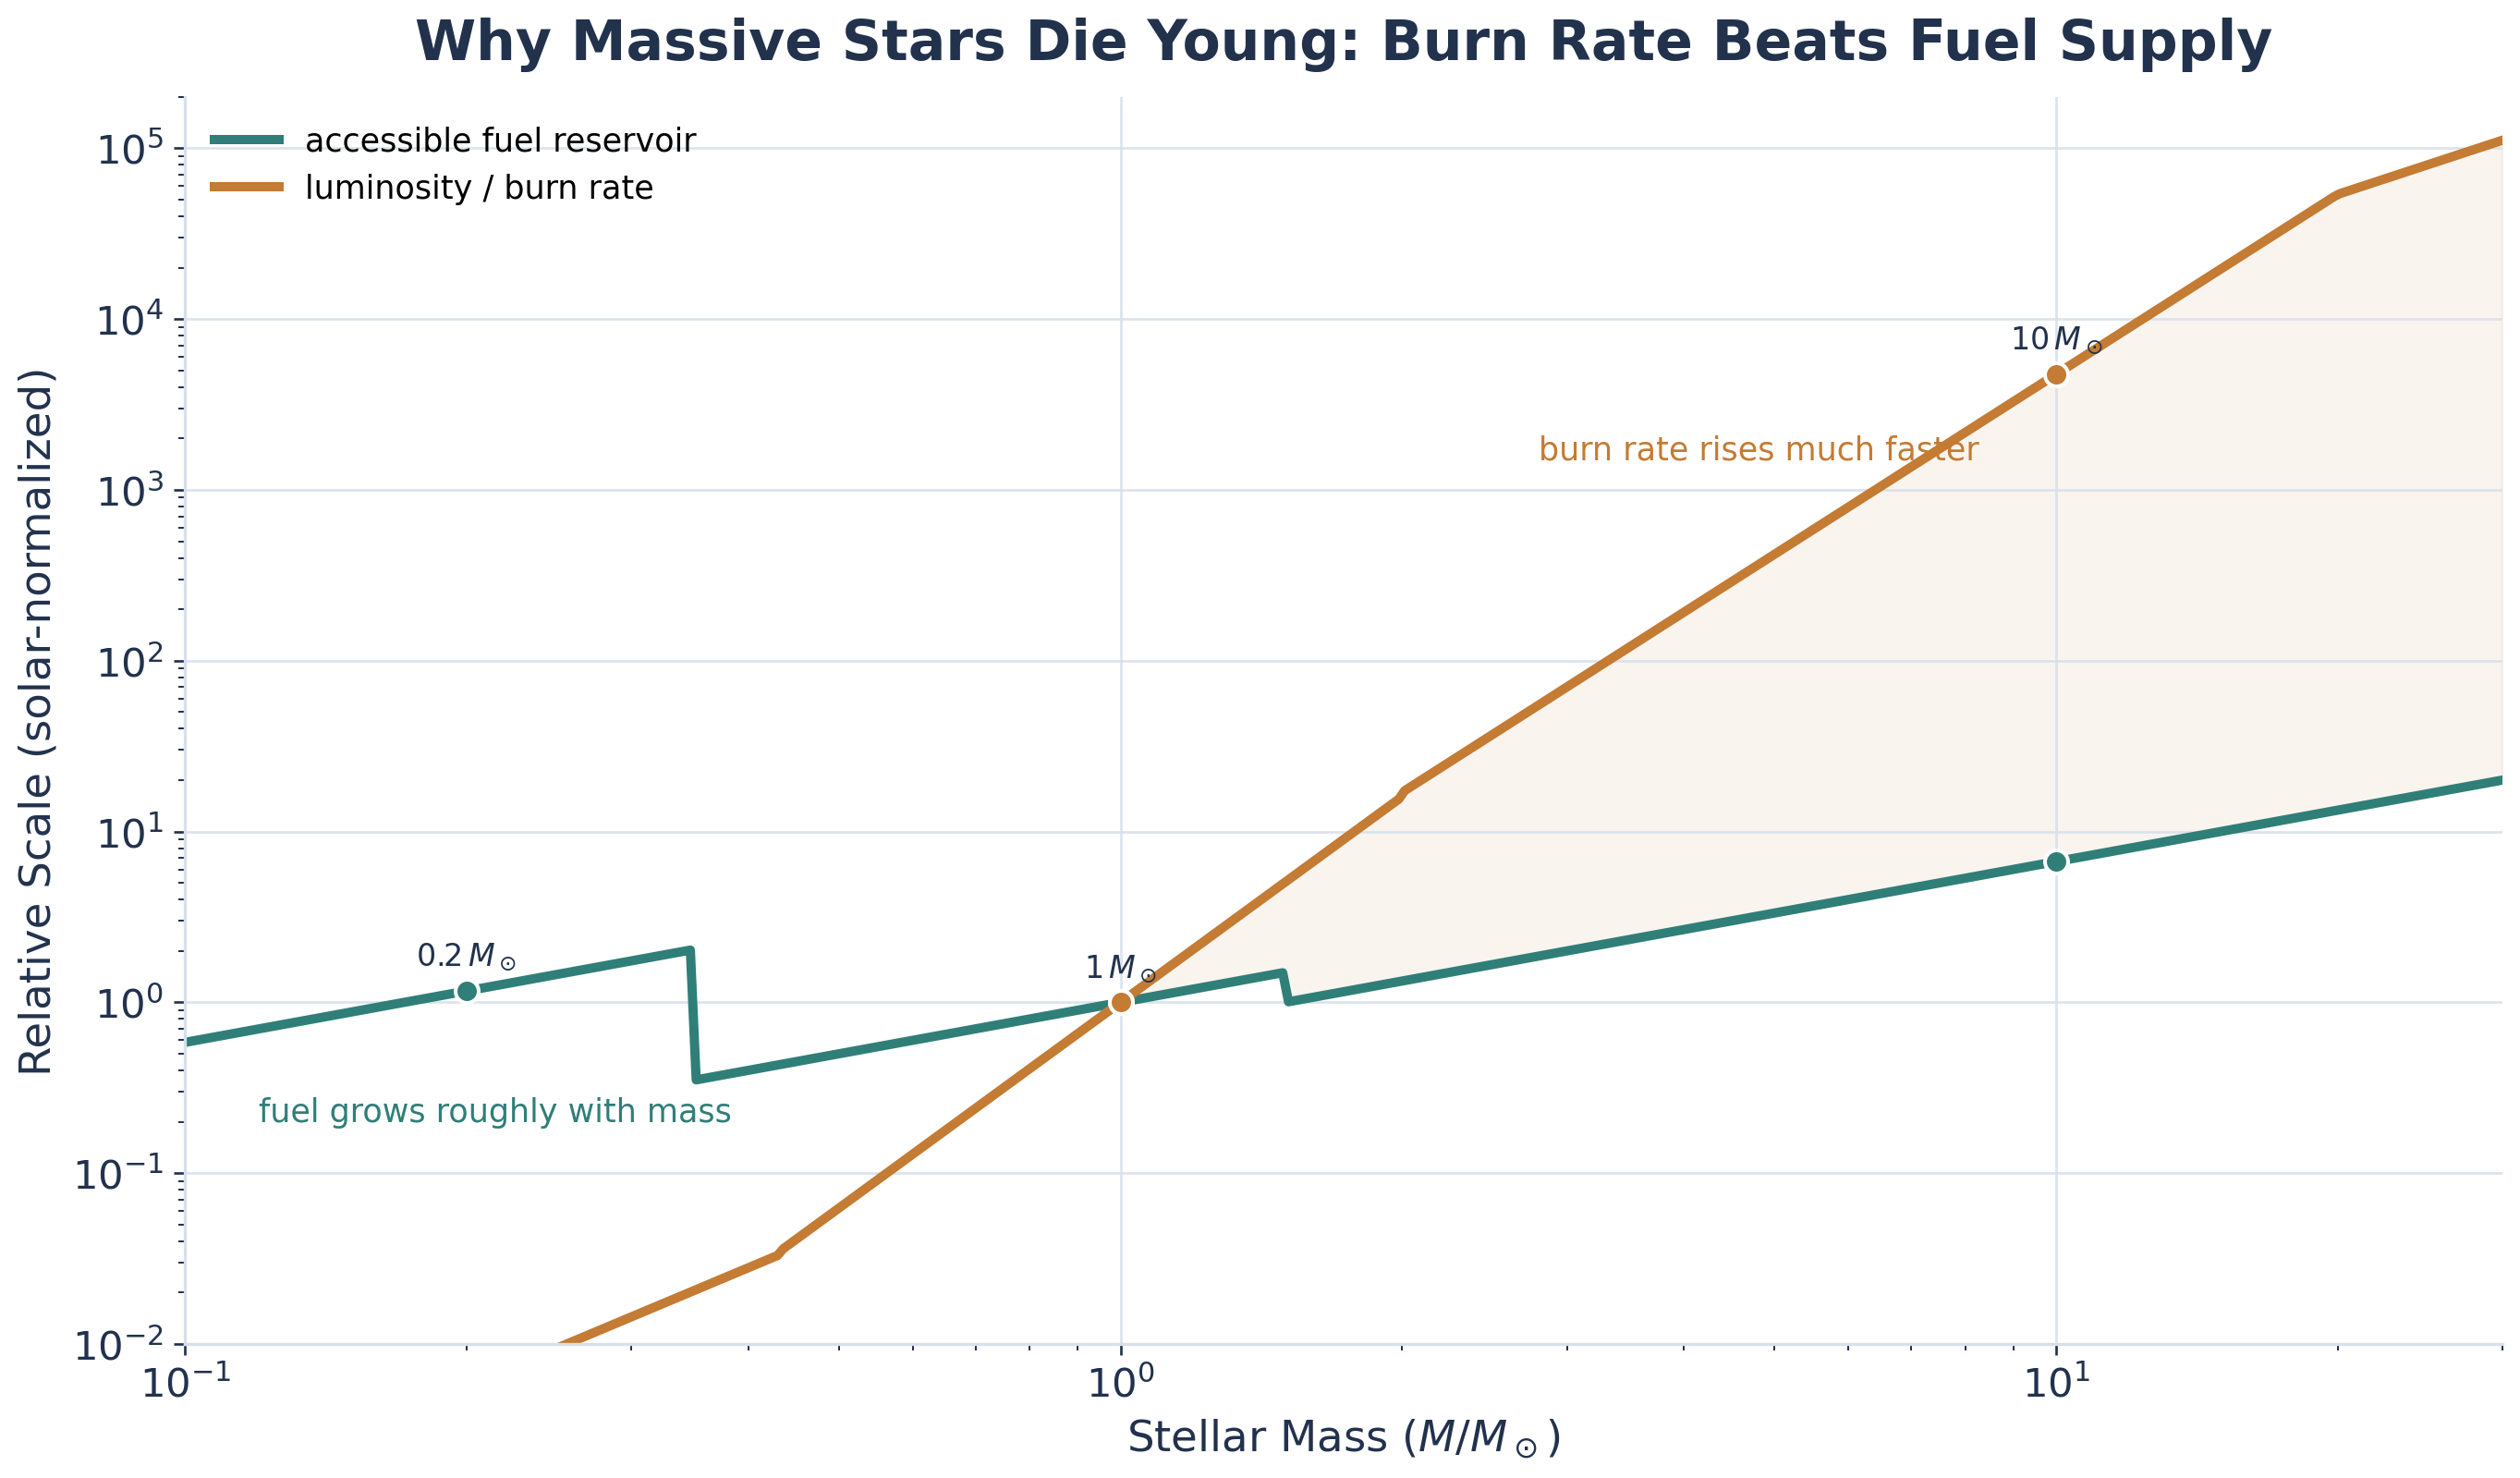
Now the mass-luminosity relation — the crown jewel of Module 2 — pays off. For main-sequence stars . Substituting into the nuclear timescale:
One of the most important scaling relations in all of astrophysics.
Notice the move you just made — you will make it again all module. Take a relation you already trust (), substitute a known scaling (), and read off how the quantity must depend on mass — no differential equation solved, just its structure read. The price of admission is naming what you leaned on: that the – relation holds and that and stay roughly constant from star to star. That habit — read the equation, extract the scaling, name the assumption — is the through-line of Module 3. In the next reading you will run it on the equation of stellar structure itself, this time by approximating a derivative.
| Star Mass () | Lifetime () | Comparison |
|---|---|---|
| Simple scaling only; still far beyond the age of the universe | ||
| Longer than the universe’s age — still on the MS | ||
| Sun: halfway through | ||
| Short enough to see evolution in clusters | ||
| Geologically brief |
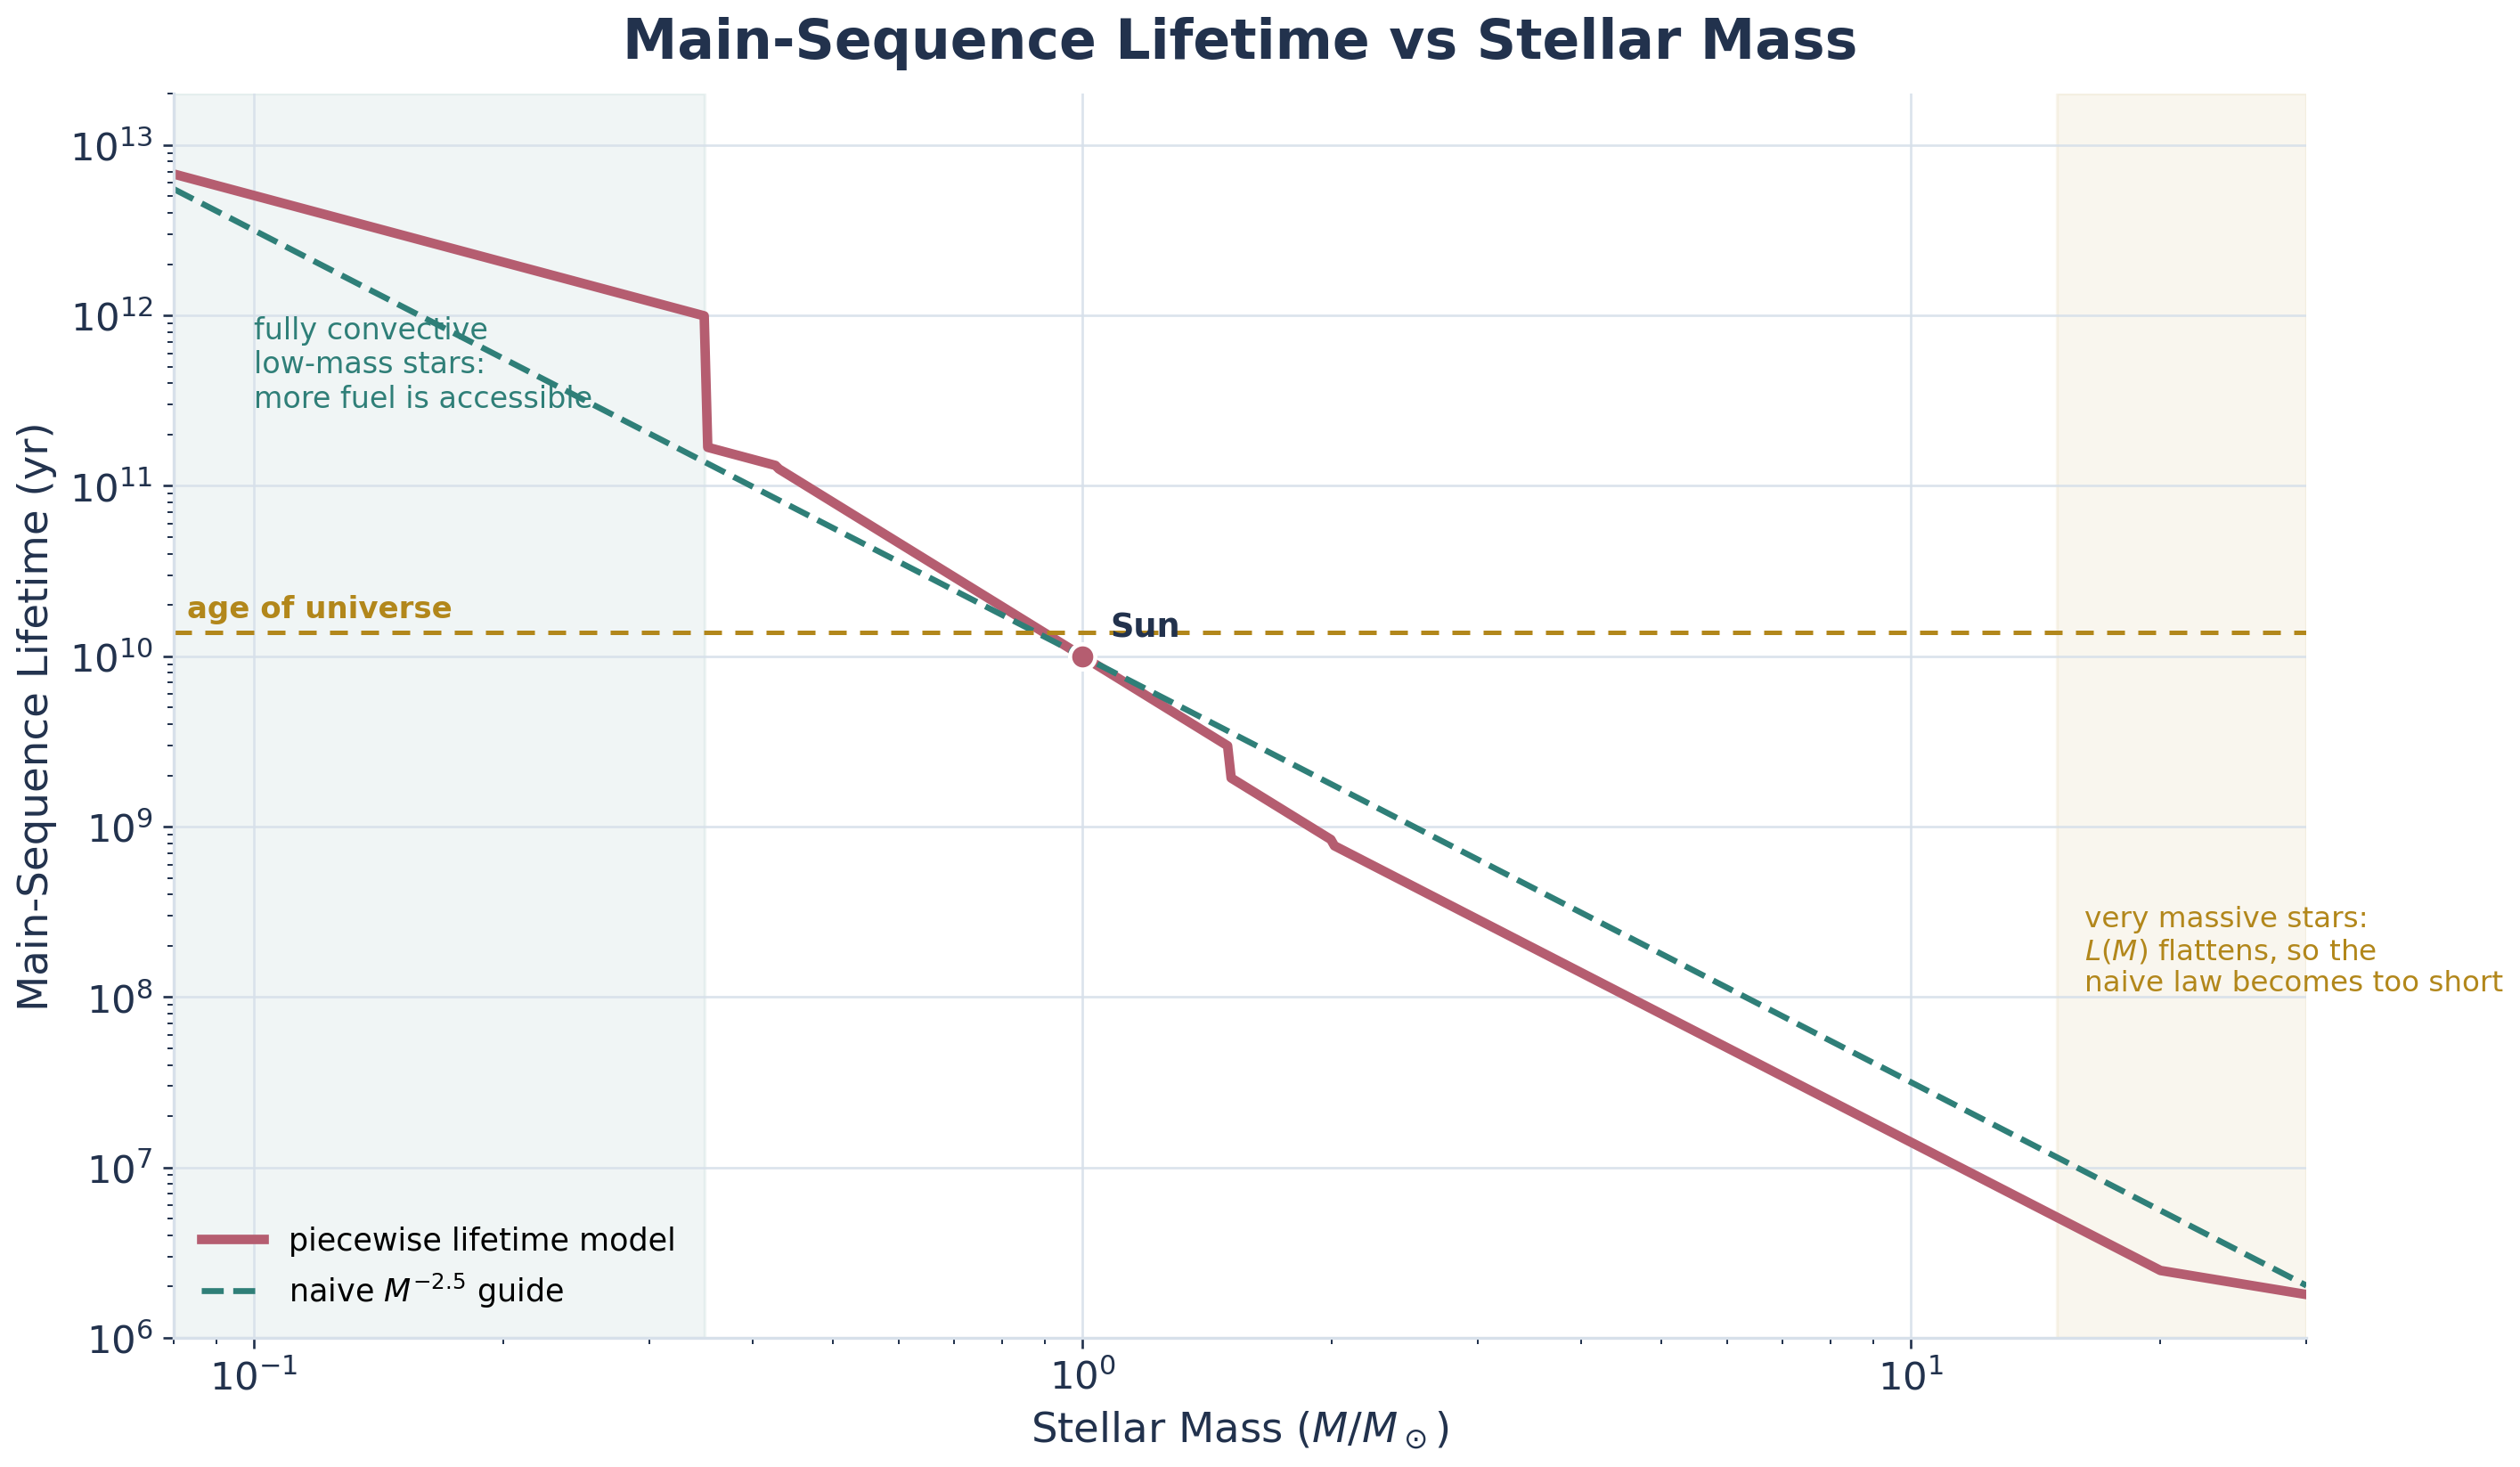
The pattern is dramatic. A star has 10 times the fuel but burns it times faster, so its lifetime is of the Sun’s. A red dwarf has the fuel but burns it times slower — it will outlive the current universe by a factor of a couple hundred. Two caveats: at low mass the luminosity scaling changes and fully convective stars access more of their hydrogen, so the lowest-mass stars live even longer than suggests; at high mass the - relation bends, so extrapolating to – predicts lifetimes that are too short. The scaling still gets the right qualitative story and order of magnitude across the broad middle of the main sequence.
Problem
Take an idealized fully convective M dwarf with , , and (because full convection mixes more fuel) . Estimate its main-sequence lifetime.
StepSolar-normalized nuclear lifetime
Dimensional check
Every factor is a dimensionless solar ratio; the product is dimensionless, and units enter only via the Sun’s ✓.
Result
— about 5.6 trillion years, far longer than the universe’s age. This is why the faintest red dwarfs are the Galaxy’s long-term survivors. (Not an exact prediction — it combines the simple luminosity scaling with a convection-boosted fuel fraction — but the conclusion is robust.)
Multiple choice
A more massive star should live longer because it contains more hydrogen fuel.
False. A more massive star has more total fuel, but its luminosity increases much faster than its mass: , so more mass shortens the lifetime. Mass helps by enlarging the fuel reservoir, but luminosity wins harder by raising the burn rate even more.
Numeric answer
A star in a young cluster is spectral type B2 () and still on the main sequence. Estimate the nuclear timescale of a star — the upper bound on the cluster’s age.
The cluster must be younger than the nuclear timescale of a star: . So the cluster is younger than . This is exactly how astronomers date clusters — find the most massive star still on the main sequence; the cluster’s age is approximately that star’s nuclear timescale. The technique is the main-sequence turnoff.