Spectra & Composition
Section 3 of 8
Atomic Fingerprints
Part 2: Spectral Lines as Atomic Fingerprints
The Bohr Model and Discrete Energy Levels
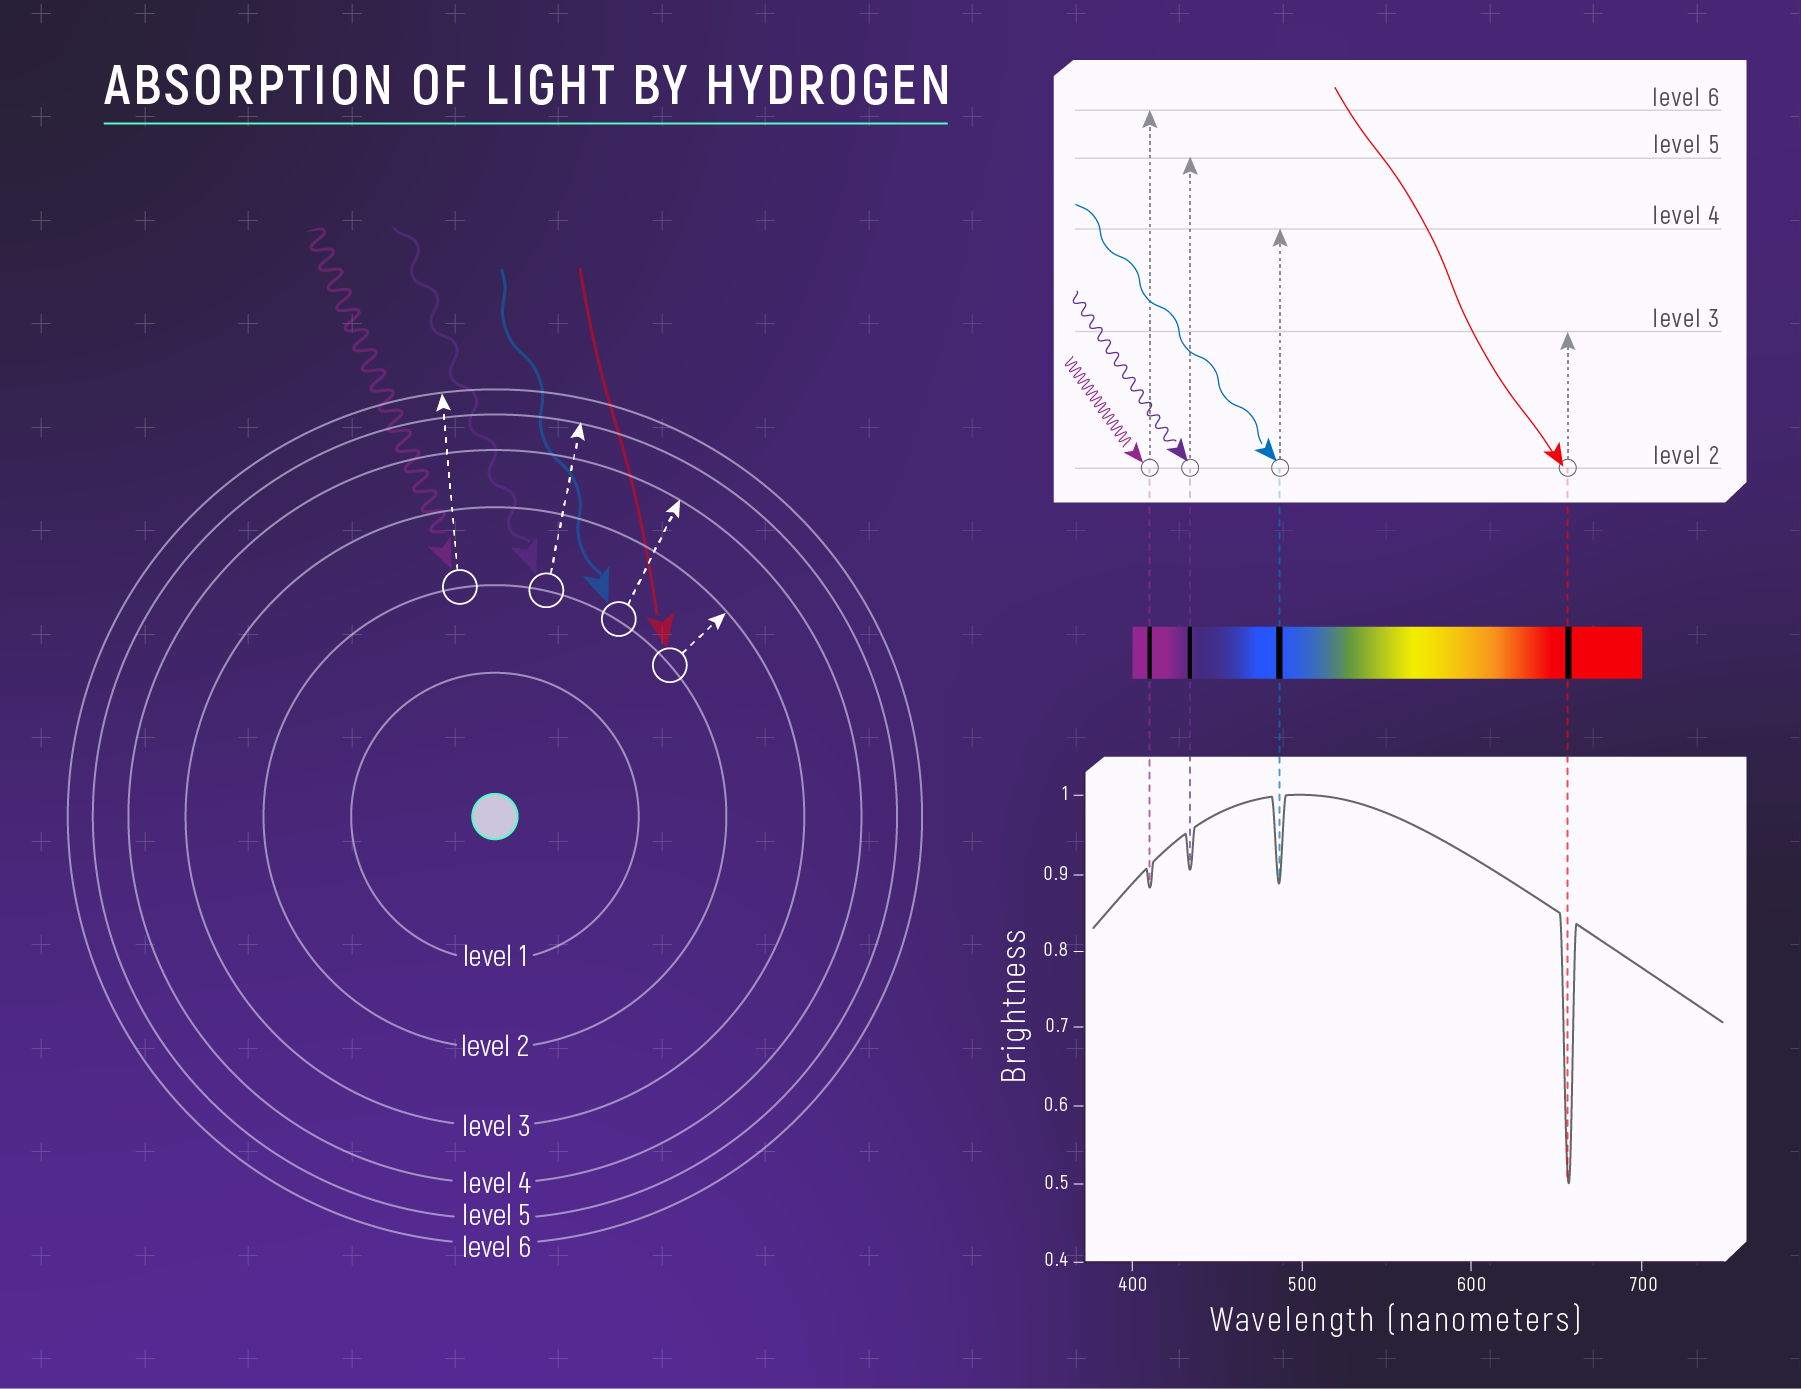
Why do atoms absorb and emit at specific wavelengths rather than at all wavelengths? The answer comes from quantum mechanics: electrons in an atom occupy discrete energy levels — quantized rungs on an energy ladder. They cannot hover between rungs.
Now look at the reverse process — what happens when excited electrons fall back down through the energy levels:
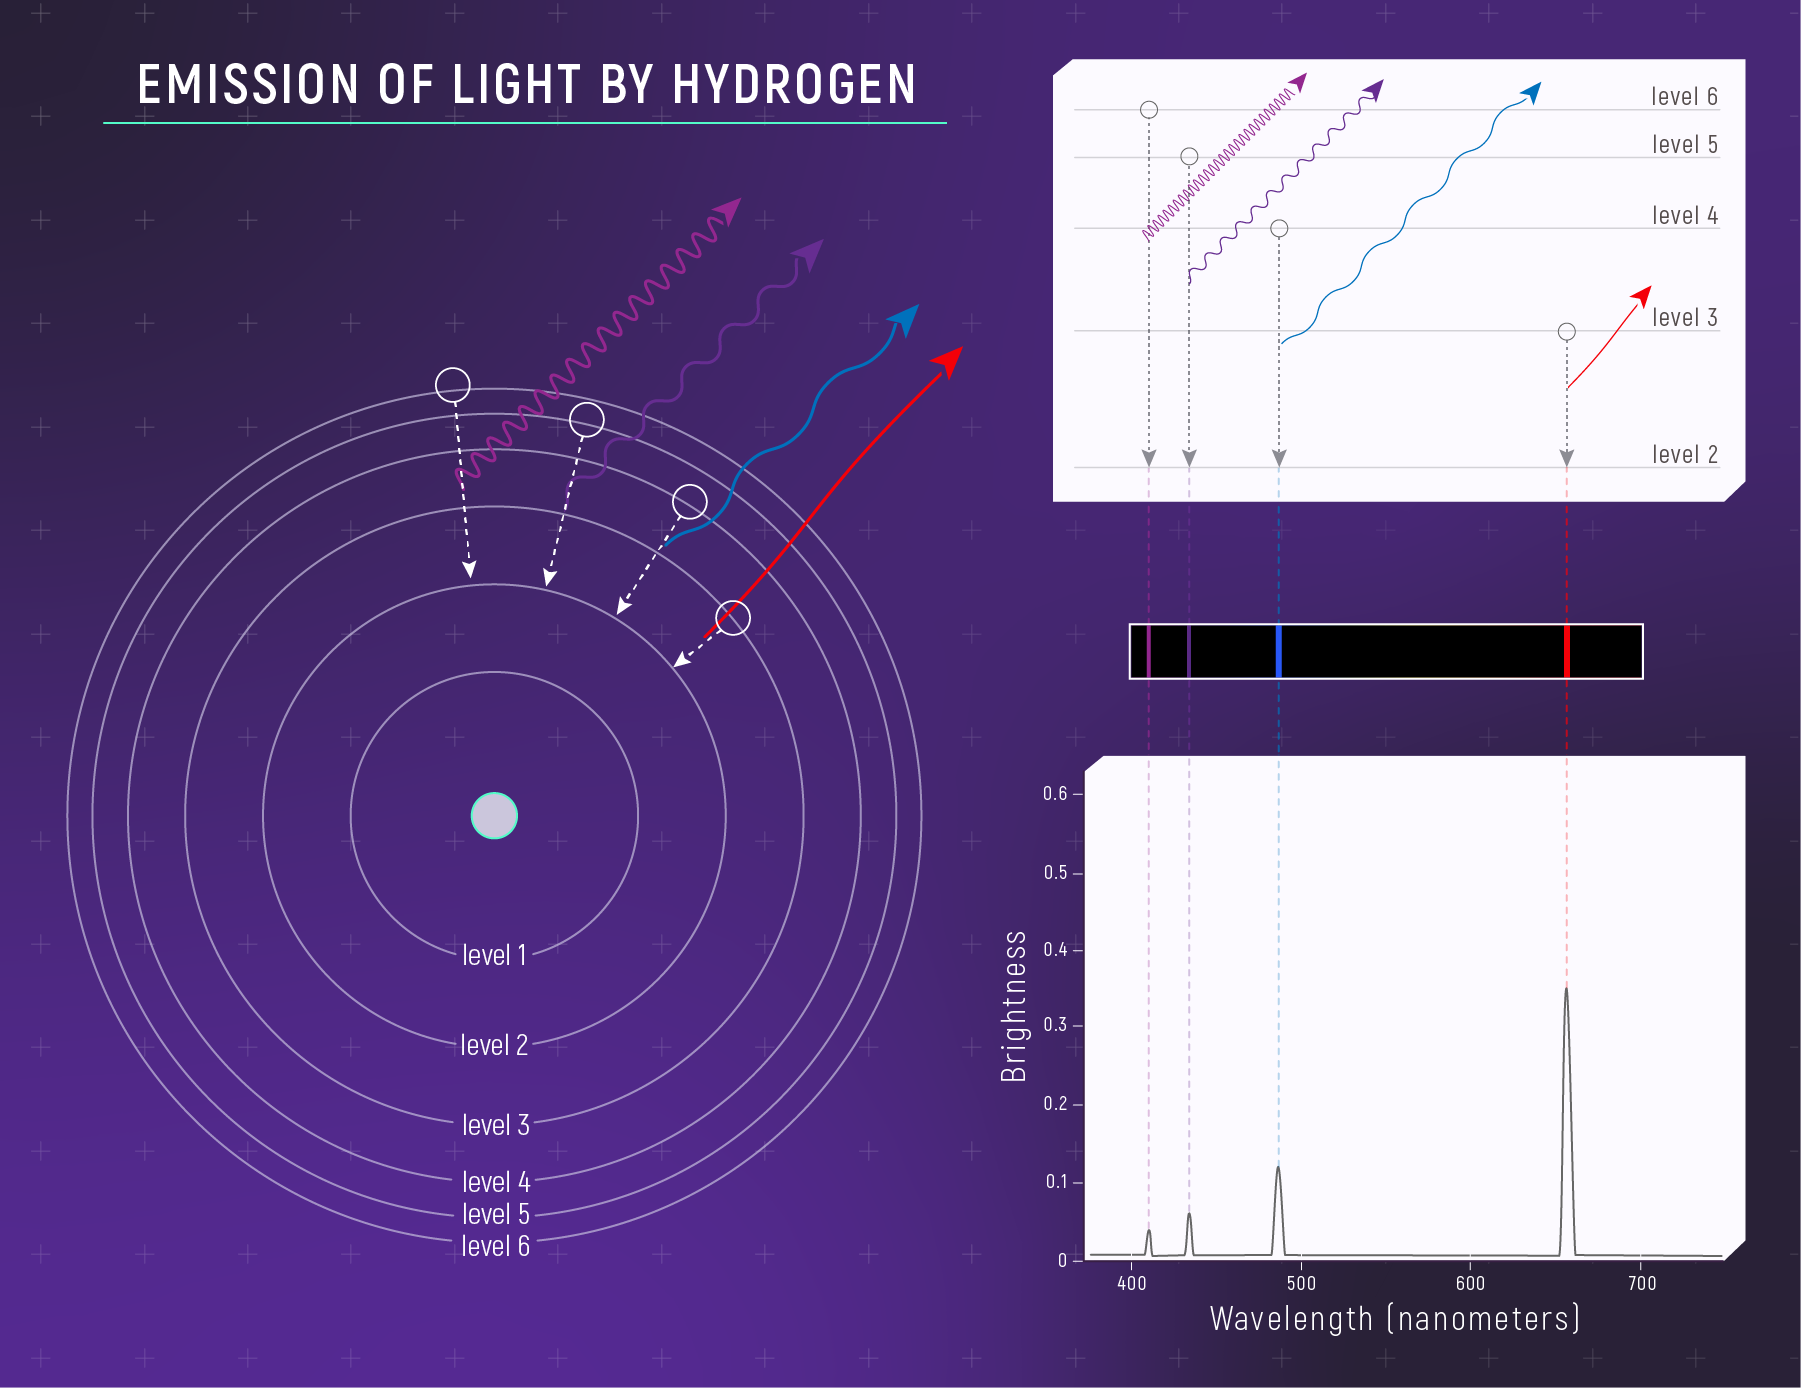
The same energy gaps produce the same wavelengths whether the photon is absorbed (electron jumps up) or emitted (electron falls down). This is why an
Absorption line
A dark feature in a spectrum where a cool gas absorbs photons from a hotter background source at a specific wavelength set by an atomic energy-level gap. It appears at the same wavelength the gas would emit if heated.
The
Here is the principal quantum number and 13.6 eV is the ionization energy of hydrogen — the energy needed to completely free the electron.
Bohr model
A quantum model of hydrogen in which the electron occupies discrete energy levels and absorbs or emits a photon only when it transitions between levels. Approximate for multi-electron atoms, but the core idea — discrete levels yield discrete lines — is exactly right.
Key observations from this equation:
- (ground state): — the most tightly bound level (most negative energy).
- (first excited state): — less tightly bound.
- As increases: levels crowd together and approach (the ionization threshold, where the electron is free).
- Negative sign: the electron is bound. You must add energy to free it.
When an electron transitions between levels, it absorbs or emits a photon whose energy equals the difference between the two levels:
The photon’s wavelength is set by the energy-wavelength relation:
Rearranging for wavelength gives .
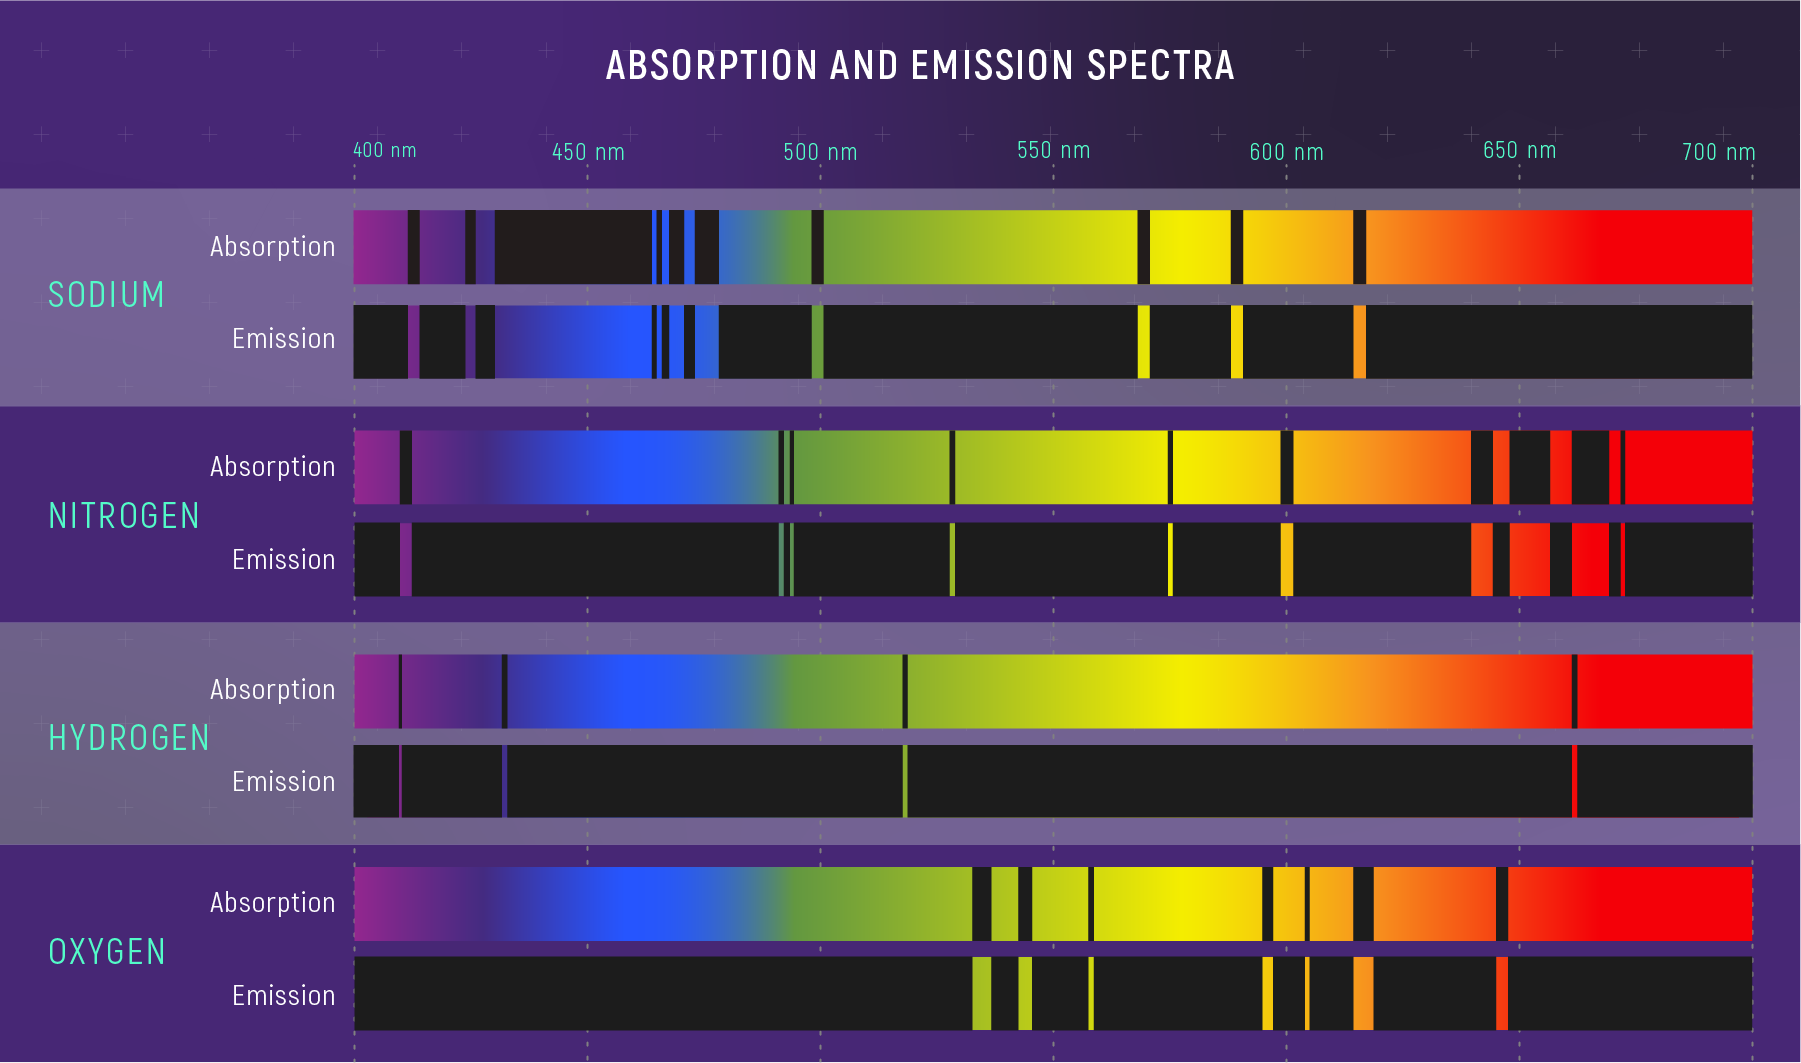
This is the key insight: each transition produces a photon at a specific wavelength, set entirely by the energy gap between levels. Different elements have different energy-level structures (different nuclear charges, different electron configurations), so each element produces a unique set of spectral lines — a fingerprint as distinctive as DNA.
The Hydrogen Balmer Series: Visible Fingerprints
The most famous set of spectral lines in astronomy is the
| Transition | Name | Wavelength (nm) | Color |
|---|---|---|---|
| Hα | 656.3 | Deep red | |
| Hβ | 486.1 | Blue-green | |
| Hγ | 434.0 | Violet | |
| Hδ | 410.2 | Near-UV |
Balmer series
Hydrogen spectral lines from transitions to or from the level. The visible members are Hα (656 nm), Hβ (486 nm), Hγ (434 nm), and Hδ (410 nm) — the most prominent features in many stellar spectra.
These four lines are the most prominent features in the visible spectra of many stars. They fall in the visible range because the energy differences (about 1.9–3.0 eV) match the energy of visible photons.
Problem
Use the Bohr model to predict the wavelength of the transition in hydrogen. Compare to the observed Hα wavelength of 656.3 nm.
StepFind the energy levels
StepCompute the energy difference
StepConvert to CGS ($1\ \text{eV} = 1.602 \times 10^{-12}\ \text{erg}$)
StepApply $\lambda = hc/\Delta E$ and convert to nm
Dimensional check
✓.
Result
The Bohr model predicts Hα at 656 nm — within 0.3 nm of the precise laboratory value (656.28 nm). The small difference comes from rounding the ionization energy to 13.6 eV (the exact Rydberg value is 13.5984 eV). This agreement was one of the Bohr model’s great early triumphs, and the 1.89 eV gap lands squarely in the deep red.
Quick check
- An absorption line appears at 486.1 nm in a star’s spectrum. Which element and transition does it correspond to?
- If a hydrogen atom’s electron jumps from to , does the atom absorb or emit a photon? Is it visible?
- Why can’t hydrogen atoms absorb photons at any arbitrary wavelength?
- Hydrogen, Hβ (). The wavelength 486.1 nm is the second Balmer line.
- Absorbs — the electron moves up. The gap gives — deep ultraviolet, not visible (the Lyman series).
- Because energy levels are quantized — the electron can only occupy specific energies. A photon must have exactly the right energy (matching a level gap) to be absorbed; a “wrong” wavelength passes through unabsorbed.
Part 2 takeaway: atoms absorb and emit at specific wavelengths because electrons occupy discrete energy levels. Each element’s unique level structure creates a unique spectral fingerprint. By matching observed absorption lines to laboratory wavelengths, we identify which elements are present in a star’s atmosphere — without ever visiting the star.