Spectra & Composition
Section 4 of 8
Line Strengths
Part 3: The OBAFGKM Sequence — Temperature, Not Composition
A Temperature Sequence in Disguise
In the early 1900s, astronomers at Harvard Observatory — led by Annie Jump Cannon and Williamina Fleming — classified hundreds of thousands of stellar spectra by eye, sorting them by the appearance and strength of their spectral lines. After much rearranging, the sequence settled into O, B, A, F, G, K, M — from strongest helium lines to strongest molecular bands. The classic mnemonic: “Oh Be A Fine Guy/Girl, Kiss Me.”
The breakthrough came when Cecilia Payne-Gaposchkin showed in her 1925 PhD thesis — arguably the most important doctoral dissertation in the history of astronomy — that stars are overwhelmingly hydrogen and helium, and that the spectral sequence is fundamentally a temperature sequence, not a composition sequence. This was so radical that her advisor, Henry Norris Russell, initially urged caution (he later acknowledged she was right). Stellar composition is remarkably uniform (about 74% hydrogen, 25% helium, 1–2% heavier elements by mass). What changes along the sequence is not what atoms are present but which quantum states those atoms occupy — and that depends on temperature.
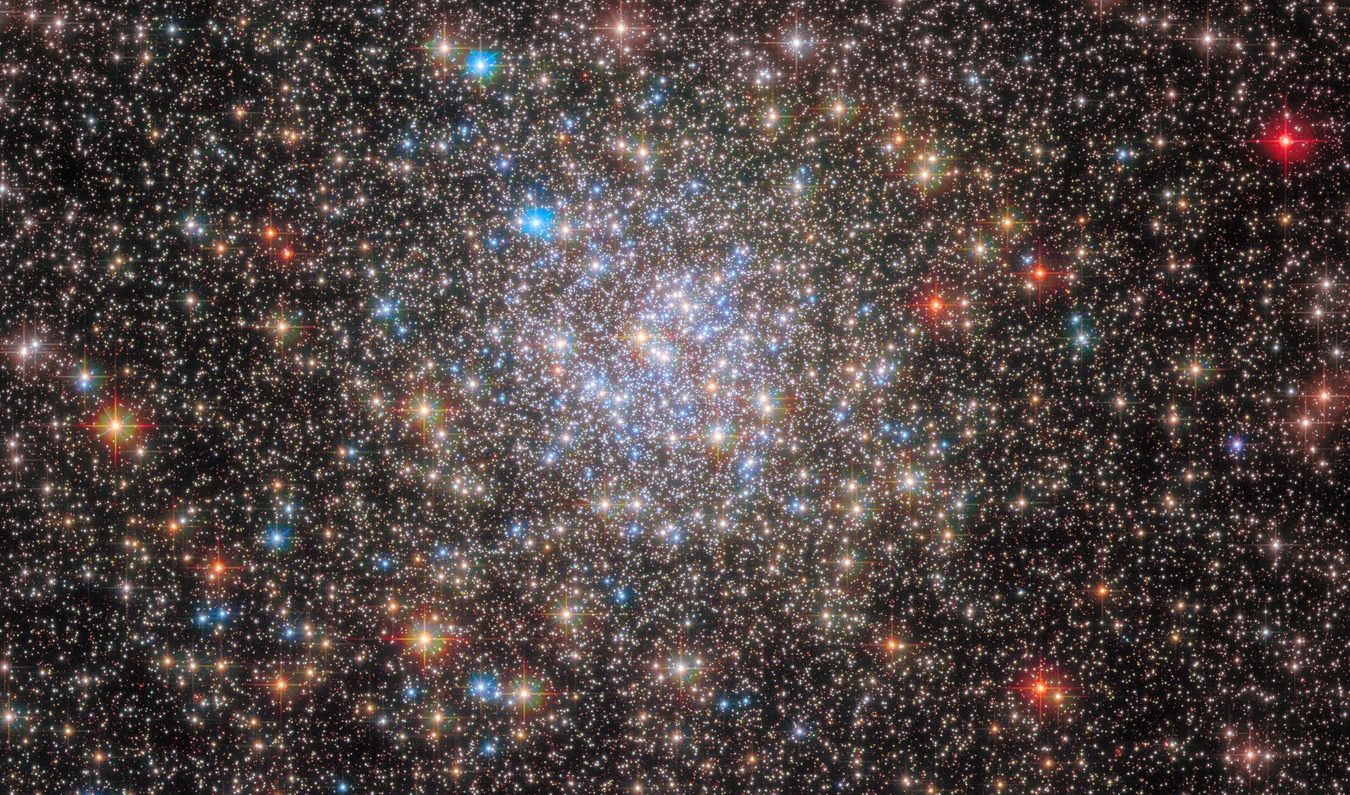
Before you read the sequence as letters in a table, look at the sky the way an observer does first: stars already announce that they are not thermally identical. A real star field shows blue-white, yellow, and orange-red stars sharing the same patch of sky. Spectroscopy explains why those colors differ, but the diversity is visible before any prism enters the story.
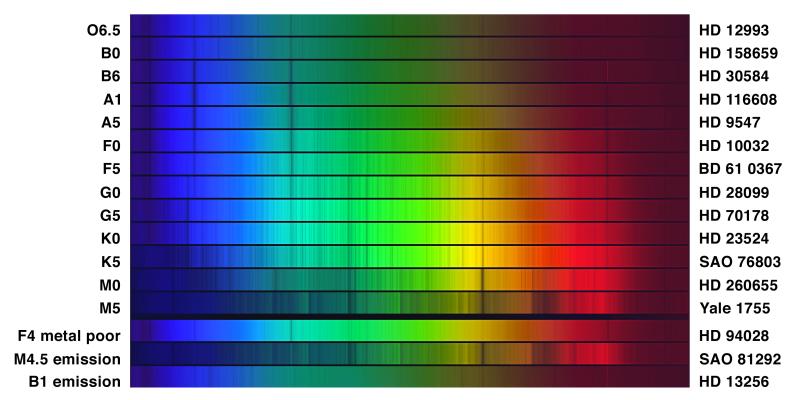
| Spectral Type | Color | Temperature Range | MS Prevalence | Dominant Features | Example |
|---|---|---|---|---|---|
| O | Blue-violet | 0.00003% | He II, weak H | O4I (ζ Puppis), O9.5V (10 Lac) | |
| B | Blue-white | 10,000–30,000 K | 0.13% | He I, strong H | B8Ia (Rigel), B1III (Spica) |
| A | White | 7,500–10,000 K | 0.6% | Strongest H Balmer lines | A1V (Sirius), A0V (Vega) |
| F | Yellow-white | 6,000–7,500 K | 3% | Moderate H, weak metals | F5IV (Procyon A) |
| G | Yellow | 5,200–6,000 K | 7.6% | Weak H, strong metal lines | G2V (Sun) |
| K | Orange | 3,700–5,200 K | 12.1% | Very weak H, strong metals, molecular bands appear | K1.5III (Arcturus) |
| M | Red-orange | 76.5% | Molecular bands (TiO), very weak H | M2Ia (Betelgeuse), M5V (Proxima Cen) |
Several examples are giants or supergiants rather than main-sequence dwarfs — those are the ones bright enough to have names. The prevalence column refers to main-sequence stars only.
Look at the prevalence column: M dwarfs make up over three-quarters of all main-sequence stars, yet they’re too faint to see with the naked eye. The bright stars that fill constellations — Rigel (B supergiant), Sirius (A dwarf), Arcturus (K giant) — are the rare luminous ones. The galaxy is dominated by cool, dim, long-lived M dwarfs.
Why Temperature Controls Line Strength
This is a critical conceptual point that trips up beginners: spectral type does NOT directly reflect composition. All main-sequence stars have roughly the same composition. What changes is which atomic transitions are active — and that depends on temperature through the
For an atom to absorb a photon at a given wavelength, an electron must already be in the right starting energy level. The fraction of atoms in any given level depends on temperature through the Boltzmann distribution:
where is the excitation energy — the energy above the ground state needed to reach level (always positive) — and is Boltzmann’s constant. For hydrogen, (the energy to excite from to ). Note is not the Bohr energy used earlier — it’s the gap , which is always positive.
Boltzmann distribution
The rule that the fraction of atoms in an excited level scales as , where is the excitation energy above the ground state. Its exponential sensitivity to temperature is why spectral type is a temperature sequence: temperature, not abundance, sets which levels are populated and therefore which lines appear.
The exponential is ruthless: even modest temperature changes dramatically shift which levels are populated. Higher excitation energy demands higher temperature for significant population. As a rough guide, every factor-of-two increase in temperature can boost high-energy level populations by orders of magnitude.
(More precisely, the full Boltzmann expression includes degeneracy factors and a partition function in the denominator, but the key physics — exponential sensitivity to — is captured above.)
Predict First
Commit to an answer before reading on.
The star-by-star walkthrough below confirms your reasoning.
How this creates the spectral sequence:
O stars (30,000+ K): so hot that collisions ionize most hydrogen — electrons are stripped free. No neutral hydrogen means weak Balmer lines. Instead we see lines of ionized helium (He II), which requires extreme temperatures. (The governing physics is the Saha equation, which we won’t derive — but the idea is simple: hot enough collisions knock electrons free entirely.)
A stars (7,500–10,000 K): the Goldilocks temperature for hydrogen Balmer absorption. Balmer strength reflects a competition between excitation and ionization: the Boltzmann factor sets what fraction of neutral atoms are in , while the Saha equation sets what fraction are neutral at all. At A-star temperatures, enough hydrogen stays neutral and enough of it is excited to that Balmer absorption is maximally efficient. H lines are strongest here.
G stars (5,800 K, like the Sun): Balmer lines are weaker — fewer atoms sit in . Metal absorption lines become prominent: ionized calcium (Ca II H & K at 393.4 and 396.8 nm), neutral iron, sodium (the D lines at 589.0 and 589.6 nm). The spectrum looks like a forest of metallic lines.
M stars (below 3,700 K): so cool that atoms stay neutral and even molecules form. Titanium oxide (TiO) produces broad absorption bands dominating the red and infrared. Balmer lines are very weak because almost no atoms are in .
Quick check
Your lab partner claims: “M stars have weak hydrogen lines because they have less hydrogen than A stars.” Construct a counterargument using the Boltzmann distribution. What fraction of hydrogen atoms are in at 3,000 K vs. 10,000 K?
At 3,000 K, , so — essentially zero atoms in . At 10,000 K, , so — tiny but significant. That’s a factor of difference in the Boltzmann factor with zero change in hydrogen abundance.
Metallicity: A Secondary Effect
Metallicity
The mass fraction of elements heavier than helium in a star or gas cloud (). It modulates the strength of metal absorption lines but, at fixed temperature, does not change a star’s spectral type — a second-order effect.
Quick check
- Which spectral type has the strongest hydrogen Balmer lines?
- Why are H lines weak in O stars — lack of hydrogen, or something else?
- Two stars have the same spectral type (G5). Must they have the same luminosity?
- A star’s spectrum shows strong TiO molecular bands. Is it hot or cool?
- A — the temperature (–) maximally populates the level.
- Something else — O stars have plenty of hydrogen, but it’s mostly ionized at 30,000+ K. No neutral hydrogen means no Balmer absorption.
- No — same type means similar temperature, but they could be a dwarf (V) or a giant (III) with luminosities differing by orders of magnitude. That’s why luminosity class exists.
- Cool — molecular bands form only at low temperatures (), characteristic of M-type stars.
Part 3 takeaway: OBAFGKM is a temperature sequence. Composition is nearly uniform across stars — what changes is which energy levels are populated, exponentially sensitive to temperature. Spectral type tells you temperature; metallicity and luminosity class add refinement.
Select all that apply
Give two physically distinct reasons a star could show very weak H Balmer lines, other than having less hydrogen.
Two reasons besides “less hydrogen”: (1) the star is too hot — hydrogen is ionized, so no neutral atoms exist for Balmer absorption (O stars); (2) the star is too cool — almost no hydrogen atoms are excited to (M stars). Both are temperature effects, not composition effects.