Spoiler Alerts
Section 3 of 9
The Spoiler Reel: Decoding Light
What follows is a tour through some of the most spectacular astronomical images humanity has ever captured. But we’re not just sightseeing. For each image, we’ll ask three questions:
- What do we measure?
- What do we infer?
- What physics makes that inference legal?
You are not expected to understand all the answers yet. That’s what the rest of the semester is for. Today, we’re giving you the spoilers — showing you where we’re headed. By the end of the course, you’ll have earned the right to say these things with confidence.
DigressionThe pattern to watch for
Every spoiler follows the same structure: measurement → model → inference. By the end of this course, you’ll be able to fill in the “what physics” part yourself.
The Narrative Arc: Where We’re Going
Mini-Glossary (Orientation Only)
This glossary is here to help you recognize terms when you see them — not to memorize them. Every term below will be reintroduced later, in context, with time to understand it properly. For now, just scan and move on.
| Term | One-Line Definition |
|---|---|
| Photon | A “packet” of light; the quantum of electromagnetic radiation |
| Wavelength (λ) | The spatial period of a light wave; determines the “type” of light |
| Spectrum | Brightness measured as a function of wavelength |
| Flux | Light energy per unit time per unit area reaching your detector |
| Luminosity | Total light energy emitted by a source per unit time |
| Emission | Light produced and sent out by a source |
| Absorption | Light removed from a beam by intervening material |
| Extinction | Dimming of light by dust (absorption + scattering combined) |
| Ionized | An atom that has lost one or more electrons; electrically charged |
| Neutral | An atom with equal numbers of protons and electrons; no net charge |
| Thermal radiation | Light emitted due to an object’s temperature (all hot objects glow) |
| Dark matter | Invisible matter detected through gravity; outweighs visible matter ~5 |
| Dark energy | The unknown driver of accelerating cosmic expansion; ~68% of the universe |
| Redshift | Stretching of light wavelengths; for distant galaxies, caused by cosmic expansion |
Light encodes physics
Spoiler 1: Nebulae — Color as Encoded Physics
Color is encoded physics
![Annotated nebula image showing three labeled features: (1) Hydrogen-Alpha at 656.3 nm in red regions indicating ionized gas, (2) Doubly-ionized Oxygen [OIII] at 500 nm in blue-green regions indicating extremely low density, (3) Dark Lanes showing silhouettes of interstellar dust blocking the light.](/astr201/figures/forensic-nebula.png)
Structured colors at specific wavelengths
Red light at 656 nm. Blue-green light at 496–501 nm. Dark regions where light is blocked.
Atoms emit at fingerprint wavelengths
Atoms emit light at specific wavelengths, not random colors. Each element has a unique fingerprint of wavelengths set by its atomic structure. When we see red light at exactly 656 nm, we know hydrogen is present.
Which gas is where — and what's blocking it
The red regions contain hydrogen gas heated and ionized by nearby hot stars. The blue-green regions contain oxygen. The dark lanes contain dust — tiny solid particles that absorb and scatter starlight.
Key insight: color isn’t decoration — it’s encoded physics. Specific wavelengths = specific atoms = specific conditions.
Transition: if colors encode what’s there, how do we figure out how far away it is?
Spoiler 2: The Distance Ladder — How Far Is Far?
Brightness becomes distance
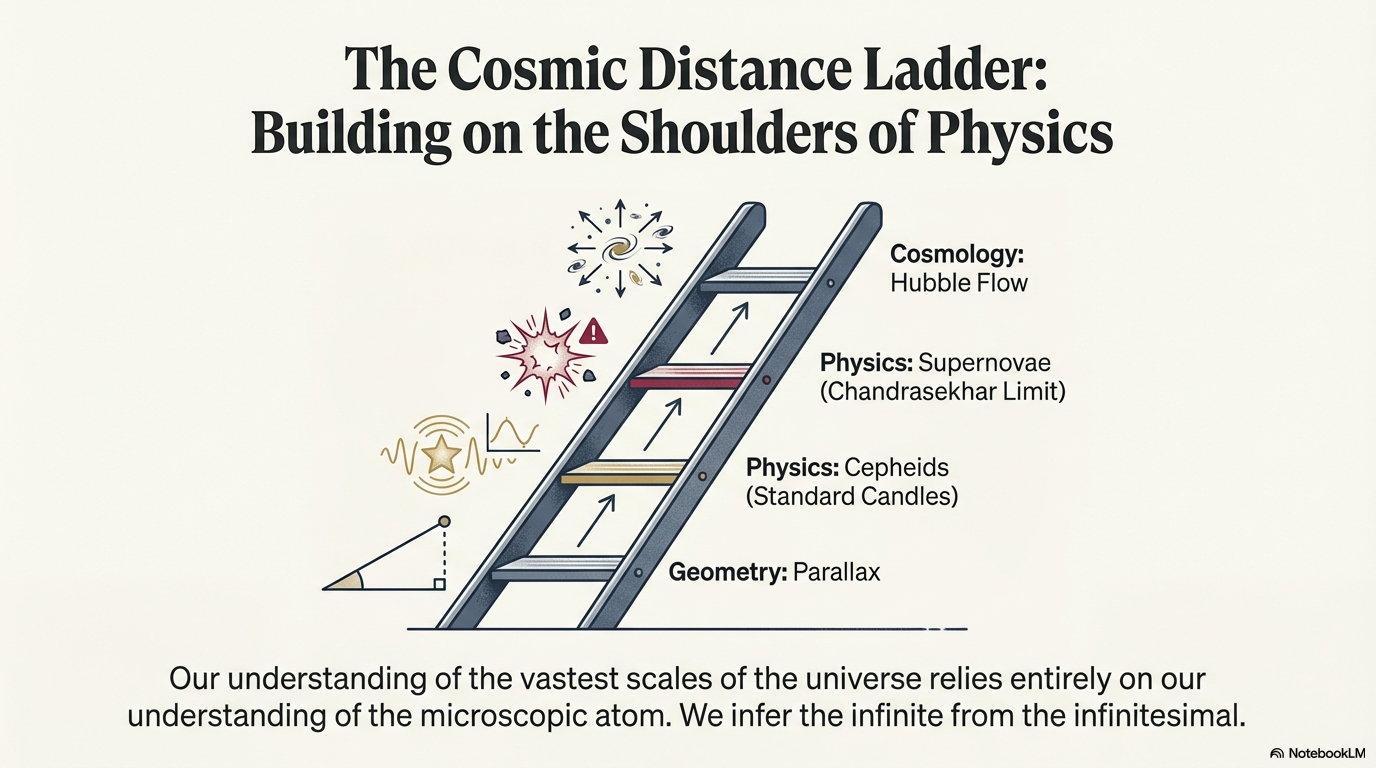
Standard candle
An object whose intrinsic luminosity can be determined independently (from pulsation period, spectral type, or explosion physics), allowing distance to be calculated from observed brightness.
Apparent brightness of milepost objects
Apparent brightnesses of certain “milepost” objects — stars that pulsate in predictable ways, or stellar explosions that reach consistent peak brightness.
The inverse-square law plus a known luminosity
If you know how bright something truly is (its luminosity) and measure how bright it appears (its flux), the inverse-square law lets you calculate distance.
Distances out to billions of light-years
Distances far beyond what geometry alone can reach — out to billions of light-years.
Key insight: distance is inferred from brightness. To measure farther, we need brighter
Transition: distance tells us where things are. But what are they made of?
Spoiler 3: Origin of the Elements — Stars as Nuclear Factories
The periodic table is a fossil record
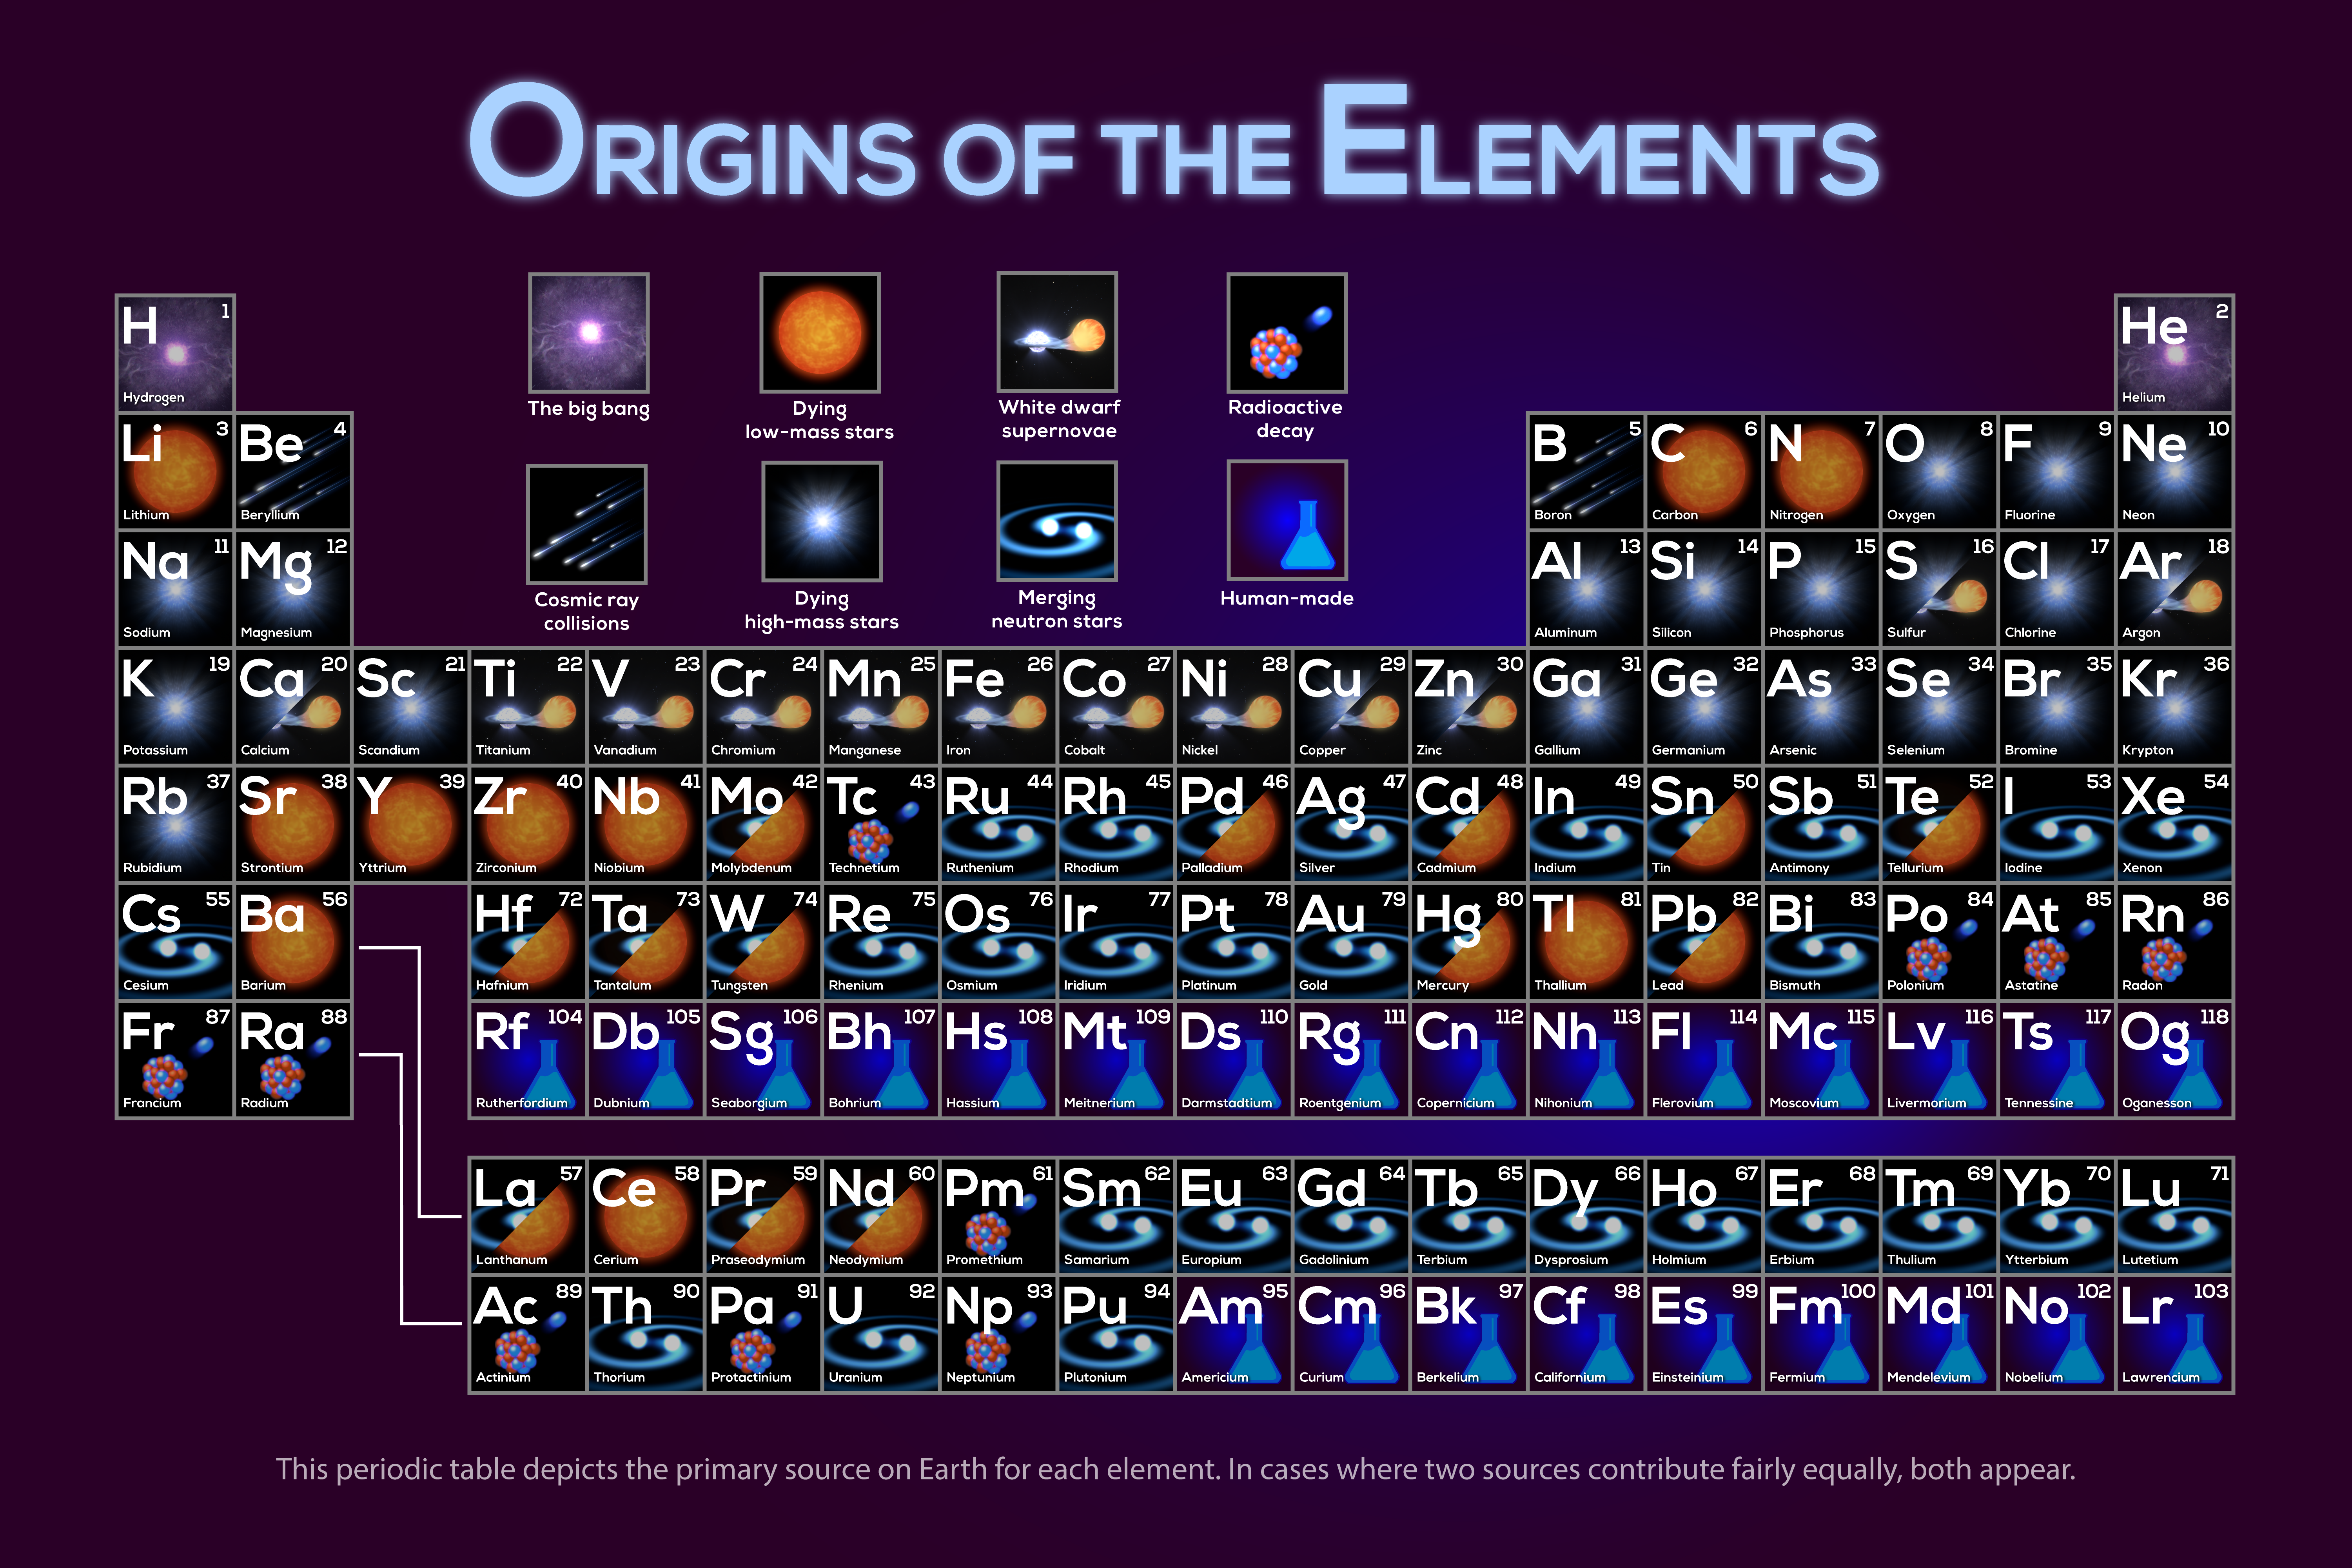
Element fingerprints and abundances
Element fingerprints in spectra — specific wavelengths absorbed or emitted — and abundances of elements in meteorites, stars, and gas clouds.
Nucleosynthesis: each process leaves fossils
Nuclear reactions require specific conditions (temperature, density) and have specific products. The elements we find are fossils of the processes that created them.
Different cosmic environments made different elements
The periodic table is a fossil record of astrophysical processes — different sites made different elements.
Key insight: stars don’t just shine — they manufacture the periodic table. The atoms in your body were forged in stellar cores and explosions, scattered into space, and incorporated into a new solar system, and then into you. You are starstuff.
Transition: we’ve mentioned “wavelengths” and “spectra” several times. What exactly is a spectrum?
Spoiler 4: Dispersion — The Key to Everything
A spectrum turns one signal into thousands
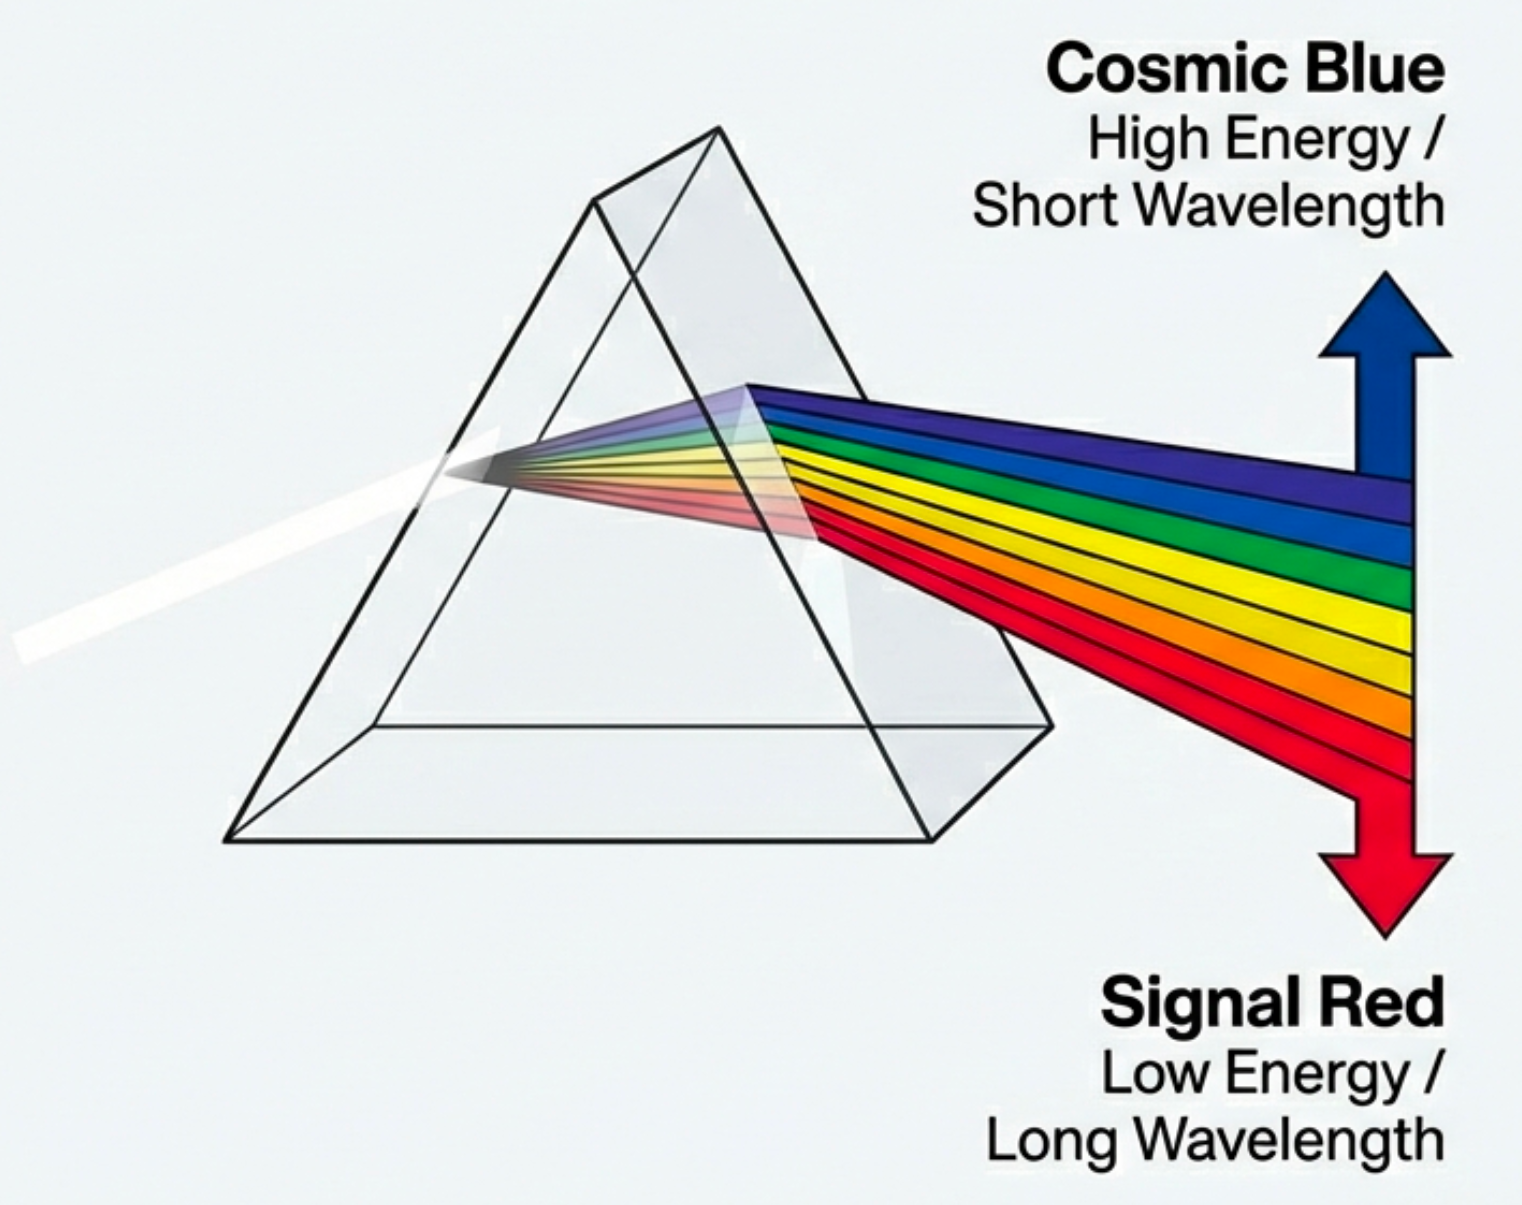
Spectroscopy
The technique of spreading light into its component wavelengths and measuring brightness as a function of wavelength. It turns a single brightness measurement into thousands of data points encoding temperature, composition, and motion.
White light spreads into a rainbow
When “white” light passes through a prism (or diffraction grating), it spreads into a rainbow.
Different wavelengths bend by different amounts
Different wavelengths travel at different speeds through glass, causing them to bend by different amounts and separate spatially.
Light is a mixture of many wavelengths
Light contains many wavelengths simultaneously. “White” is a mixture; each color corresponds to a different wavelength.
The breakthrough: a prism doesn’t just make rainbows — it gives you the power to decode what’s hidden inside the light. This is
Quick check
Why is spectroscopy more powerful than just measuring total brightness?
Spectroscopy spreads light into its component wavelengths, giving you brightness as a function of wavelength — thousands of data points instead of one. This reveals temperature, composition, and motion that a single brightness measurement cannot.
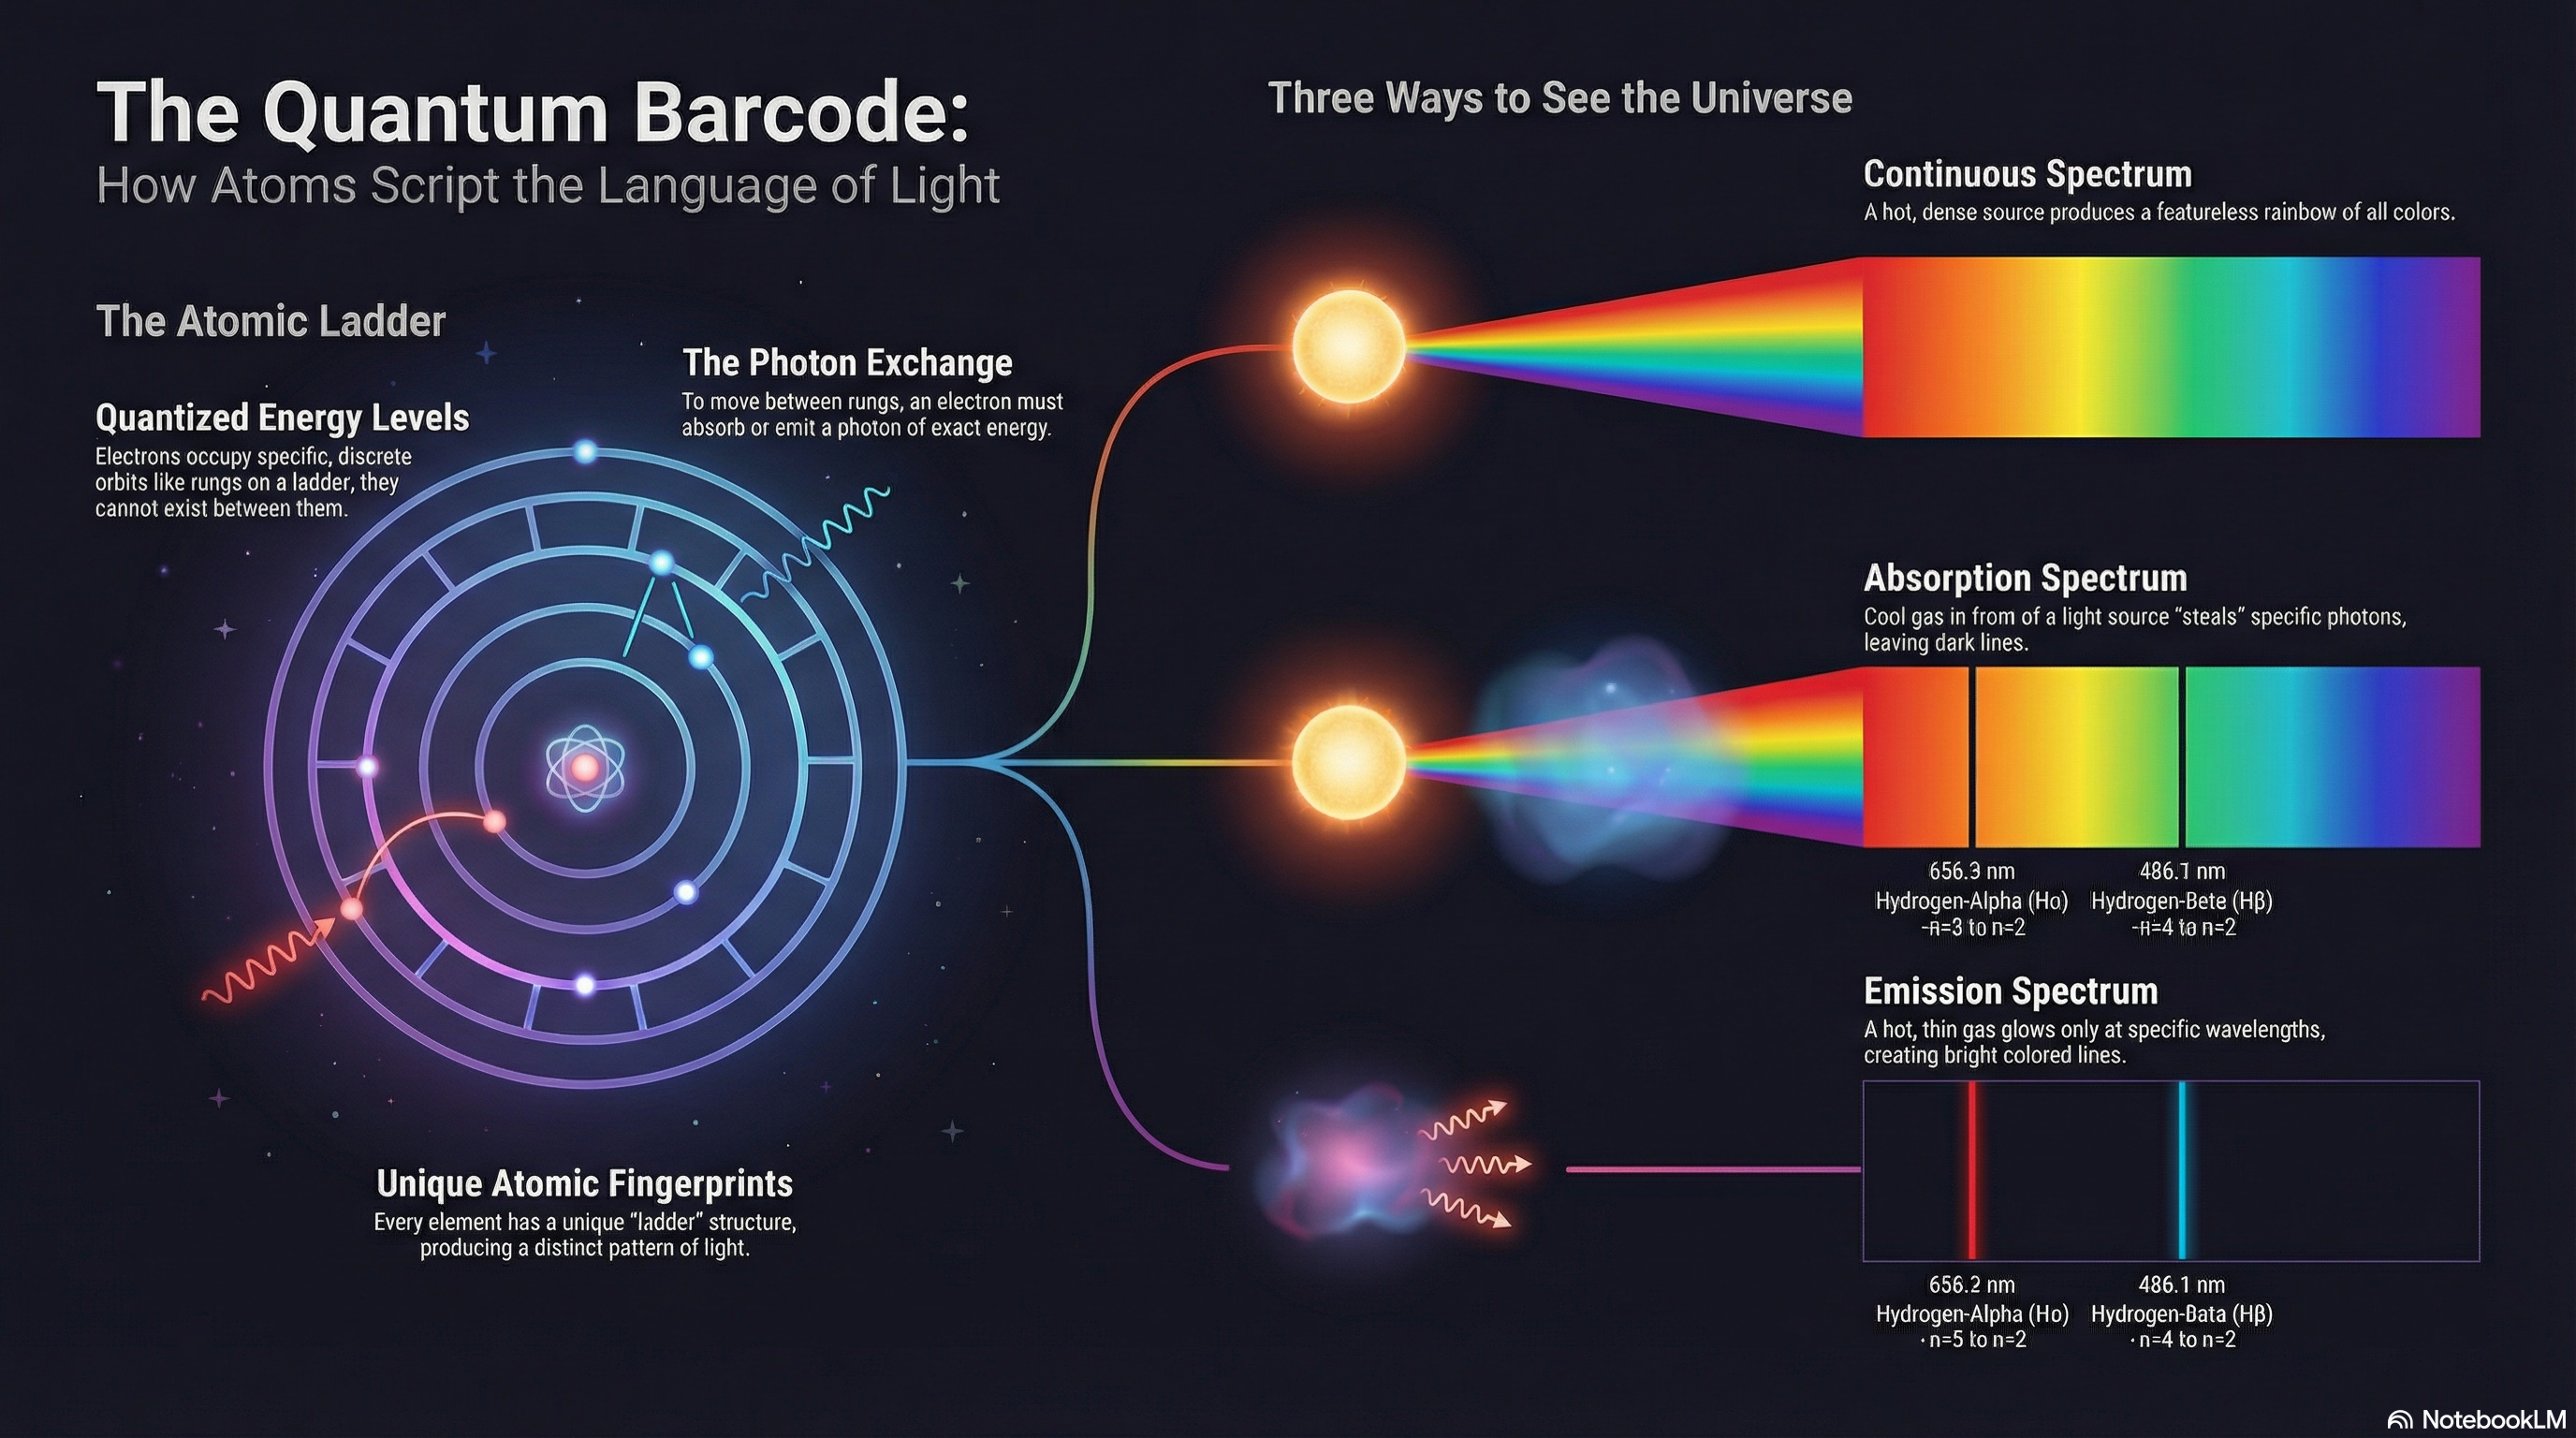
But why do atoms produce light at specific wavelengths rather than a continuous rainbow? The answer is quantum mechanics: electrons in atoms can only occupy certain discrete energy levels. When an electron jumps between levels, it absorbs or emits a photon of exactly the right energy — and energy determines wavelength. Each element’s unique ladder of energy levels creates its unique spectral fingerprint.
Here’s something crucial: those fingerprints are stable — hydrogen always produces the same pattern of wavelengths. But when the source moves toward or away from us, the entire fingerprint shifts in wavelength. Moving toward us? The wavelengths compress (shift blue). Moving away? They stretch (shift red).
Doppler effect
The shift in observed wavelength caused by relative motion between source and observer: compression (blueshift) for approach, stretching (redshift) for recession. It lets us measure the speeds of stars, galaxies, and the expanding universe using light alone.
This is the
Transition: the rainbow from a prism shows visible light. But visible light is just a tiny slice of all the light that exists…