Spoiler Alerts
Complete lesson
Welcome to ASTR 201
By the end of this reading, you will be able to:
Spoiler Alerts
Think of this reading as a movie trailer: you’ll see flashes of ideas, characters, and conflicts that won’t make full sense until you’ve seen the whole film. The semester is the movie. Today, we’re just building anticipation.
“The cosmos is within us. We are made of star-stuff. We are a way for the universe to know itself.”
— Carl Sagan
The iron in your blood was forged in a star that exploded before our Sun was born. The calcium in your bones came from a different dying star. The oxygen you’re breathing right now was manufactured in the core of a massive star and scattered into space when that star died. You are, quite literally, made of stellar debris.
This course is about how we know that — and what else we can learn by carefully decoding the light that reaches us from across the cosmos.
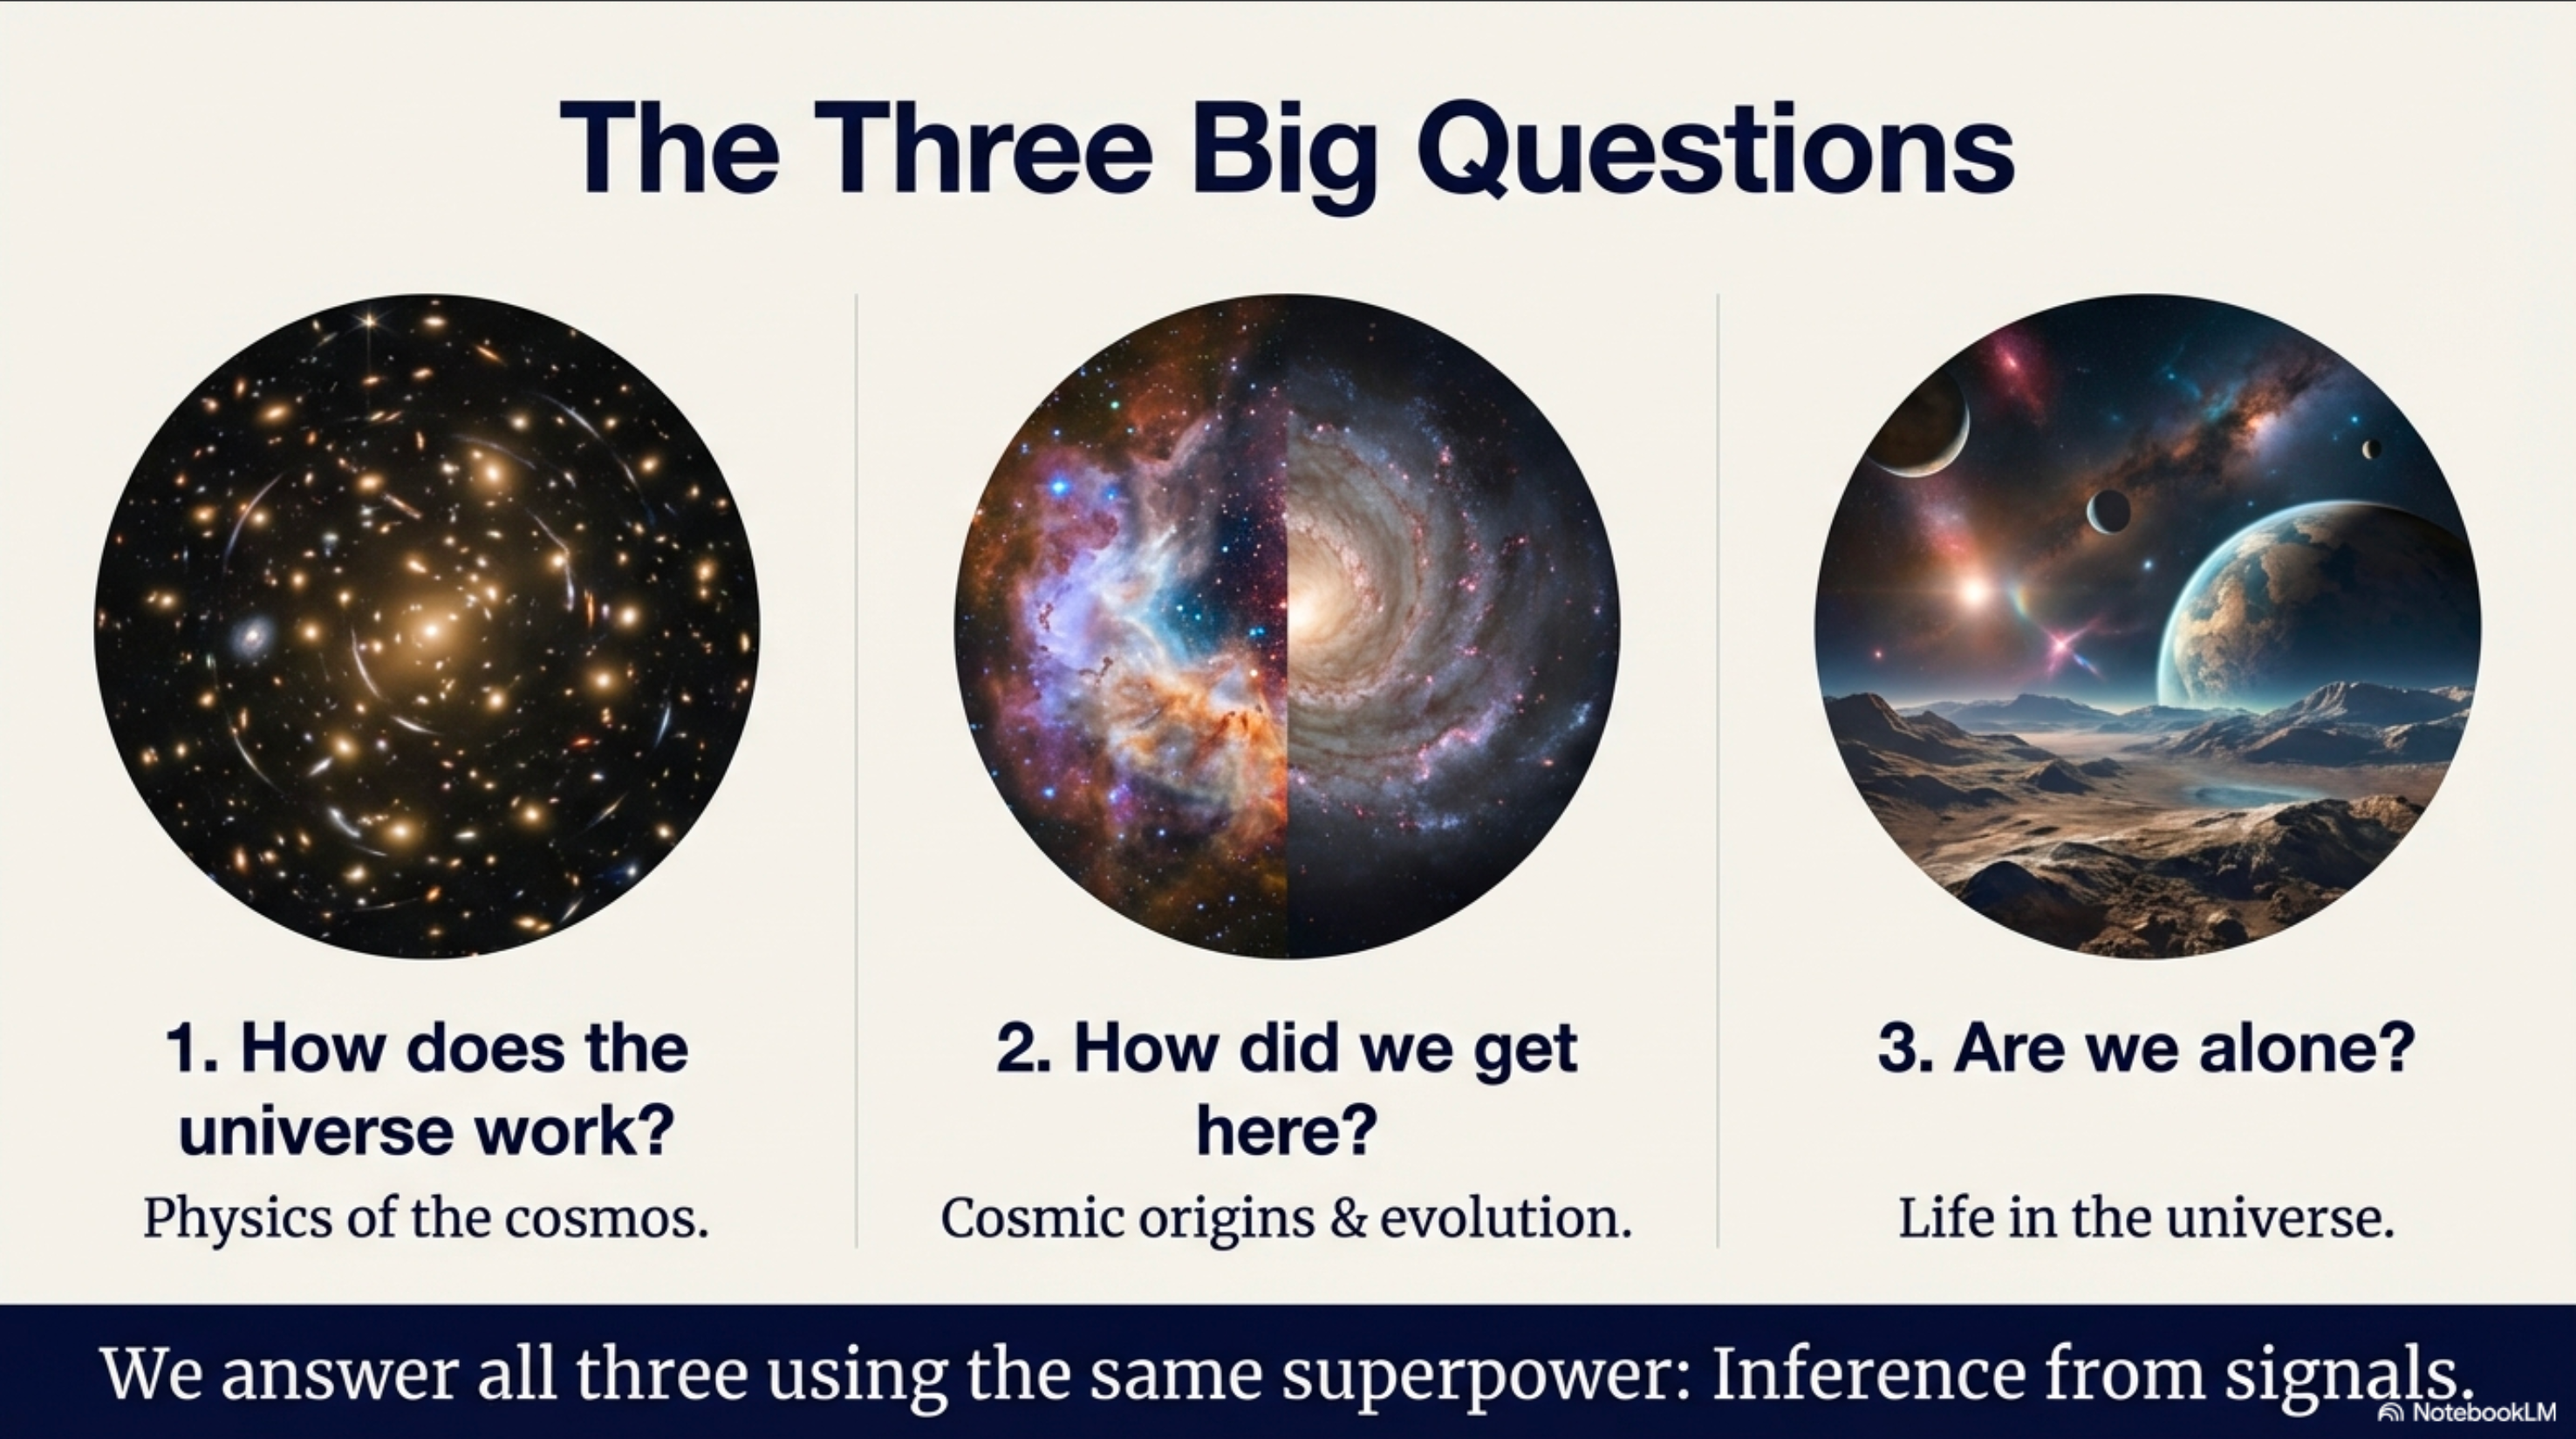
The Course Thesis
Think about this: every piece of information you’ve ever heard about the cosmos — the Sun’s temperature, the age of the universe, the composition of a distant star — none of it came from collecting samples. We can’t scoop up a piece of a star. We can’t fly to the edge of the universe with a tape measure. We’re stuck here on Earth (mostly), looking up at points of light.
And yet, somehow, we know that:
- The Sun’s surface temperature is about 5,800 K
- The nearest star is 4.2 light-years away
- Stars are mostly hydrogen and helium
- The universe is about 13.8 billion years old and expanding
How is any of that possible? The answer is the thesis of this course:
Pretty pictures are not the answer
Pretty pictures → measurements → models → inferences
Every gorgeous astronomical image you’ve ever seen is actually a dataset. The colors, the shapes, the bright spots and dark lanes — all of it encodes physical information. The job of an astronomer is to decode that information using physics and mathematics.
Inference
Drawing conclusions about quantities we cannot directly access (like a star’s temperature) from quantities we can measure (like its color). Inference requires a model — a physical relationship connecting observable to unobservable.
DigressionPretty pictures are data
Astronomical images are built from photon counts, not snapshots. Colors are often assigned to make invisible wavelengths visible to human eyes.
So astronomy is
The Four Things We Can Actually Measure
Here’s the humbling truth that makes astronomy both challenging and beautiful: from our cosmic vantage point, staring at points of light billions of kilometers away, we can directly measure only four types of things.
Reading tip: treat the tables in this reading as reference maps — don’t memorize them. You’ll revisit each one when it matters.
Four direct observables
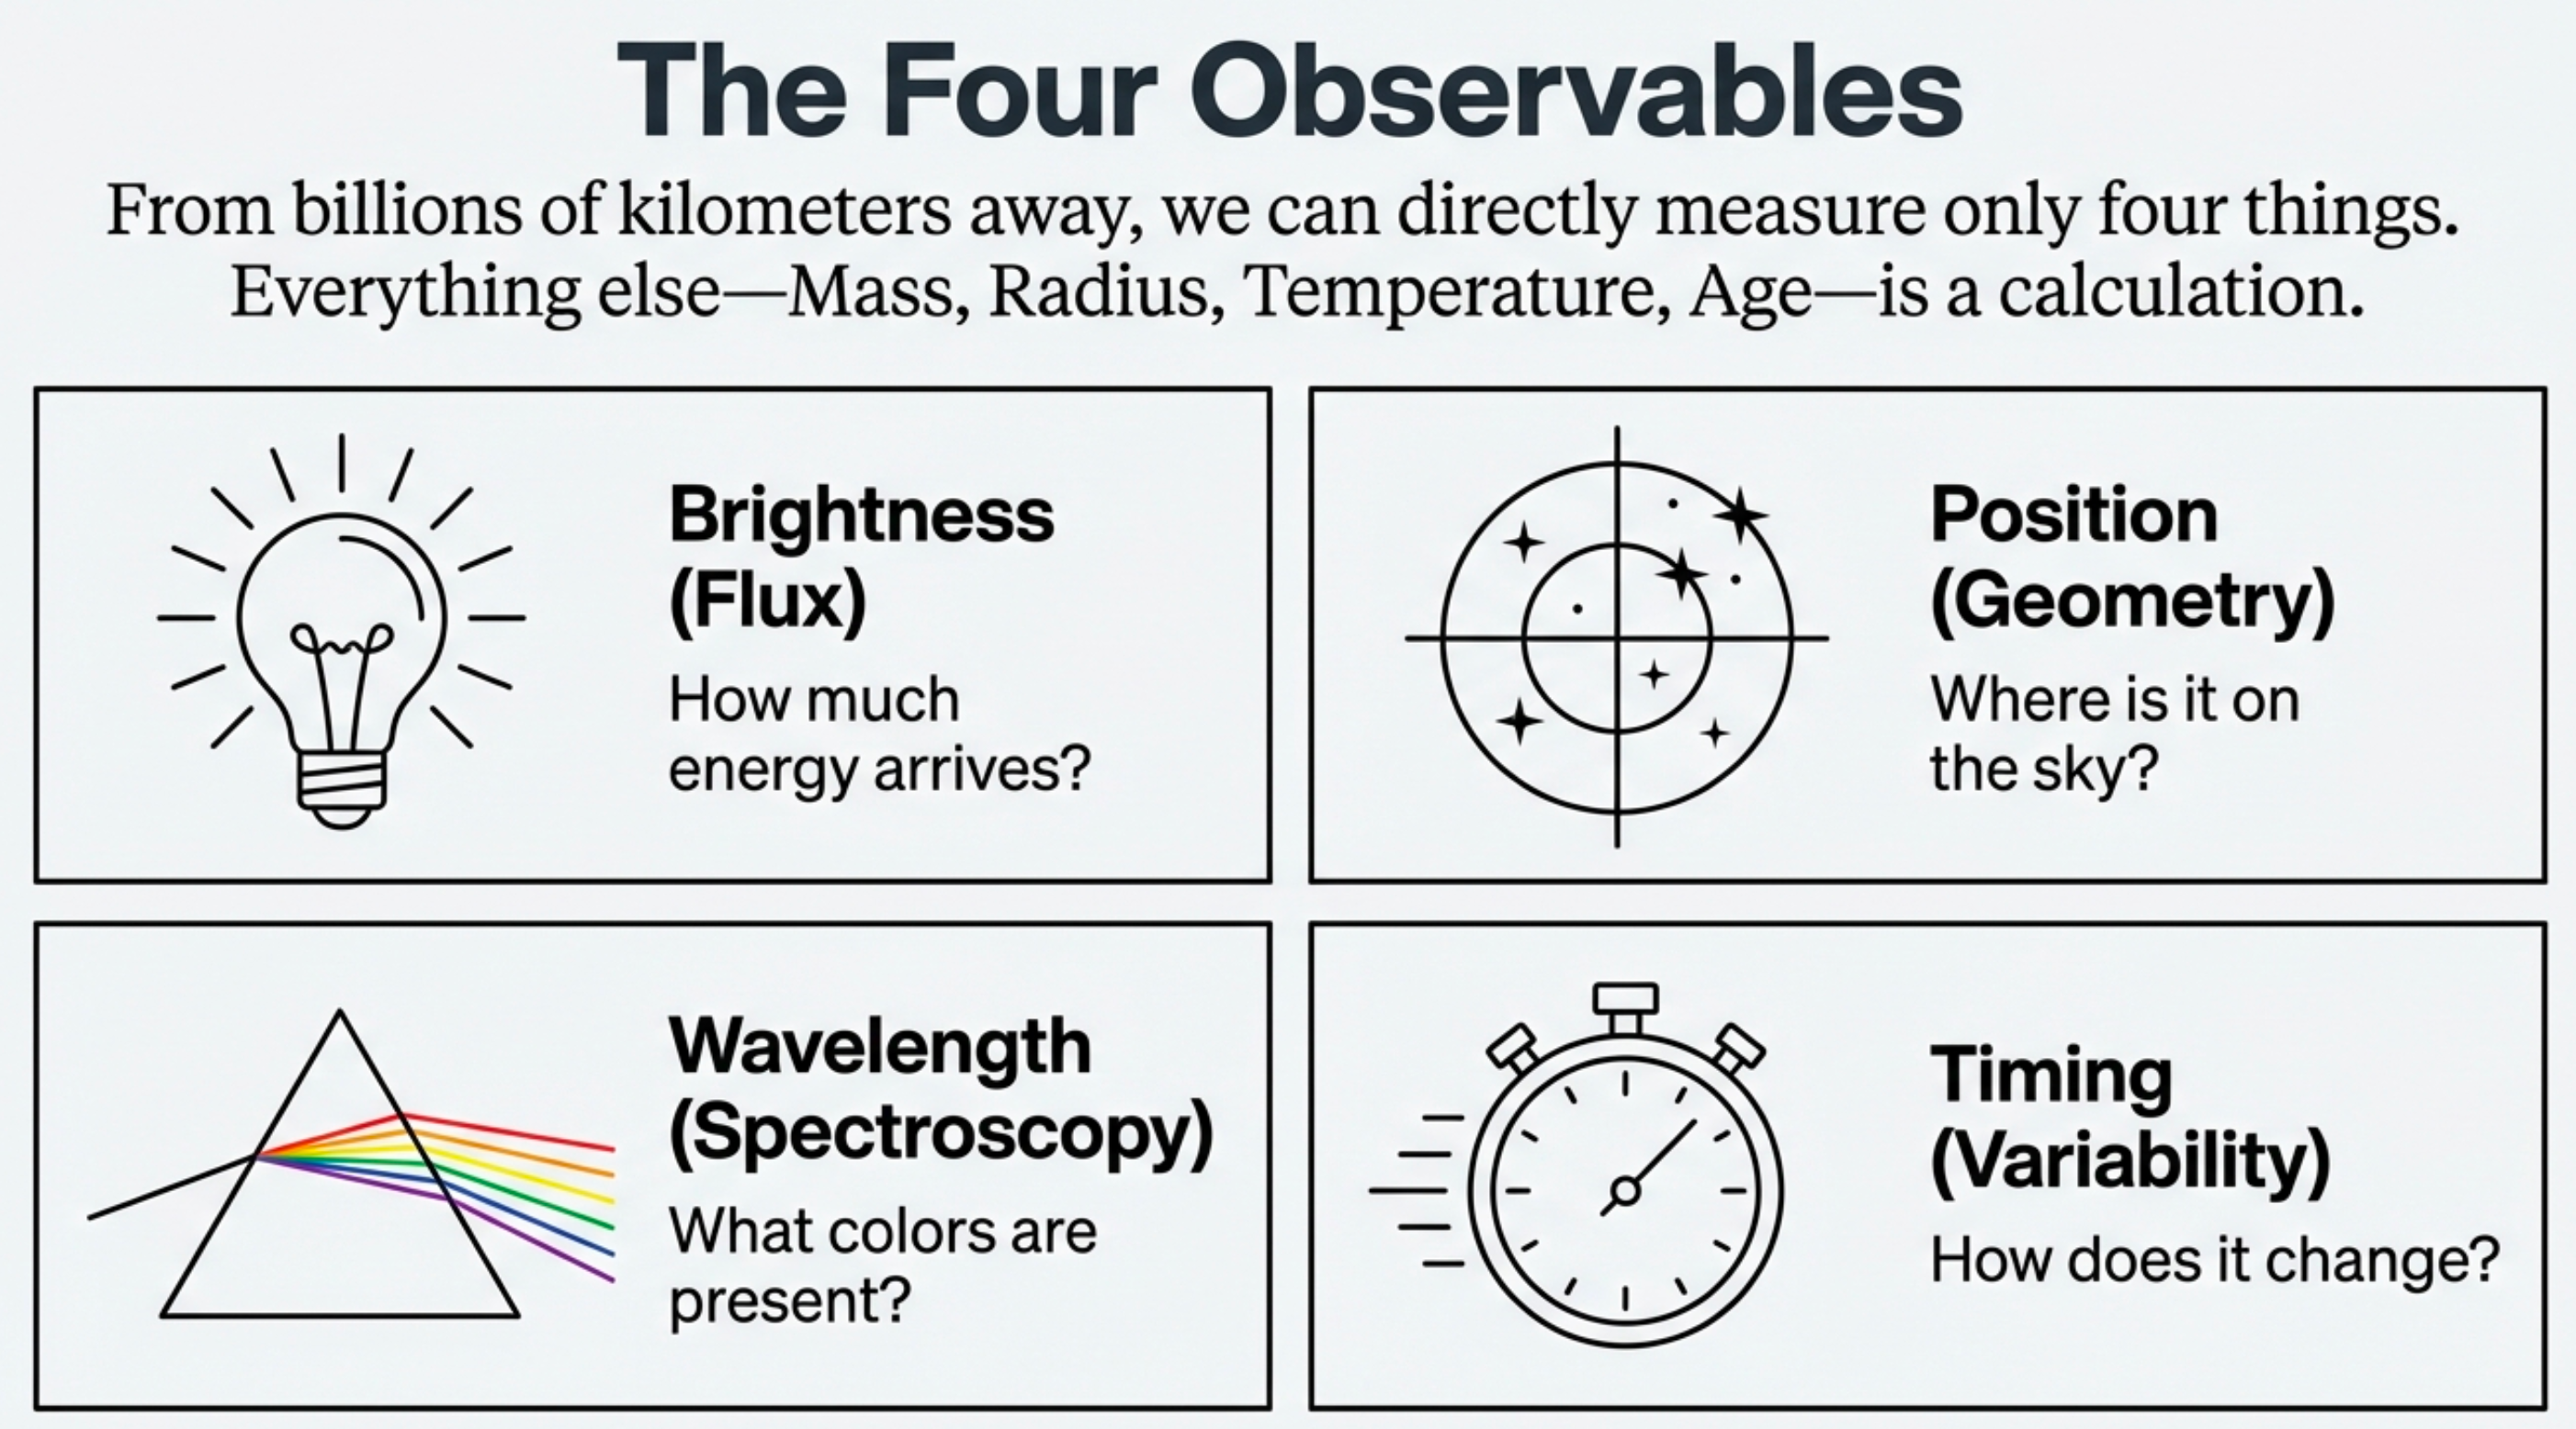
Let’s sharpen what each one means:
Brightness is the rate at which light energy arrives at your detector — photons per second per unit area. We literally count photons. This is the raw signal, and it depends on two things we can’t disentangle from brightness alone: how luminous the source truly is, and how far away it is. A dim nearby candle and a brilliant distant lighthouse can appear equally bright.
Position is where an object appears on the sky, measured in angles. This is purely geometric — we’re mapping locations on a celestial sphere. But position becomes powerful when we track changes: the annual wobble from Earth’s orbit (parallax), the slow drift across the sky (proper motion), or the periodic wobble caused by an unseen companion.
Wavelength is the key to spectroscopy. By spreading light into its component wavelengths, we transform a single brightness measurement into thousands of data points — brightness as a function of wavelength. This spectral information encodes temperature (through the overall color), composition (through absorption and emission lines), and motion (through Doppler shifts).
Timing is special: it’s both a measurement in its own right (when did this pulse arrive?) and a way to extract additional information from the other three. A star whose brightness varies periodically tells us something a constant star doesn’t. An object whose position shifts tells us about motion. Timing transforms static snapshots into dynamic movies.
DigressionKey insight
Timing unlocks physics that static measurements miss. Variability reveals masses (through orbits), sizes (through eclipses), and internal structure (through pulsations).
A star appears to wobble periodically in its position on the sky. Which of the four observables is this, and what might we infer from it?
This is Position (tracked over time via Timing). We might infer the star has an unseen companion — a planet or another star — whose gravitational pull causes the wobble.
What’s NOT on This List
Notice what you cannot directly measure:
| Property | How We Infer It |
|---|---|
| Temperature | From color/spectrum (hotter = bluer peak) |
| Composition | From spectral absorption/emission lines |
| Distance | From parallax, brightness + known luminosity, or other methods |
| Luminosity | From brightness + distance |
| Mass | From orbital motion (gravity reveals mass) |
| Size (radius) | From luminosity + temperature, or from eclipses |
| Age | From stellar evolution models |
Every single one of these fundamental properties must be inferred by combining measurements with physical models. The gap between “what we measure” and “what we want to know” is bridged by physics. That bridge takes the form of models — mathematical relationships that connect observables to physical quantities. We’ll formalize this in Section 1.3.
A student claims: “Astronomers measured the temperature of that star to be 5,800 K.” Is this technically accurate? If not, what did they actually measure, and how did they get to temperature?
The statement is imprecise. Astronomers measured the star’s spectrum or color (wavelength distribution). They inferred temperature using the physical relationship between temperature and peak emission wavelength — hotter objects emit bluer light. Temperature is never directly measured; it’s always inferred from wavelength observations via a model.
A Taste of What “Decoding” Means
Here’s a concrete example of the decoder ring in action.
Suppose you observe two stars of the same type (same intrinsic properties), but one appears 4× fainter than the other. Why might that be?
If they’re truly identical, the fainter one must be farther away. But how much farther? This is where physics enters. Light spreads out as it travels, and the amount of light you receive decreases with the square of the distance. So if Star B is 4× fainter than Star A, Star B must be 2× farther away (because ).
That’s one measurement (relative brightness), one physical law (the inverse-square law), one inference (relative distance). This is what “decoding” means.
Brightness is not distance
An otherwise identical star appears nine times fainter. How many times farther away is it?
Numeric answer
A third star of the same type appears 9× fainter than the reference star. How much farther away is it? (Give the distance ratio.)
3× farther, because .
Flux
Light energy per unit time per unit area reaching your detector — the precise, measurable version of “brightness.”
Luminosity
The total light energy a source emits per unit time — an intrinsic property of the object, independent of how far away it is.
Prediction Moment
Look at the first image in the spoiler reel below (the colorful nebulae). Before reading the explanation, commit to a guess. There's no wrong answer — this is about surfacing your intuitions.
Hold these guesses. We'll see how they compare to the physics as the spoiler reel unfolds.
The Spoiler Reel: Decoding Light
What follows is a tour through some of the most spectacular astronomical images humanity has ever captured. But we’re not just sightseeing. For each image, we’ll ask three questions:
- What do we measure?
- What do we infer?
- What physics makes that inference legal?
You are not expected to understand all the answers yet. That’s what the rest of the semester is for. Today, we’re giving you the spoilers — showing you where we’re headed. By the end of the course, you’ll have earned the right to say these things with confidence.
DigressionThe pattern to watch for
Every spoiler follows the same structure: measurement → model → inference. By the end of this course, you’ll be able to fill in the “what physics” part yourself.
The Narrative Arc: Where We’re Going
Mini-Glossary (Orientation Only)
This glossary is here to help you recognize terms when you see them — not to memorize them. Every term below will be reintroduced later, in context, with time to understand it properly. For now, just scan and move on.
| Term | One-Line Definition |
|---|---|
| Photon | A “packet” of light; the quantum of electromagnetic radiation |
| Wavelength (λ) | The spatial period of a light wave; determines the “type” of light |
| Spectrum | Brightness measured as a function of wavelength |
| Flux | Light energy per unit time per unit area reaching your detector |
| Luminosity | Total light energy emitted by a source per unit time |
| Emission | Light produced and sent out by a source |
| Absorption | Light removed from a beam by intervening material |
| Extinction | Dimming of light by dust (absorption + scattering combined) |
| Ionized | An atom that has lost one or more electrons; electrically charged |
| Neutral | An atom with equal numbers of protons and electrons; no net charge |
| Thermal radiation | Light emitted due to an object’s temperature (all hot objects glow) |
| Dark matter | Invisible matter detected through gravity; outweighs visible matter ~5 |
| Dark energy | The unknown driver of accelerating cosmic expansion; ~68% of the universe |
| Redshift | Stretching of light wavelengths; for distant galaxies, caused by cosmic expansion |
Light encodes physics
Spoiler 1: Nebulae — Color as Encoded Physics
Color is encoded physics
![Annotated nebula image showing three labeled features: (1) Hydrogen-Alpha at 656.3 nm in red regions indicating ionized gas, (2) Doubly-ionized Oxygen [OIII] at 500 nm in blue-green regions indicating extremely low density, (3) Dark Lanes showing silhouettes of interstellar dust blocking the light.](/astr201/figures/forensic-nebula.png)
Structured colors at specific wavelengths
Red light at 656 nm. Blue-green light at 496–501 nm. Dark regions where light is blocked.
Atoms emit at fingerprint wavelengths
Atoms emit light at specific wavelengths, not random colors. Each element has a unique fingerprint of wavelengths set by its atomic structure. When we see red light at exactly 656 nm, we know hydrogen is present.
Which gas is where — and what's blocking it
The red regions contain hydrogen gas heated and ionized by nearby hot stars. The blue-green regions contain oxygen. The dark lanes contain dust — tiny solid particles that absorb and scatter starlight.
Key insight: color isn’t decoration — it’s encoded physics. Specific wavelengths = specific atoms = specific conditions.
Transition: if colors encode what’s there, how do we figure out how far away it is?
Spoiler 2: The Distance Ladder — How Far Is Far?
Brightness becomes distance
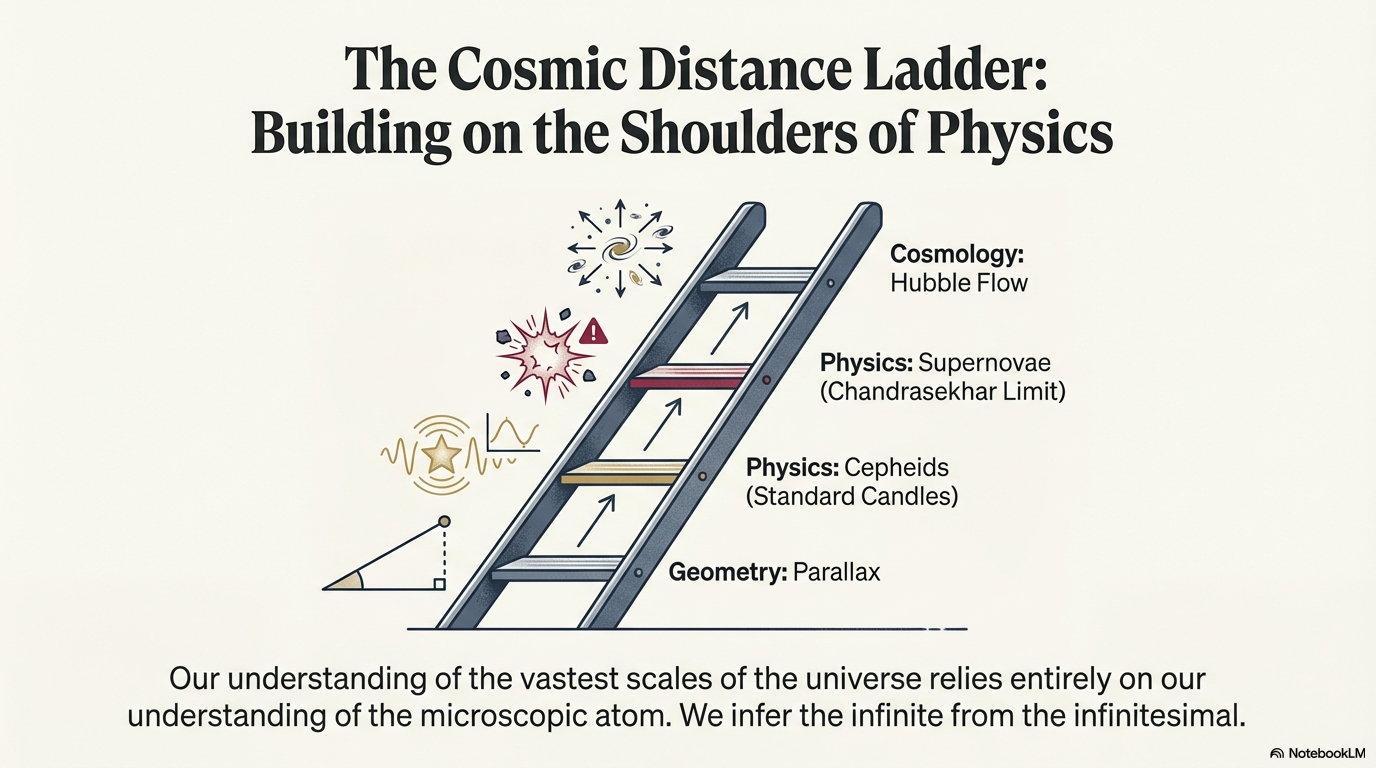
Standard candle
An object whose intrinsic luminosity can be determined independently (from pulsation period, spectral type, or explosion physics), allowing distance to be calculated from observed brightness.
Apparent brightness of milepost objects
Apparent brightnesses of certain “milepost” objects — stars that pulsate in predictable ways, or stellar explosions that reach consistent peak brightness.
The inverse-square law plus a known luminosity
If you know how bright something truly is (its luminosity) and measure how bright it appears (its flux), the inverse-square law lets you calculate distance.
Distances out to billions of light-years
Distances far beyond what geometry alone can reach — out to billions of light-years.
Key insight: distance is inferred from brightness. To measure farther, we need brighter
Transition: distance tells us where things are. But what are they made of?
Spoiler 3: Origin of the Elements — Stars as Nuclear Factories
The periodic table is a fossil record
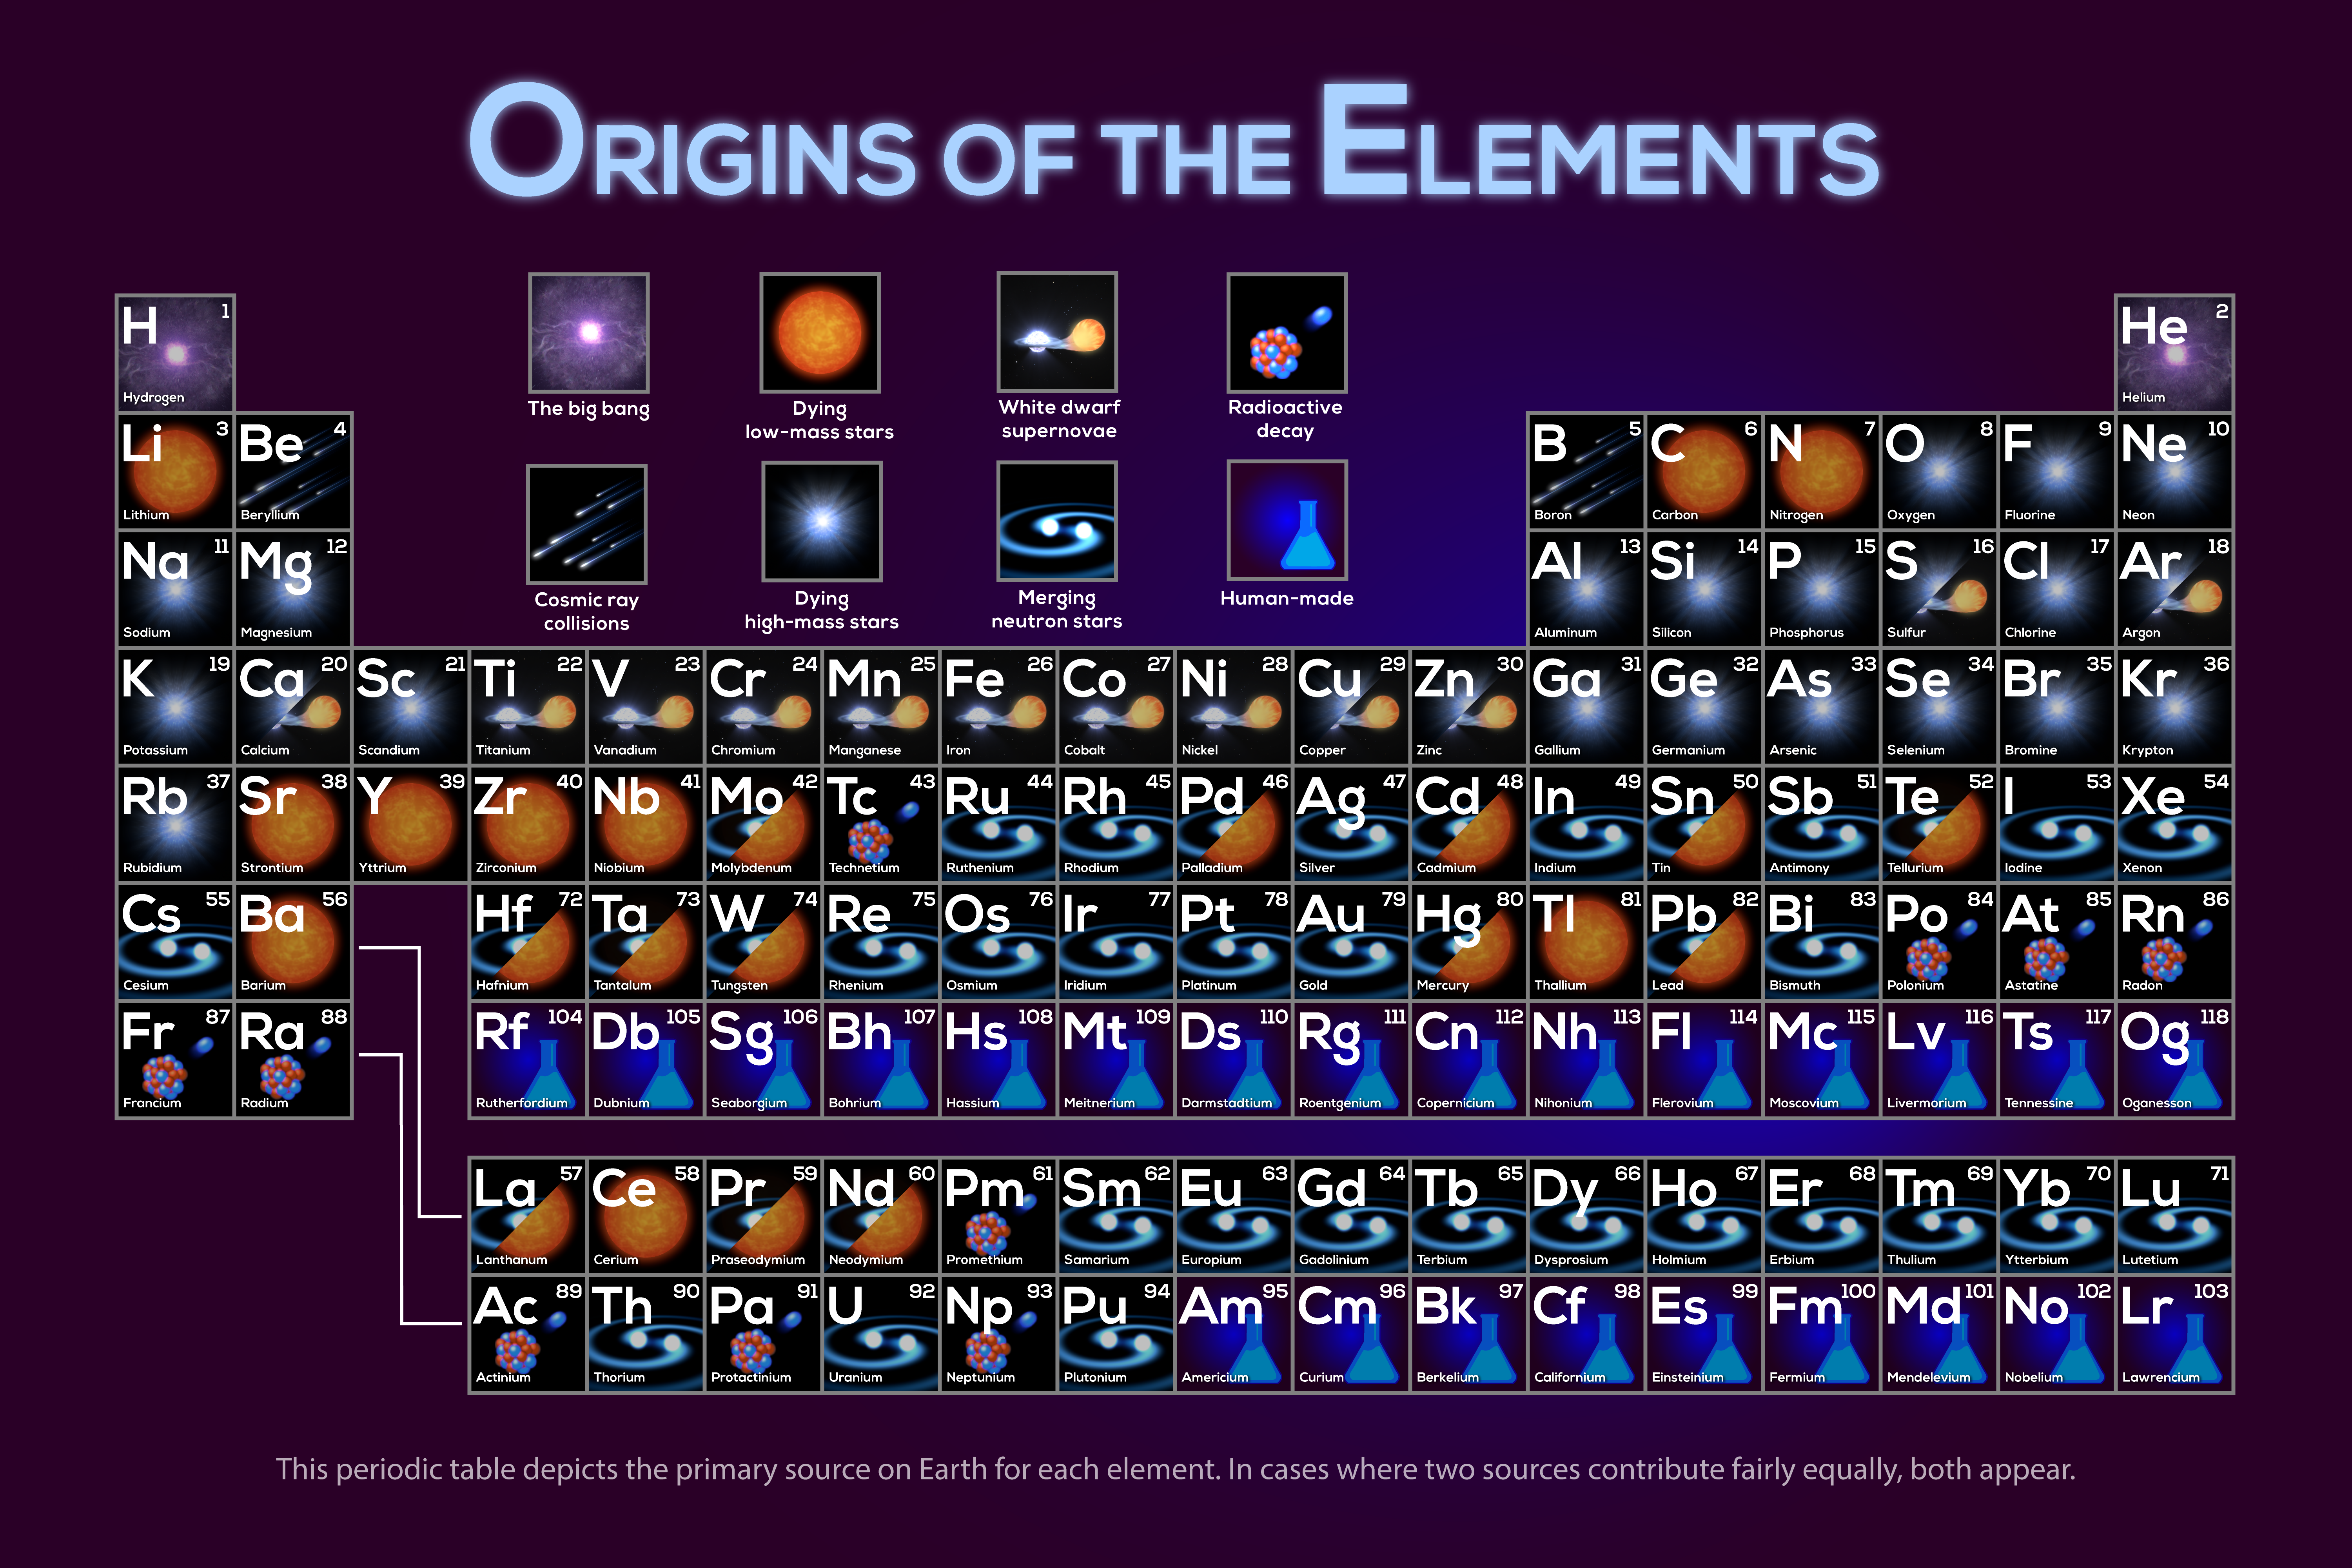
Element fingerprints and abundances
Element fingerprints in spectra — specific wavelengths absorbed or emitted — and abundances of elements in meteorites, stars, and gas clouds.
Nucleosynthesis: each process leaves fossils
Nuclear reactions require specific conditions (temperature, density) and have specific products. The elements we find are fossils of the processes that created them.
Different cosmic environments made different elements
The periodic table is a fossil record of astrophysical processes — different sites made different elements.
Key insight: stars don’t just shine — they manufacture the periodic table. The atoms in your body were forged in stellar cores and explosions, scattered into space, and incorporated into a new solar system, and then into you. You are starstuff.
Transition: we’ve mentioned “wavelengths” and “spectra” several times. What exactly is a spectrum?
Spoiler 4: Dispersion — The Key to Everything
A spectrum turns one signal into thousands
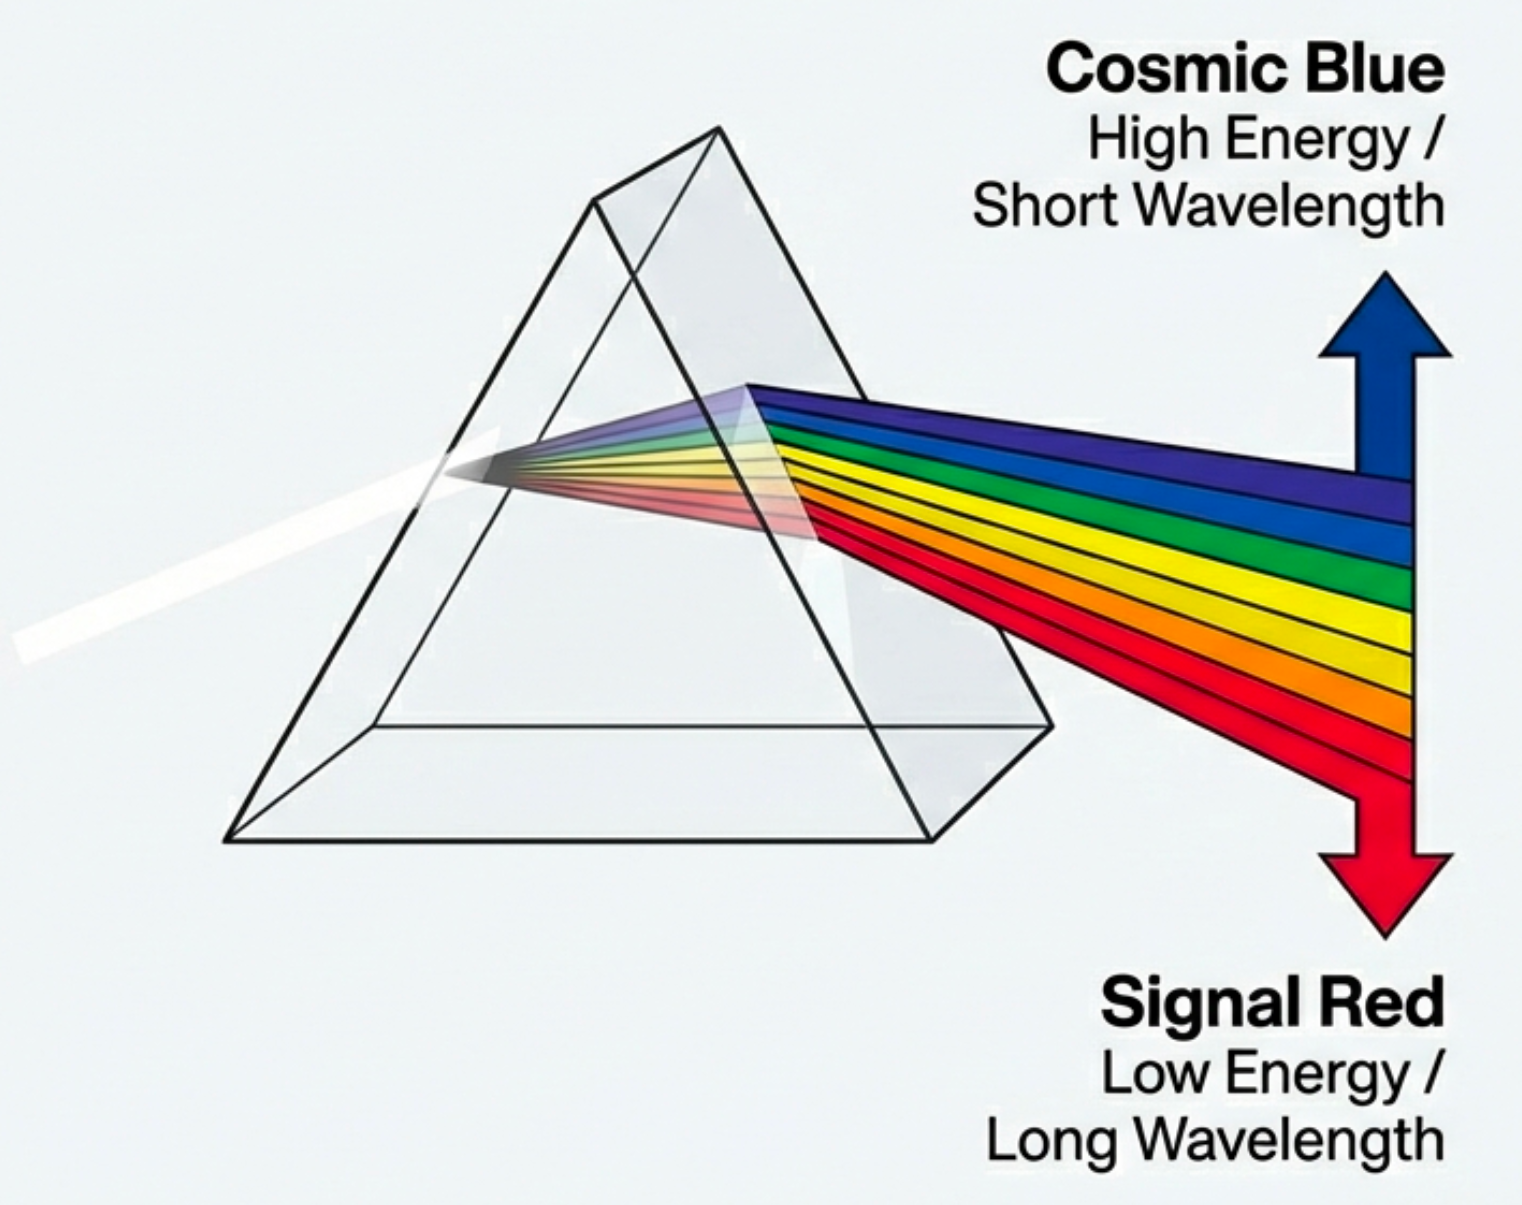
Spectroscopy
The technique of spreading light into its component wavelengths and measuring brightness as a function of wavelength. It turns a single brightness measurement into thousands of data points encoding temperature, composition, and motion.
White light spreads into a rainbow
When “white” light passes through a prism (or diffraction grating), it spreads into a rainbow.
Different wavelengths bend by different amounts
Different wavelengths travel at different speeds through glass, causing them to bend by different amounts and separate spatially.
Light is a mixture of many wavelengths
Light contains many wavelengths simultaneously. “White” is a mixture; each color corresponds to a different wavelength.
The breakthrough: a prism doesn’t just make rainbows — it gives you the power to decode what’s hidden inside the light. This is
Quick check
Why is spectroscopy more powerful than just measuring total brightness?
Spectroscopy spreads light into its component wavelengths, giving you brightness as a function of wavelength — thousands of data points instead of one. This reveals temperature, composition, and motion that a single brightness measurement cannot.
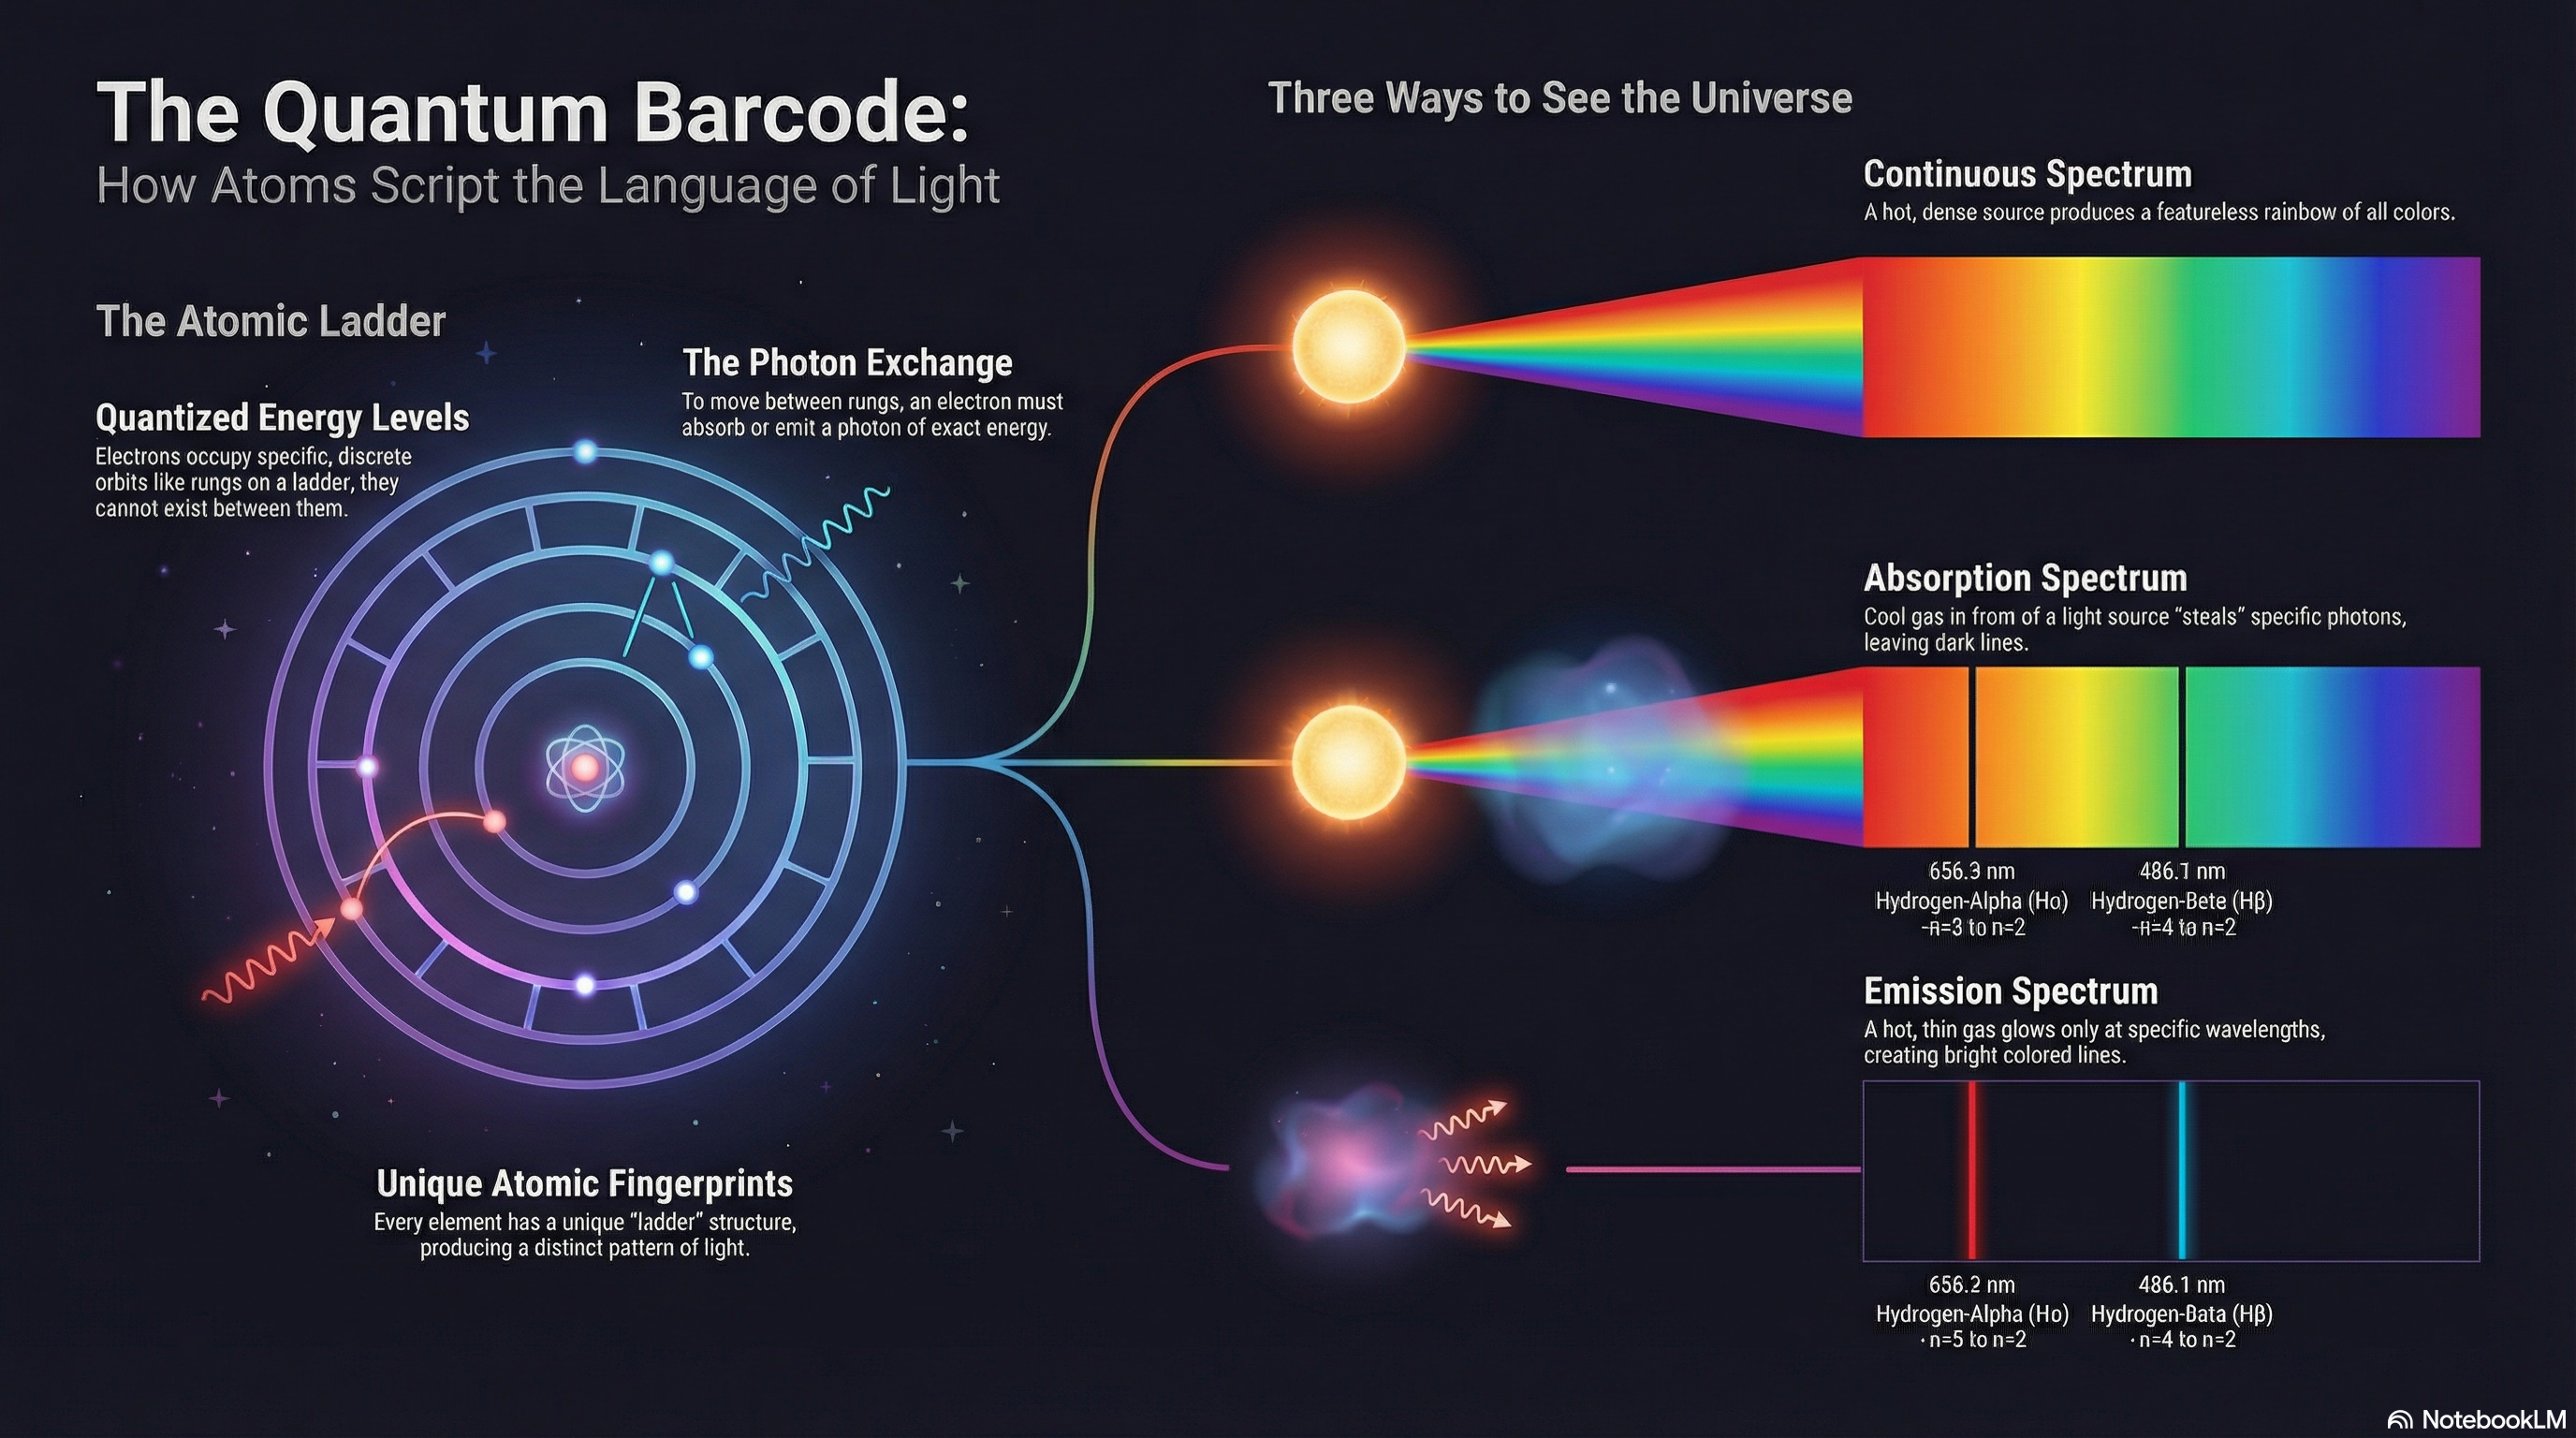
But why do atoms produce light at specific wavelengths rather than a continuous rainbow? The answer is quantum mechanics: electrons in atoms can only occupy certain discrete energy levels. When an electron jumps between levels, it absorbs or emits a photon of exactly the right energy — and energy determines wavelength. Each element’s unique ladder of energy levels creates its unique spectral fingerprint.
Here’s something crucial: those fingerprints are stable — hydrogen always produces the same pattern of wavelengths. But when the source moves toward or away from us, the entire fingerprint shifts in wavelength. Moving toward us? The wavelengths compress (shift blue). Moving away? They stretch (shift red).
Doppler effect
The shift in observed wavelength caused by relative motion between source and observer: compression (blueshift) for approach, stretching (redshift) for recession. It lets us measure the speeds of stars, galaxies, and the expanding universe using light alone.
This is the
Transition: the rainbow from a prism shows visible light. But visible light is just a tiny slice of all the light that exists…
Wavelength Changes What We See
Wavelength changes what we see
Spoiler 5: The Electromagnetic Spectrum — A Map of Physical Processes
Wavelength maps physical conditions
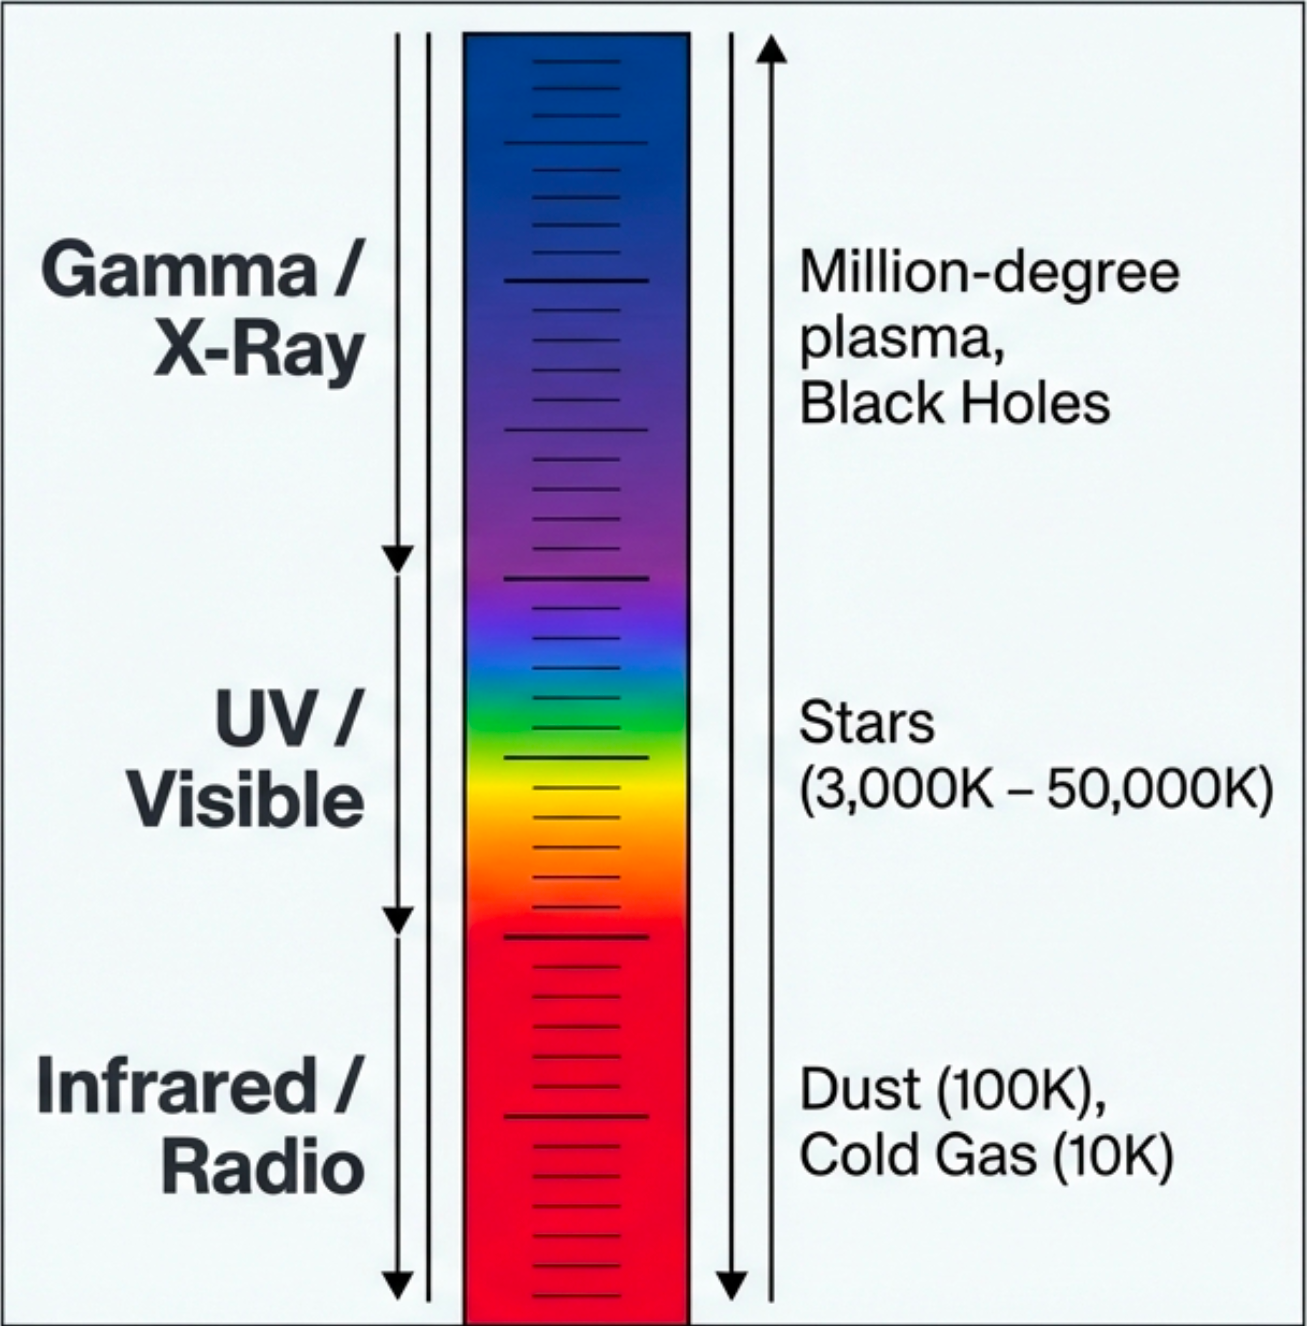
Photons across the entire EM spectrum
Photons across the entire electromagnetic spectrum — from radio waves with wavelengths of meters to gamma rays smaller than atoms.
Photon energy is tied to wavelength
Photon energy is tied to wavelength. Hotter or more violent processes produce higher-energy (shorter-wavelength) photons.
Different wavelengths reveal different conditions
Different physical conditions produce different wavelengths. Cold gas glows at radio wavelengths; stellar surfaces shine in visible light; million-degree plasma emits X-rays.
Bottom line: wavelength tells you about temperature and violence. The EM spectrum is organized by physics, not human convention — it’s a map of physical conditions. Longer wavelength means lower energy (colder, gentler); shorter wavelength means higher energy (hotter, more violent).
Spoiler 6: Same Galaxy, Different Physics
Same galaxy, different physics
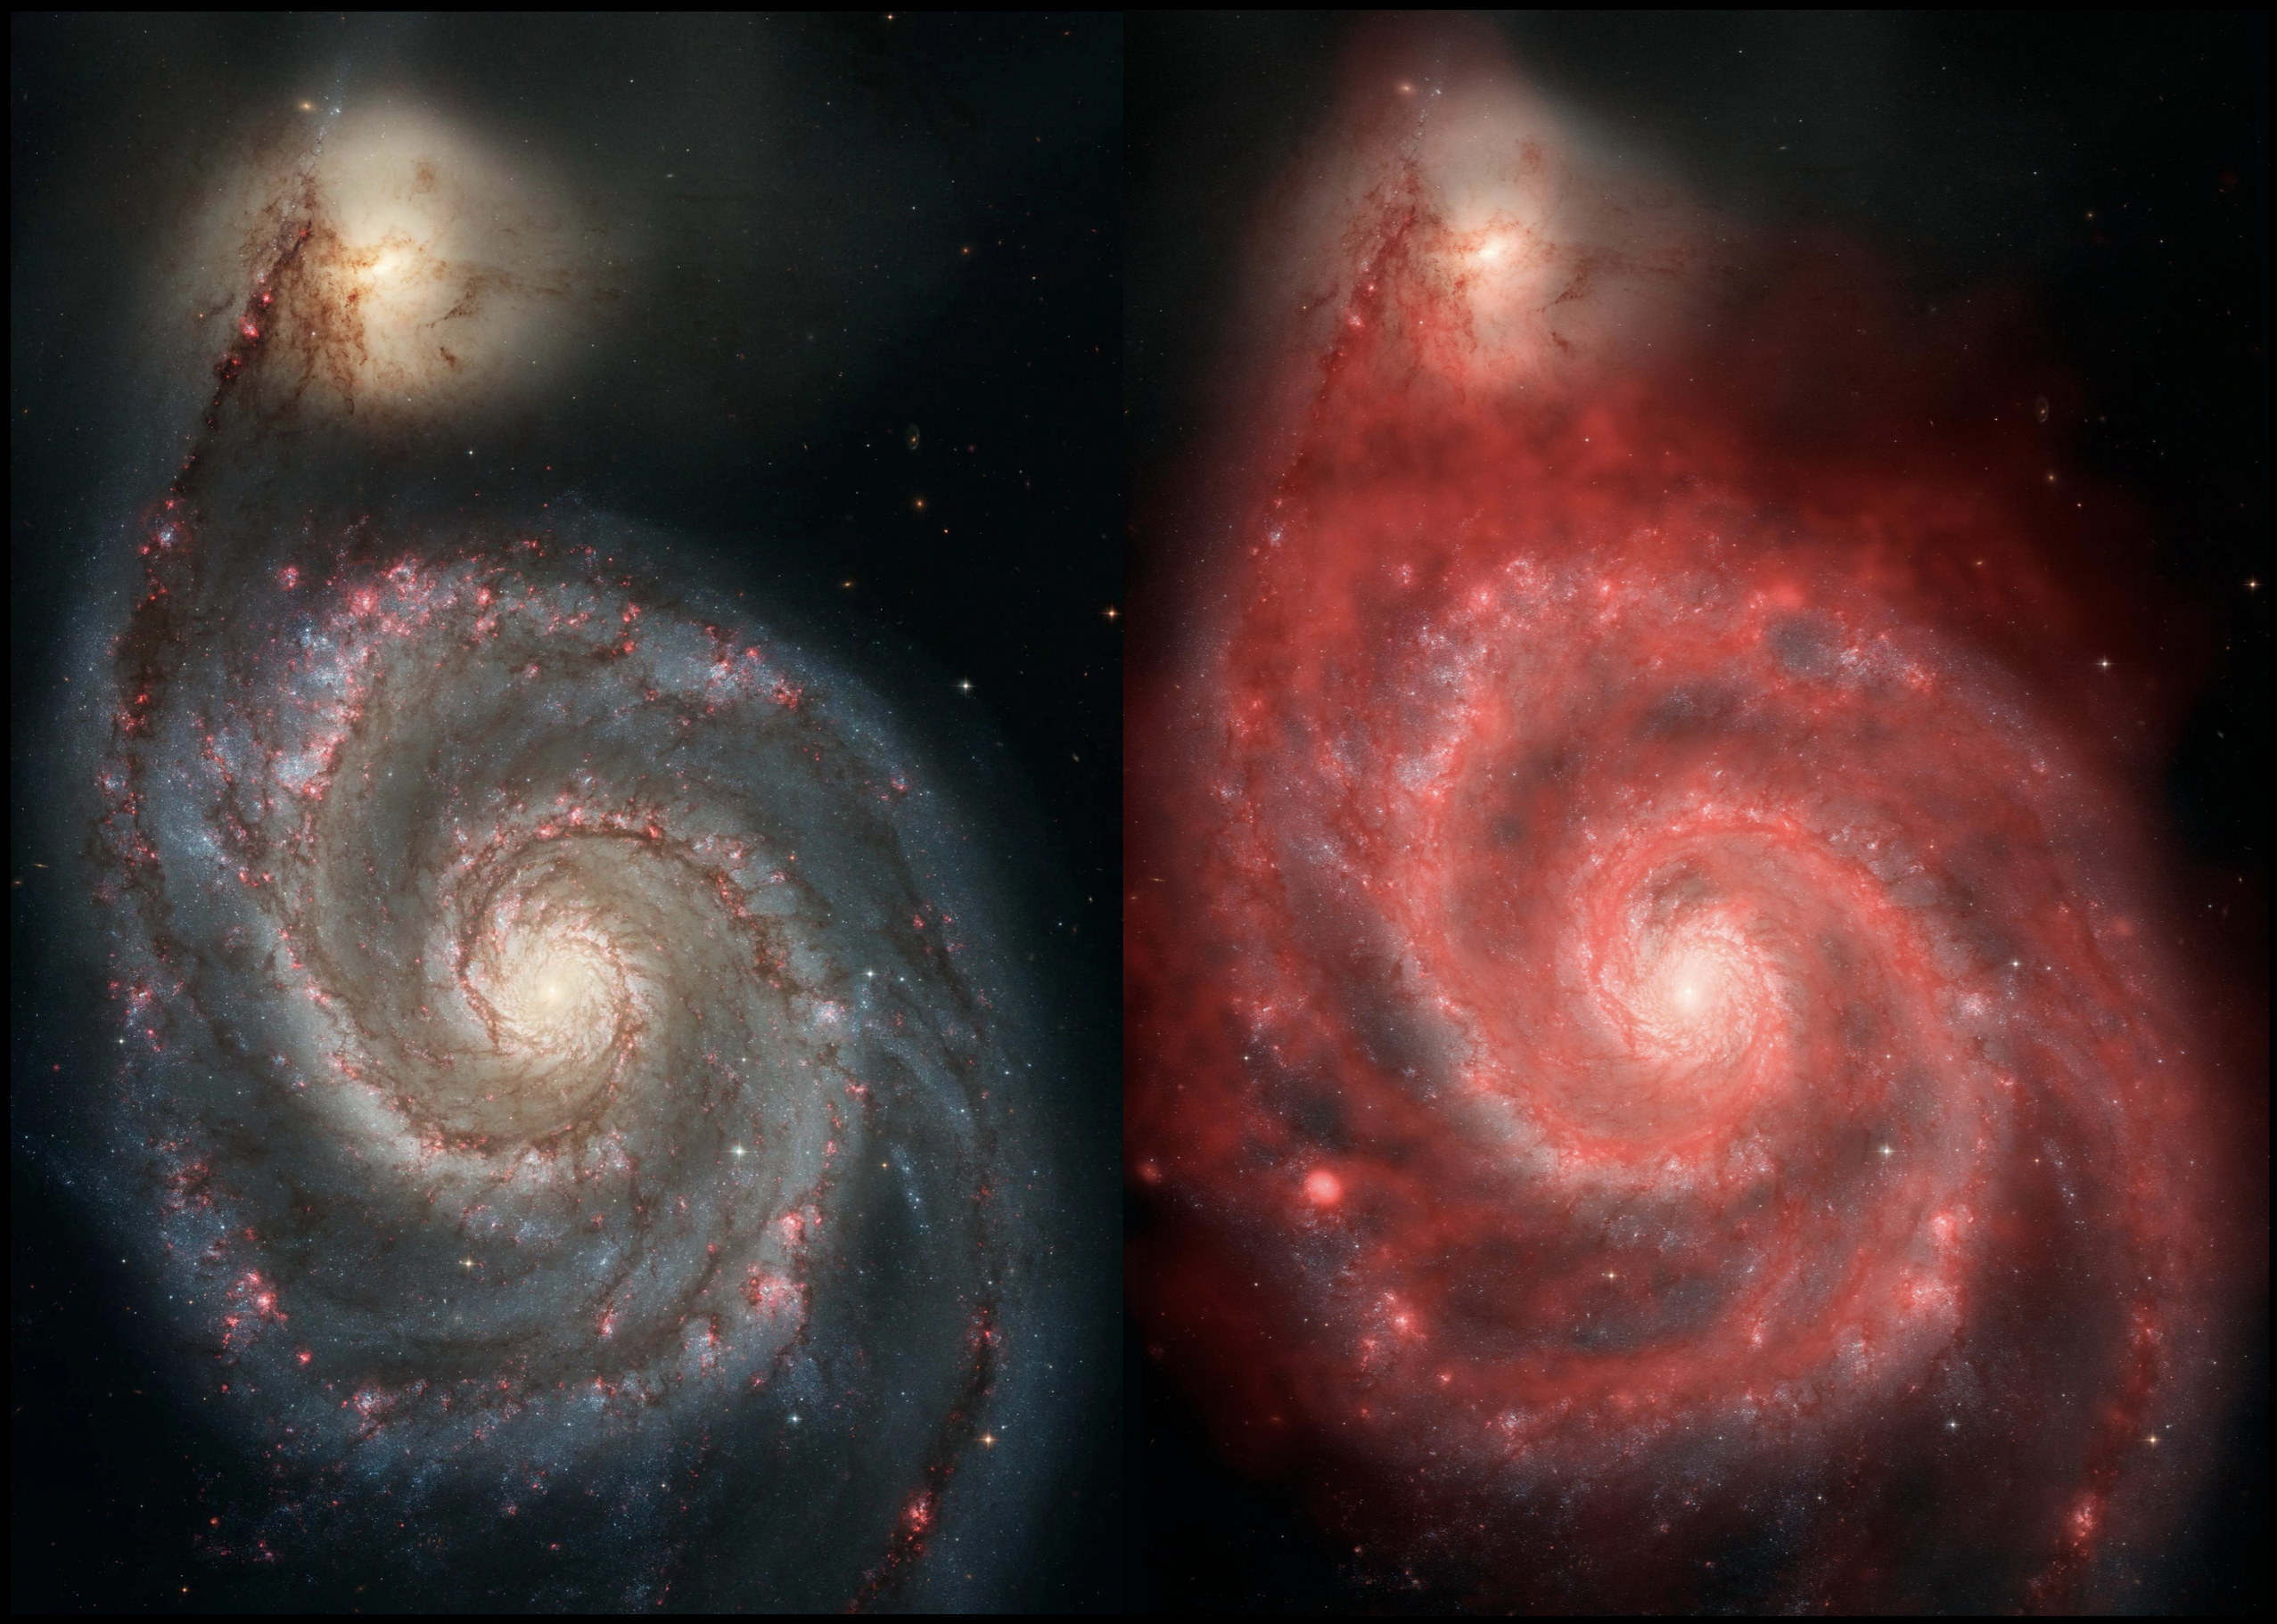
Optical starlight vs 21-cm radio emission
Optical starlight (~500 nm) from one observation; radio emission at 21 cm from another.
Different emitters at different wavelengths
Stars emit thermal radiation from their hot surfaces (peaking in the visible). Neutral hydrogen emits at exactly 21 cm due to a quantum mechanical transition in cold atomic gas.
Stars vs cold gas — and they don't overlap
The optical image shows where the stars are. The radio image shows where cold hydrogen gas lives. They don’t perfectly overlap.
Key insight: same object + different wavelength = different physical component revealed.
Transition: optical shows stars, but what if dust is blocking our view of where stars are born?
Spoiler 7: Pillars of Creation — Infrared Beats Dust
Infrared reveals what dust hides
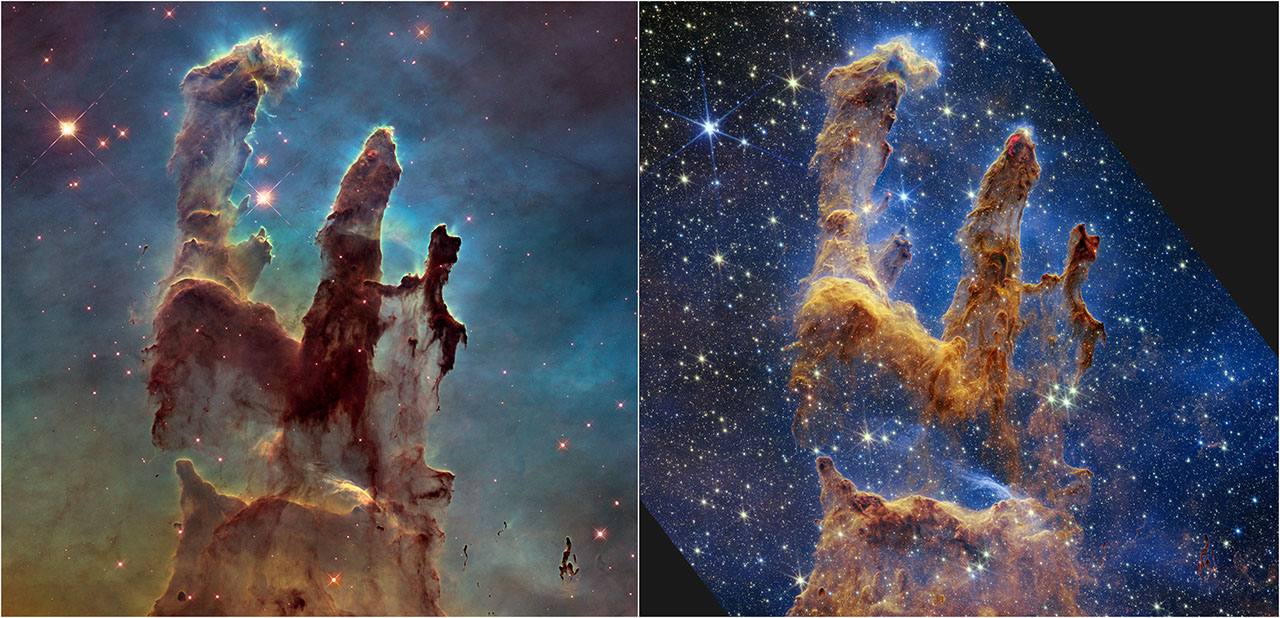
Dark pillars in optical, hidden stars in infrared
Optical: dark pillars. Infrared: thousands of previously hidden stars.
Dust blocks short wavelengths, not long ones
Dust grains (~0.01–1 μm) efficiently absorb and scatter light with comparable wavelengths. Longer wavelengths (infrared) pass through.
The 'empty' dark regions are full of newborn stars
Dust strongly blocks visible light but is transparent at infrared wavelengths. The “empty” dark regions are teeming with newborn stars.
DigressionJWST's superpower
At ~2 μm wavelength, dust absorbs roughly 10× less light than at visible wavelengths. JWST peers through cosmic dust that blocks Hubble.
Key insight: what you can’t see at one wavelength might be brilliantly visible at another.
Transition: we’ve seen how one alternative wavelength reveals hidden physics. What about combining many wavelengths?
Spoiler 8: The Crab Nebula — Many Windows, One Truth
Many windows, one physical system
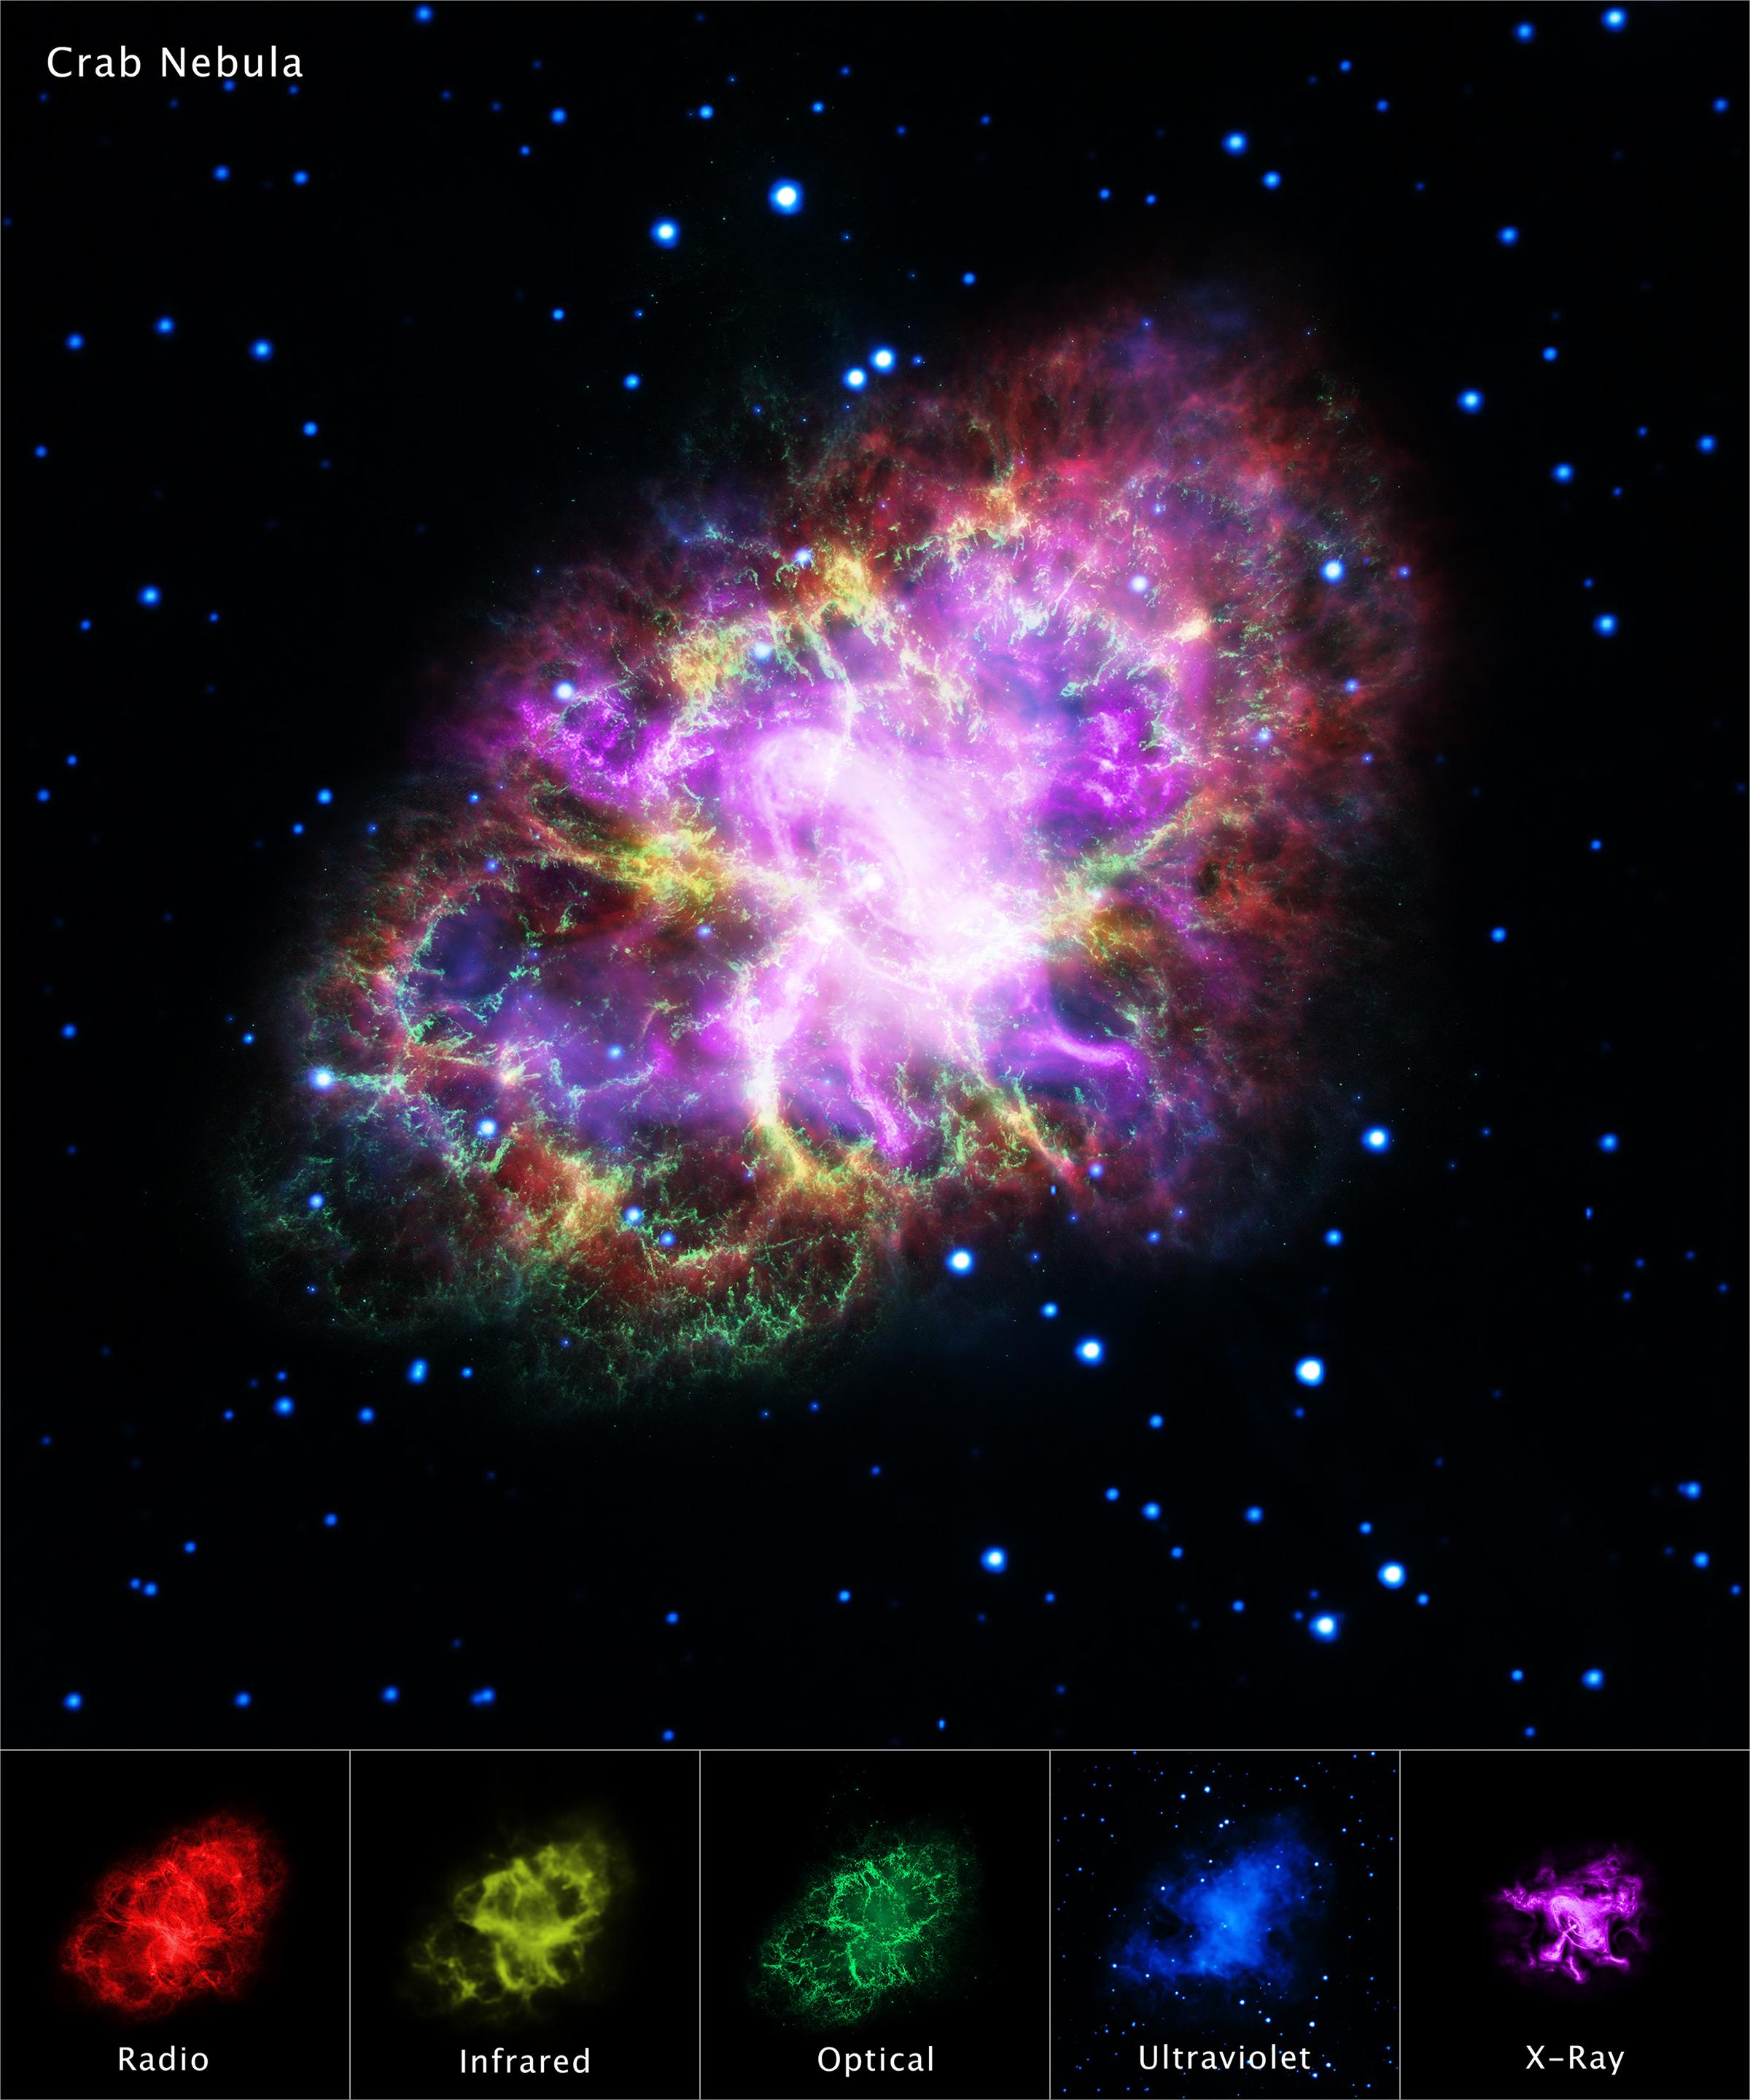
The Crab observed from radio through X-ray
The Crab observed from radio through X-ray. At each wavelength, it looks completely different.
Different emission mechanisms dominate at different wavelengths
Different physical processes — synchrotron radiation, thermal dust emission, ionized-gas line emission, hot-plasma X-rays — dominate in different wavelength bands.
Multiple physical components coexist
Radio: magnetic fields + relativistic electrons. Infrared: warm dust. Optical: ionized gas from the 1054 CE supernova. X-ray: hot plasma and the central pulsar’s jets.
Key insight: many windows, one truth. Only by combining wavelengths can we understand complex astrophysical systems.
The Dark and Evolving Universe
Spoiler 9: The Dark Universe — Most of Reality Is Invisible (and Not Static)
Most matter does not emit light
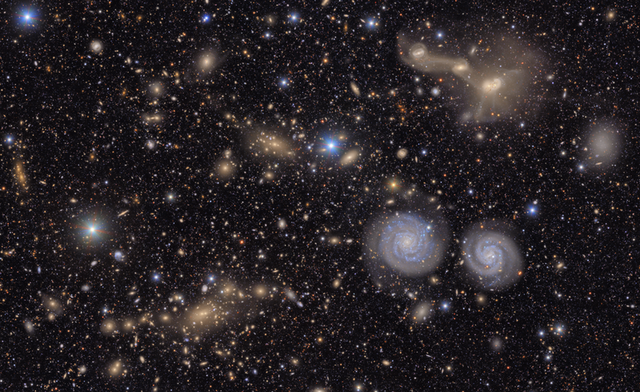
This spoiler chains together several observables, so it doesn’t fit the clean one-observable / one-model / one-inference pattern of the others. Watch the chain instead.
What do we measure? Velocities — and here’s how. When we spread starlight into a spectrum, we see absorption lines at specific wavelengths (the fingerprints from Spoiler 4). If those lines appear shifted from their laboratory (at-rest) wavelengths, the source is moving: lines shift → velocity. This is the Doppler effect in action. We measure how fast stars orbit within galaxies and how fast galaxies move within clusters — all by detecting tiny wavelength shifts in their spectra. We also measure how light bends as it passes near massive objects (gravitational lensing).
Why velocities matter: here’s the critical inference chain. Objects in orbit are constantly accelerating (changing direction). Acceleration requires a force. In space, the only force acting at these scales is gravity. And gravitational force depends on mass. So: Doppler shift → velocity → acceleration → gravitational force → mass.
What do we infer? Galaxies rotate too fast. Stars in the outer regions orbit at speeds that should fling them into intergalactic space — unless there’s far more mass than we can see. The same is true for galaxy clusters. When we calculate the mass required to explain the observed motions, it exceeds the visible mass by a factor of ~6. We infer the presence of dark matter — matter that doesn’t emit, absorb, or reflect light, but does exert gravitational pull.
What physics makes this legal? Newton’s law of gravity tells us that orbital speed depends on enclosed mass: . Measure and , solve for . The math is unambiguous. The extra mass is real — we detect it through the motions it causes.
Dark matter writes structure across the sky
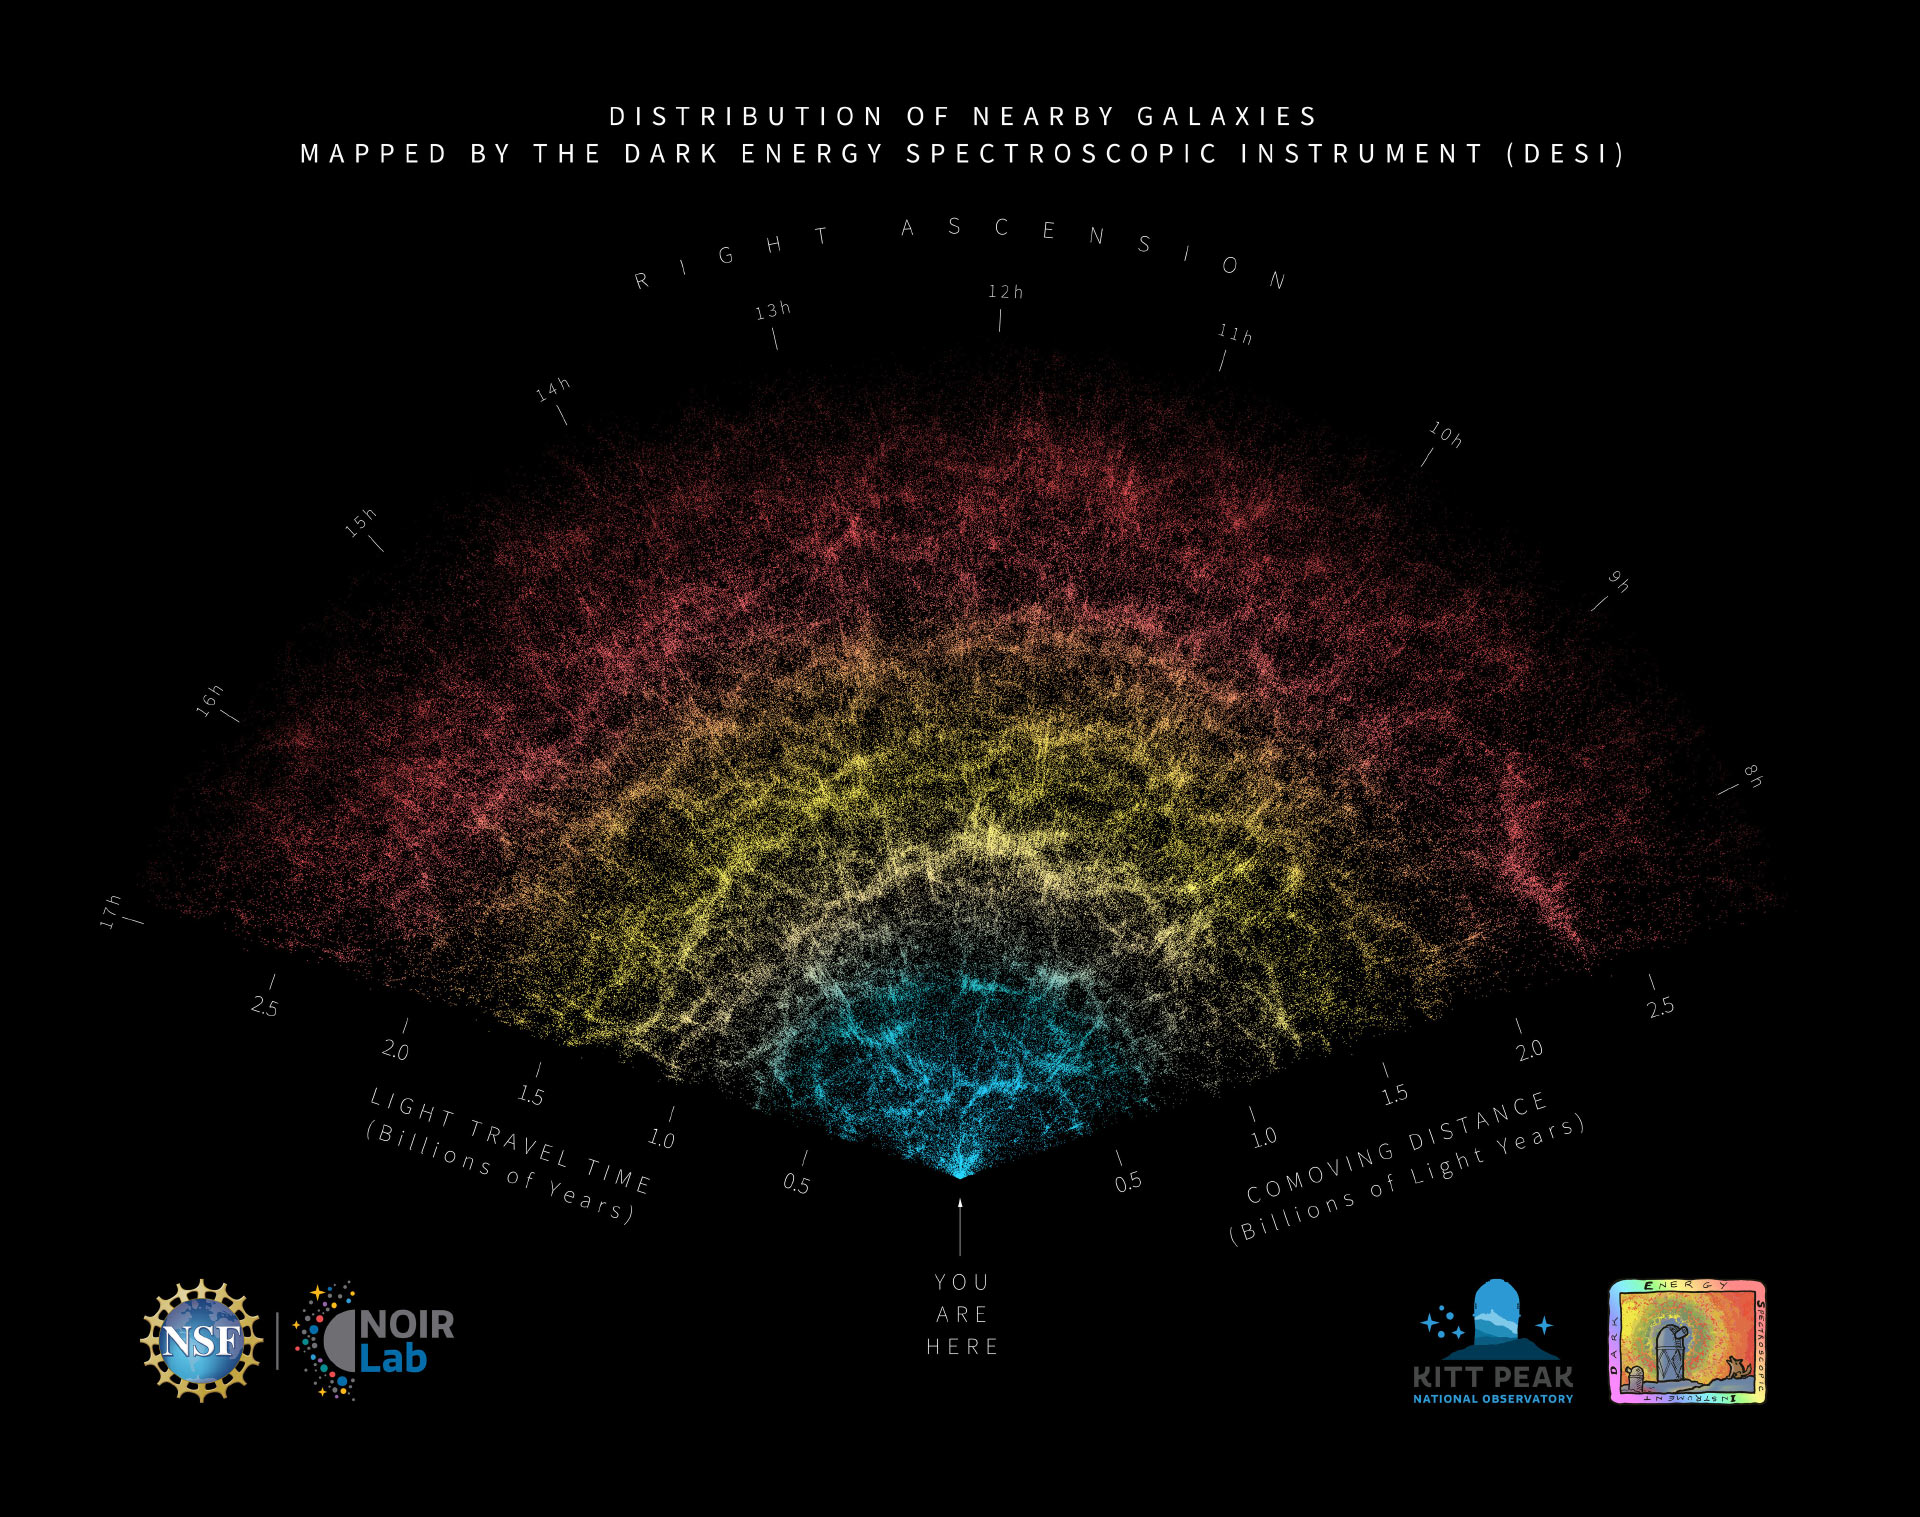
The cosmic web: when we map millions of galaxies in 3D (using redshifts for distances), we see that galaxies aren’t scattered randomly — they’re organized into a cosmic web of filaments, walls, and vast empty voids. This architecture is dark matter’s signature at the largest scales. And it’s still evolving: gravity pulls matter from voids into filaments, from filaments into clusters. The largest structures in the universe are still collapsing.
Key insight: motion reveals mass. Gravity causes acceleration; we measure velocities; the math tells us how much mass is required. Most of it is invisible — but the universe is not static, and gravity is still the architect, still building today.
Transition: dark matter tells us that most matter is invisible. But there’s something even stranger: most of the universe’s energy content isn’t matter at all…
Spoiler 10: Cosmic History — 13.8 Billion Years and Accelerating
Distance turns the universe into a history
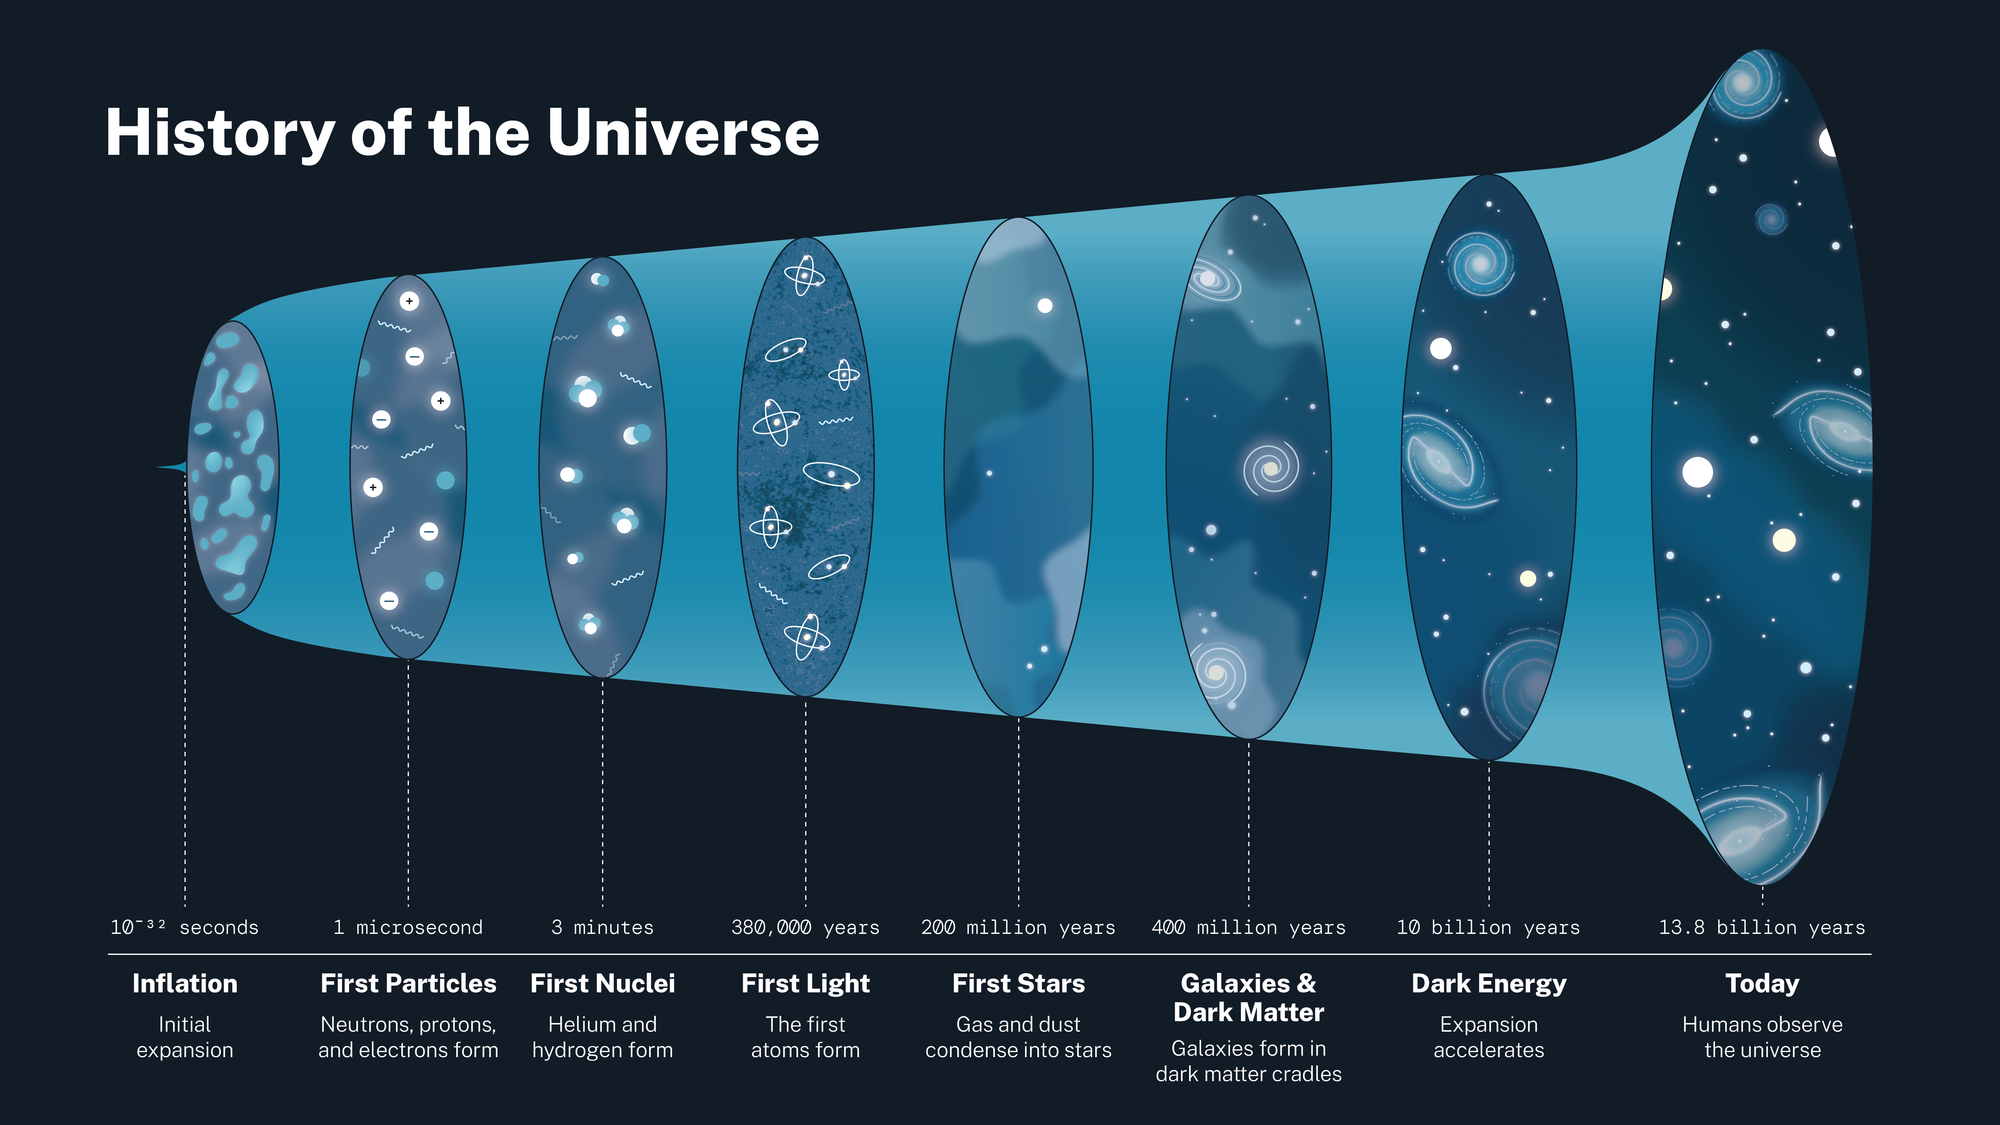
Like Spoiler 9, this one combines two measurements — distances and recession speeds — so we trace the chain rather than force it into a single flow.
What do we measure? Two things: distances to objects across cosmic history (using the distance ladder from Spoiler 2) and their recession speeds. How do we get recession speeds? Through redshift — the Doppler shift we introduced in Spoiler 4. When we spread a galaxy’s light into a spectrum, its spectral lines appear shifted toward longer (redder) wavelengths compared to laboratory values. The amount of shift tells us how fast the galaxy is moving away. By combining distances with redshifts for objects at different epochs, we reconstruct how the universe has expanded over time.
What do we infer?
- The universe is 13.8 billion years old — traced back from the observed expansion rate.
- The expansion was initially slowing down (gravity pulling matter together), but about 5 billion years ago it started speeding up.
- Something is pushing the universe apart faster and faster. We call it dark energy.
What physics makes this legal? If you know how fast galaxies are receding and how far away they are, you can “run the movie backward” to find when everything was in the same place — the Big Bang. Careful measurements give 13.8 billion years. The acceleration was discovered in 1998 by measuring Type Ia supernovae at large distances. These standard candles appeared fainter than expected — meaning they were farther away than a decelerating universe would predict. This was not predicted; it contradicted the expectation that gravity should be decelerating expansion. The universe broke the model, and cosmology had to revise. That’s how science works: when observations surprise us, we update.
Key insight: we can measure the age and fate of the universe — using the same tools we used to measure the distance to a nearby star. The method scales.
If this reading felt overwhelming in places, that’s not a warning sign — it’s evidence that your brain has been introduced to a new landscape. You are not expected to carry these details yet. You are expected to recognize them when we meet them again, with tools in hand.
The Decoder Ring
The decoder ring
The spoiler reel showed you what’s possible. Now let’s make the method explicit. Astronomy works because we follow a systematic process:
Signal → Measurement → Model → Inference → Prediction → Test
Claims must survive a reasoning chain
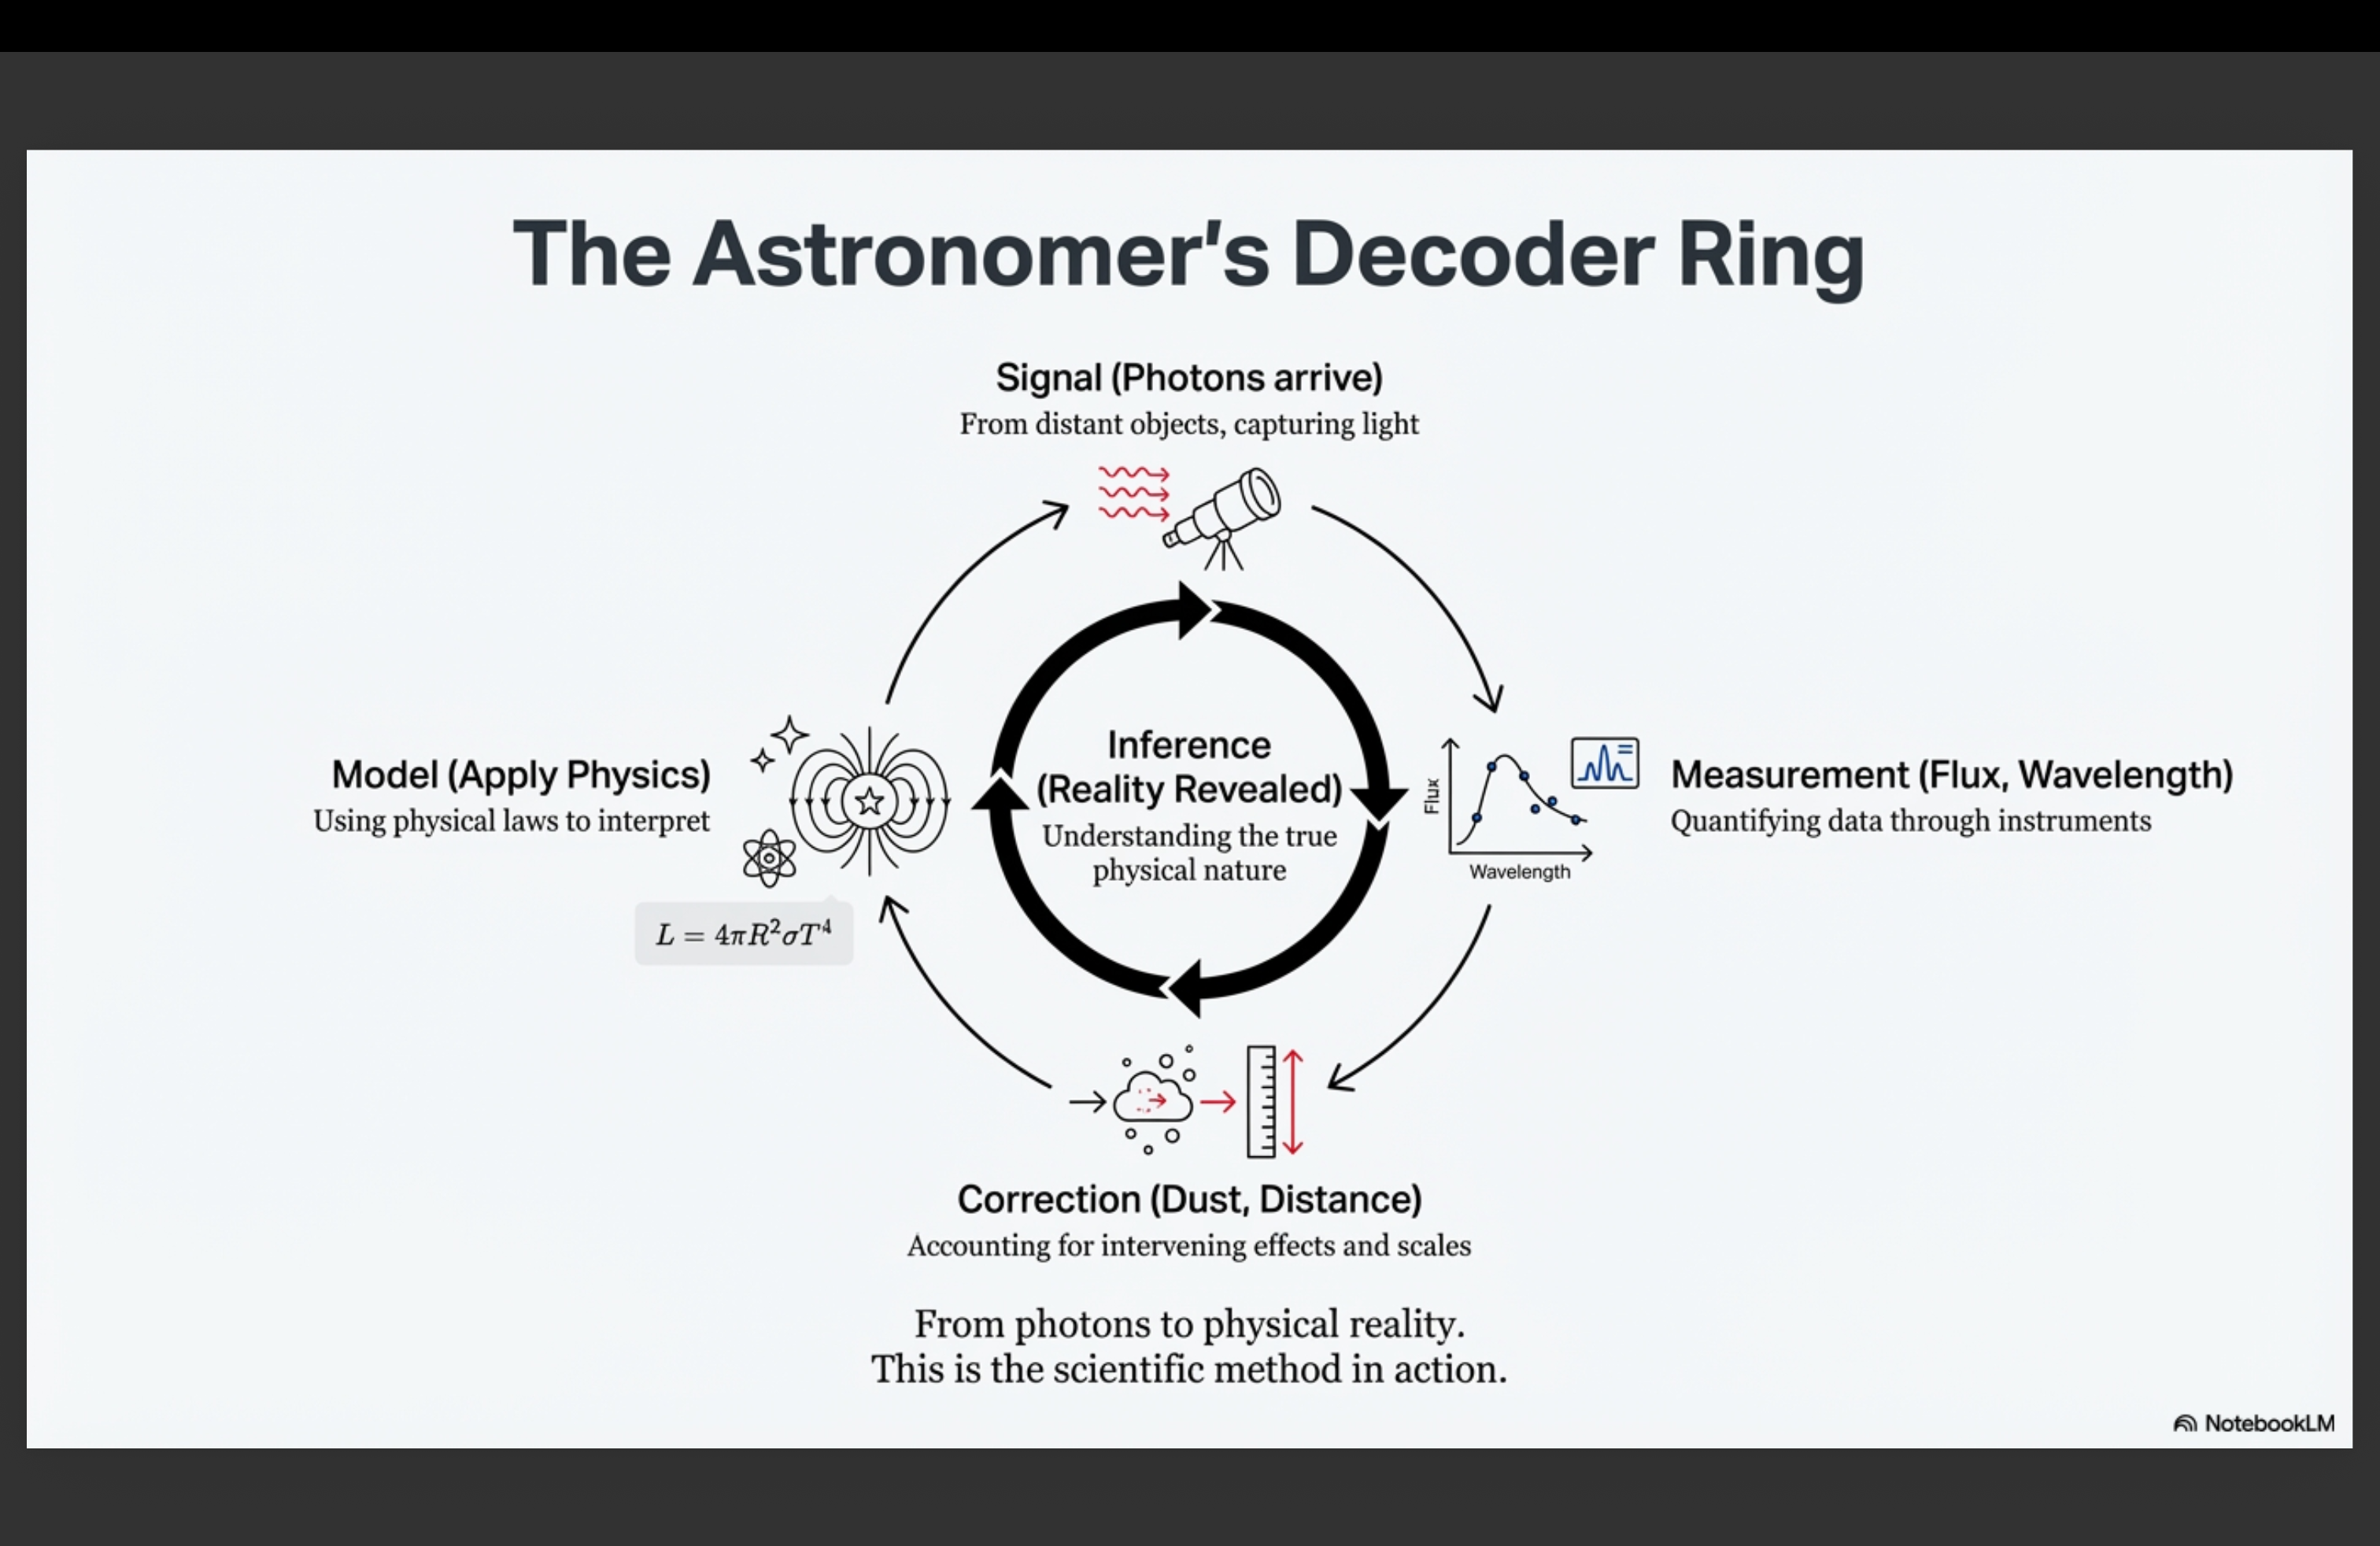
- Signal: the universe sends us electromagnetic radiation — photons.
- Measurement: we detect and quantify those signals.
- Model: we apply physical relationships that connect observables to physical quantities.
- Inference: model + measurement yields something we couldn’t directly measure.
- Prediction: the model tells us what else should be true.
- Test: we compare predictions to new observations.
When tests fail, we revise models. That cycle is how science progresses.
Model
A mathematical relationship encoding physical assumptions. Models connect what we measure to what we want to know — and, crucially, they can be tested.
A
One method answers very different questions
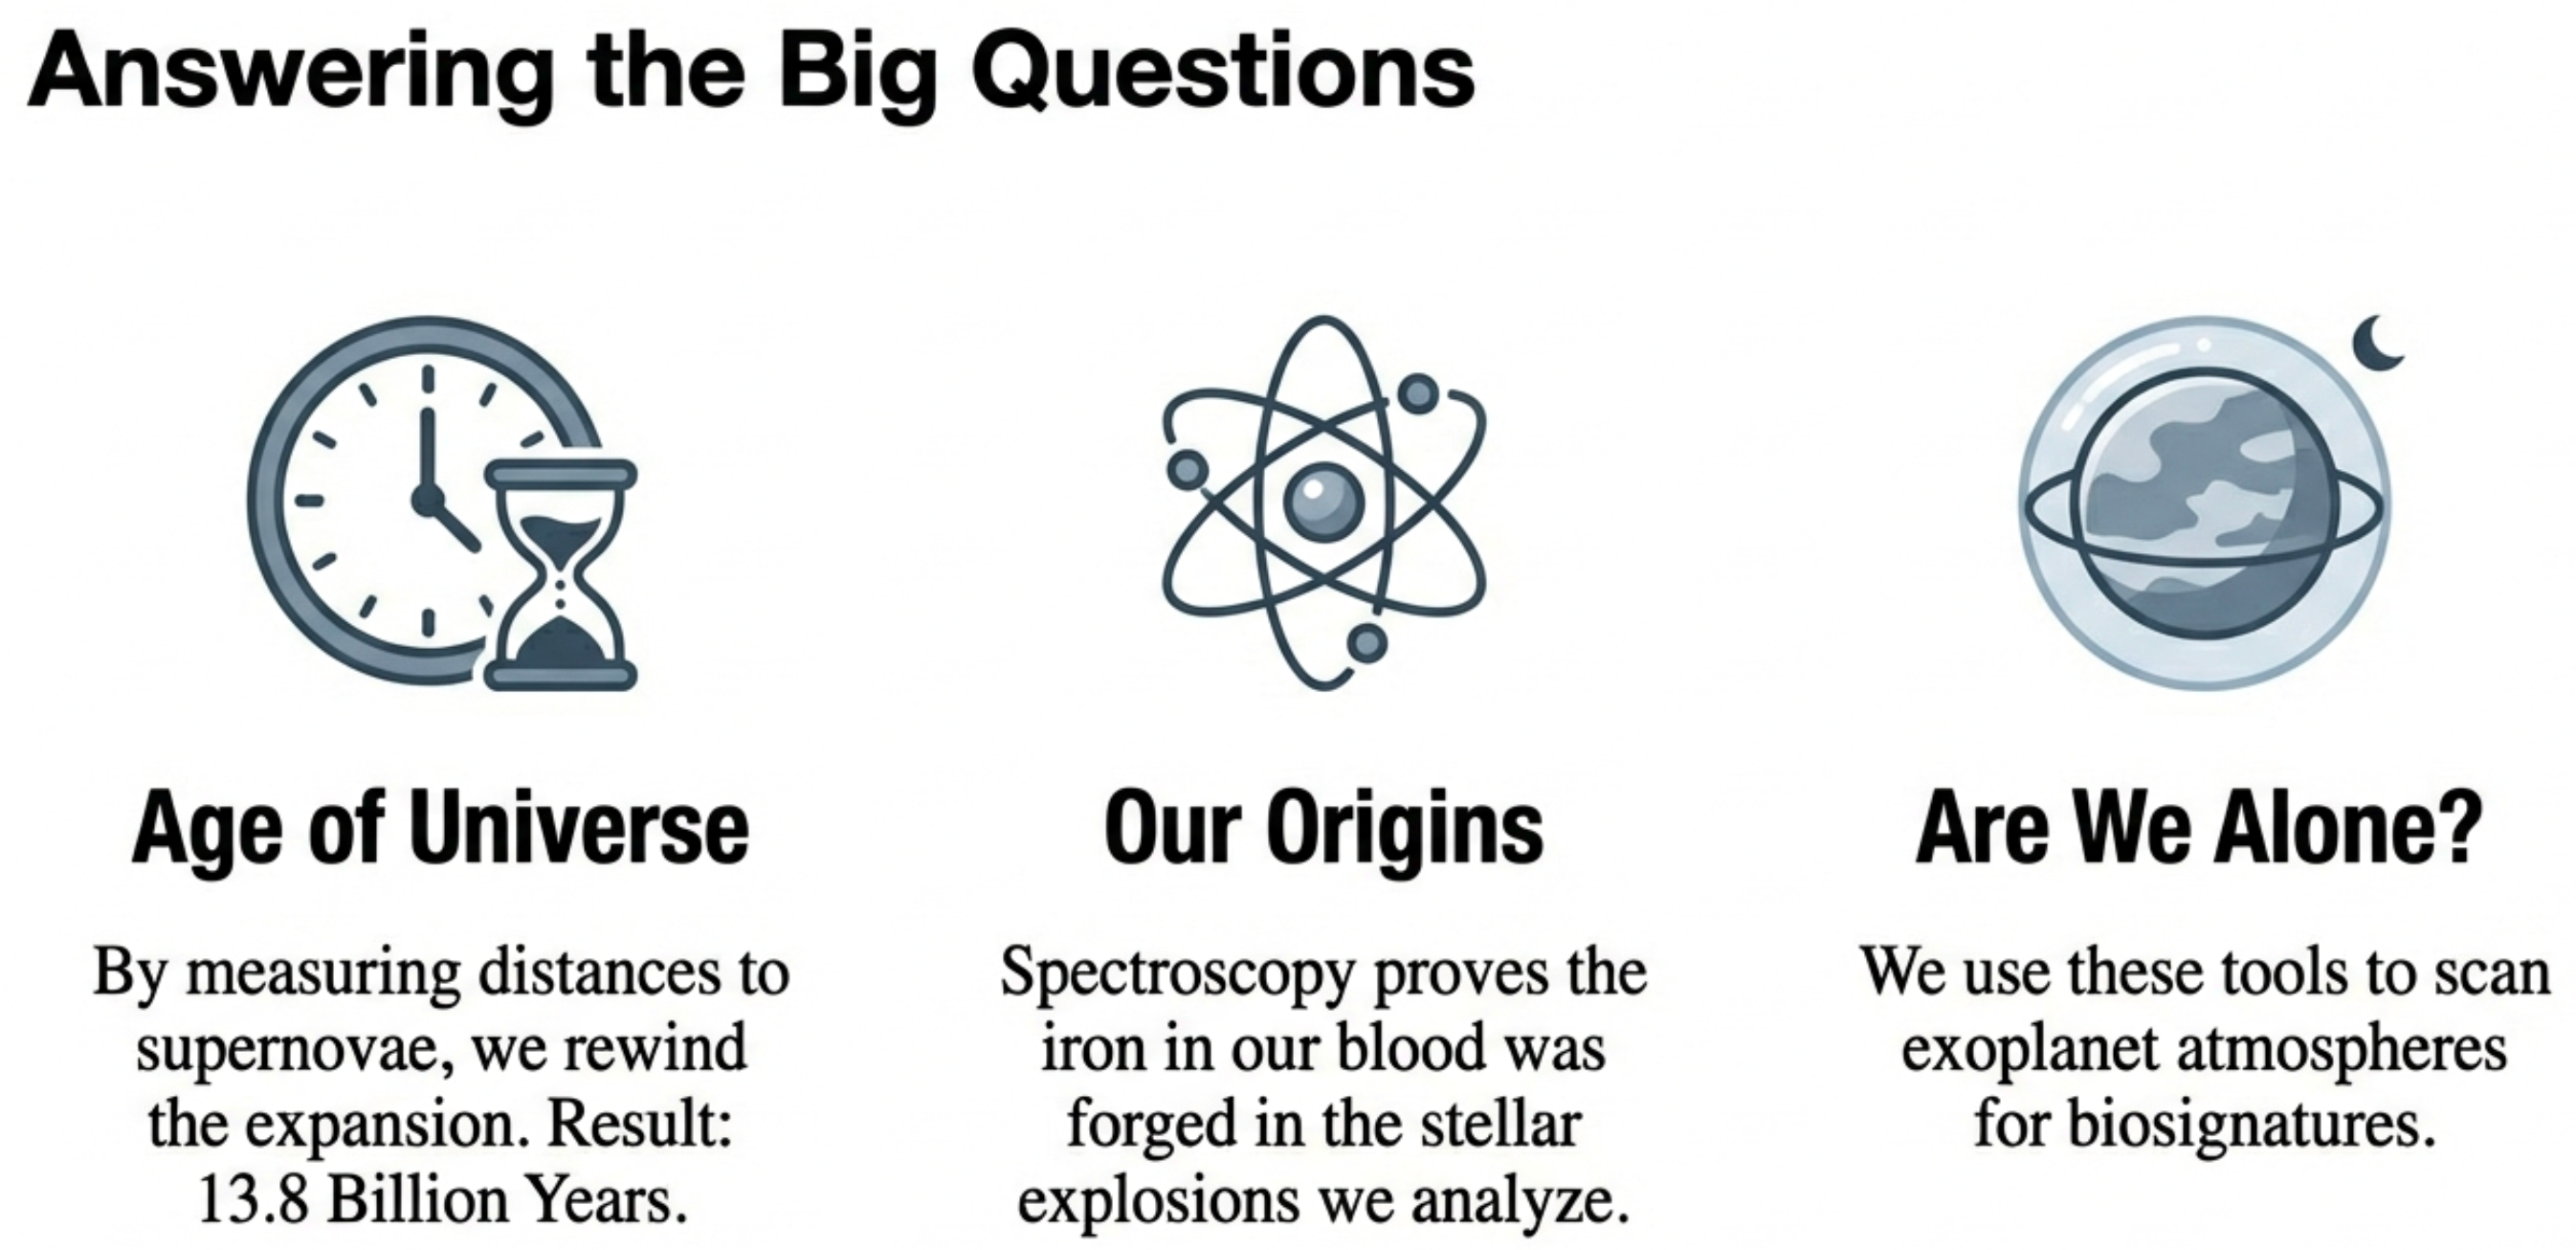
The Physical Quantities We Care About
Measure four things. Infer the universe.
Here’s the distinction that makes astronomy both hard and fascinating:
- The Four Observables (Section 1.1): what we can directly measure — brightness, position, wavelength, timing.
- The Six Core Quantities (below): what we actually want to know about stars and galaxies.
Notice that none of the quantities below appear in the observables list. Every single one must be inferred by combining measurements with physical models. That gap — between what we measure and what we want to know — is where physics lives.
| Quantity | Symbol | What It Measures | How We Infer It | CGS Units |
|---|---|---|---|---|
| Distance | How far away | Parallax (position), standard candles (brightness) | cm (or pc, ly) | |
| Time | Duration or epoch | (context-dependent) | s (or yr) | |
| Speed | Rate of motion | Doppler shift (wavelength) | cm/s | |
| Mass | Amount of matter | Orbital motion (position + timing) | g (or ) | |
| Energy / Luminosity | , | Total energy; energy output per time | Flux (brightness) + distance | erg; erg/s (or ) |
| Temperature | Thermal energy scale | Spectrum/color (wavelength) | K |
Every value in the “How We Infer It” column connects back to one or more of the four observables via a physical model. That’s the course thesis in table form. These quantities are connected by physical laws: mass determines gravity, temperature determines spectrum, distance relates flux to luminosity. You’ll build the network of relationships throughout the semester.
DigressionEnergy vs. luminosity
You know energy from physics — the capacity to do work, measured in erg (or joules). In astronomy we often use luminosity: energy emitted per unit time (power), measured in erg/s or . The two are related: total energy output = luminosity × time. Solar units (, , ) are often more intuitive than CGS — “this star is 10 ” means “10 times the Sun’s mass.”
Light: The Cosmic Messenger
Light is the messenger
Everything we know about the universe beyond Earth comes from light — electromagnetic radiation traveling across the cosmos carrying information. Understanding light is foundational.
The Speed of Light: A Universal Constant
Light travels at a constant speed in vacuum:
This is fast — about 300,000 km/s, fast enough to circle Earth 7.5 times in one second. But it’s also finite, and that finiteness has profound consequences. To build intuition:
- Light crosses your room almost instantaneously.
- Light from the Sun takes 8.3 minutes to reach Earth.
- Light from the nearest star takes 4.2 years.
- Light from the Andromeda Galaxy takes 2.5 million years.
The light-year — the distance light travels in one year — is roughly cm, or about 63,000 AU.
DigressionWhy "c"?
From celeritas, Latin for “swiftness.” It’s one of the most fundamental constants in physics — the speed limit of the universe.
Light as a Wave: The Fundamental Relationship
Light is an electromagnetic wave — oscillating electric and magnetic fields propagating through space. Like any wave, it has a wavelength (): the distance between successive crests. The relationship between wavelength, frequency, and speed is:
Wavelength and frequency trade places
Here is the (constant) speed of light, is the wavelength (cm), and is the frequency (Hz = cycles per second). Since is fixed, wavelength and frequency are inversely related: longer wavelength means lower frequency, and vice versa.
DigressionHertz (Hz)
The unit of frequency; 1 Hz = 1 cycle per second. Named after Heinrich Hertz, who first demonstrated electromagnetic waves. Units check: ✓.
Problem
Red light has wavelength nm cm. What’s its frequency?
StepCalculate
That’s 430 trillion oscillations per second!
Dimensional check
✓
StepLimiting case
Blue light ( nm) has shorter wavelength. Since , shorter means higher — roughly higher. Check: Hz, indeed about 1.7× larger ✓.
Result
Red light oscillates at Hz. Pattern: shorter wavelength → higher frequency. This inverse relationship appears throughout the course.
Problem
Radio waves have wavelengths of ~1 meter. Visible light has wavelengths of ~500 nm ( cm). Which has higher frequency, and by roughly how much?
Visible light has much higher frequency. Since , shorter wavelength means higher frequency. Visible light’s wavelength is about times smaller than radio, so its frequency is about times higher.
DigressionDoppler preview
If a light source moves toward you, the wavelengths you receive are compressed (shifted blue); if it moves away, they are stretched (shifted red). The speed of light stays constant — what changes is the wavelength. We’ll see this Doppler effect power major discoveries: dark matter, the expanding universe, and exoplanets.
Photon Energy: Where Quantum Mechanics Enters
Photon
A discrete packet (quantum) of light. Light is not only a wave; it also arrives in these indivisible bundles, each carrying a specific energy set by its frequency.
Light isn’t just a wave — it also comes in discrete packets called
Wavelength sets energy per photon
Here erg·s is Planck’s constant. Because , the two forms and are equivalent — a photon’s energy is fixed by its wavelength alone.
Problem
How much more energy does an X-ray photon ( nm cm) carry compared to a radio photon ( m cm)?
StepCalculate the ratio
Since , the ratio of energies is:
Dimensional check
The cancels, and cm/cm is dimensionless — the answer is a pure ratio ✓.
StepLimiting case
What if we used gamma rays instead ( cm)? The ratio becomes — a trillion times more energy than radio. The pattern holds: shorter → higher .
Result
X-ray photons carry a billion times more energy than radio photons. This explains why X-ray emission requires million-degree plasma, while radio emission can come from cold gas. Energy determines what processes can produce the light.
The Electromagnetic Spectrum: A Temperature Ladder
Combining and , we understand the EM spectrum as a map of physical conditions:
| Wavelength Range | λ (approximate) | Photon Energy | Typical Source |
|---|---|---|---|
| Radio | cm – m | ~ erg | Cold gas, magnetic fields |
| Infrared | 1 μm – 1 mm | ~ erg | Warm dust, cool stars |
| Visible | 400 – 700 nm | ~ erg | Stellar surfaces |
| Ultraviolet | 10 – 400 nm | ~ erg | Hot stars |
| X-ray | 0.01 – 10 nm | ~ erg | Hot plasma ( K) |
| Gamma-ray | <0.01 nm | > erg | Extreme events |
This hierarchy emerges from physics: hotter objects emit higher-energy (shorter-wavelength) photons. Different wavelengths probe different temperature regimes — cold things glow at long wavelengths, hot things at short wavelengths. Physics, not convention.
The spectrum is a ladder of physical conditions
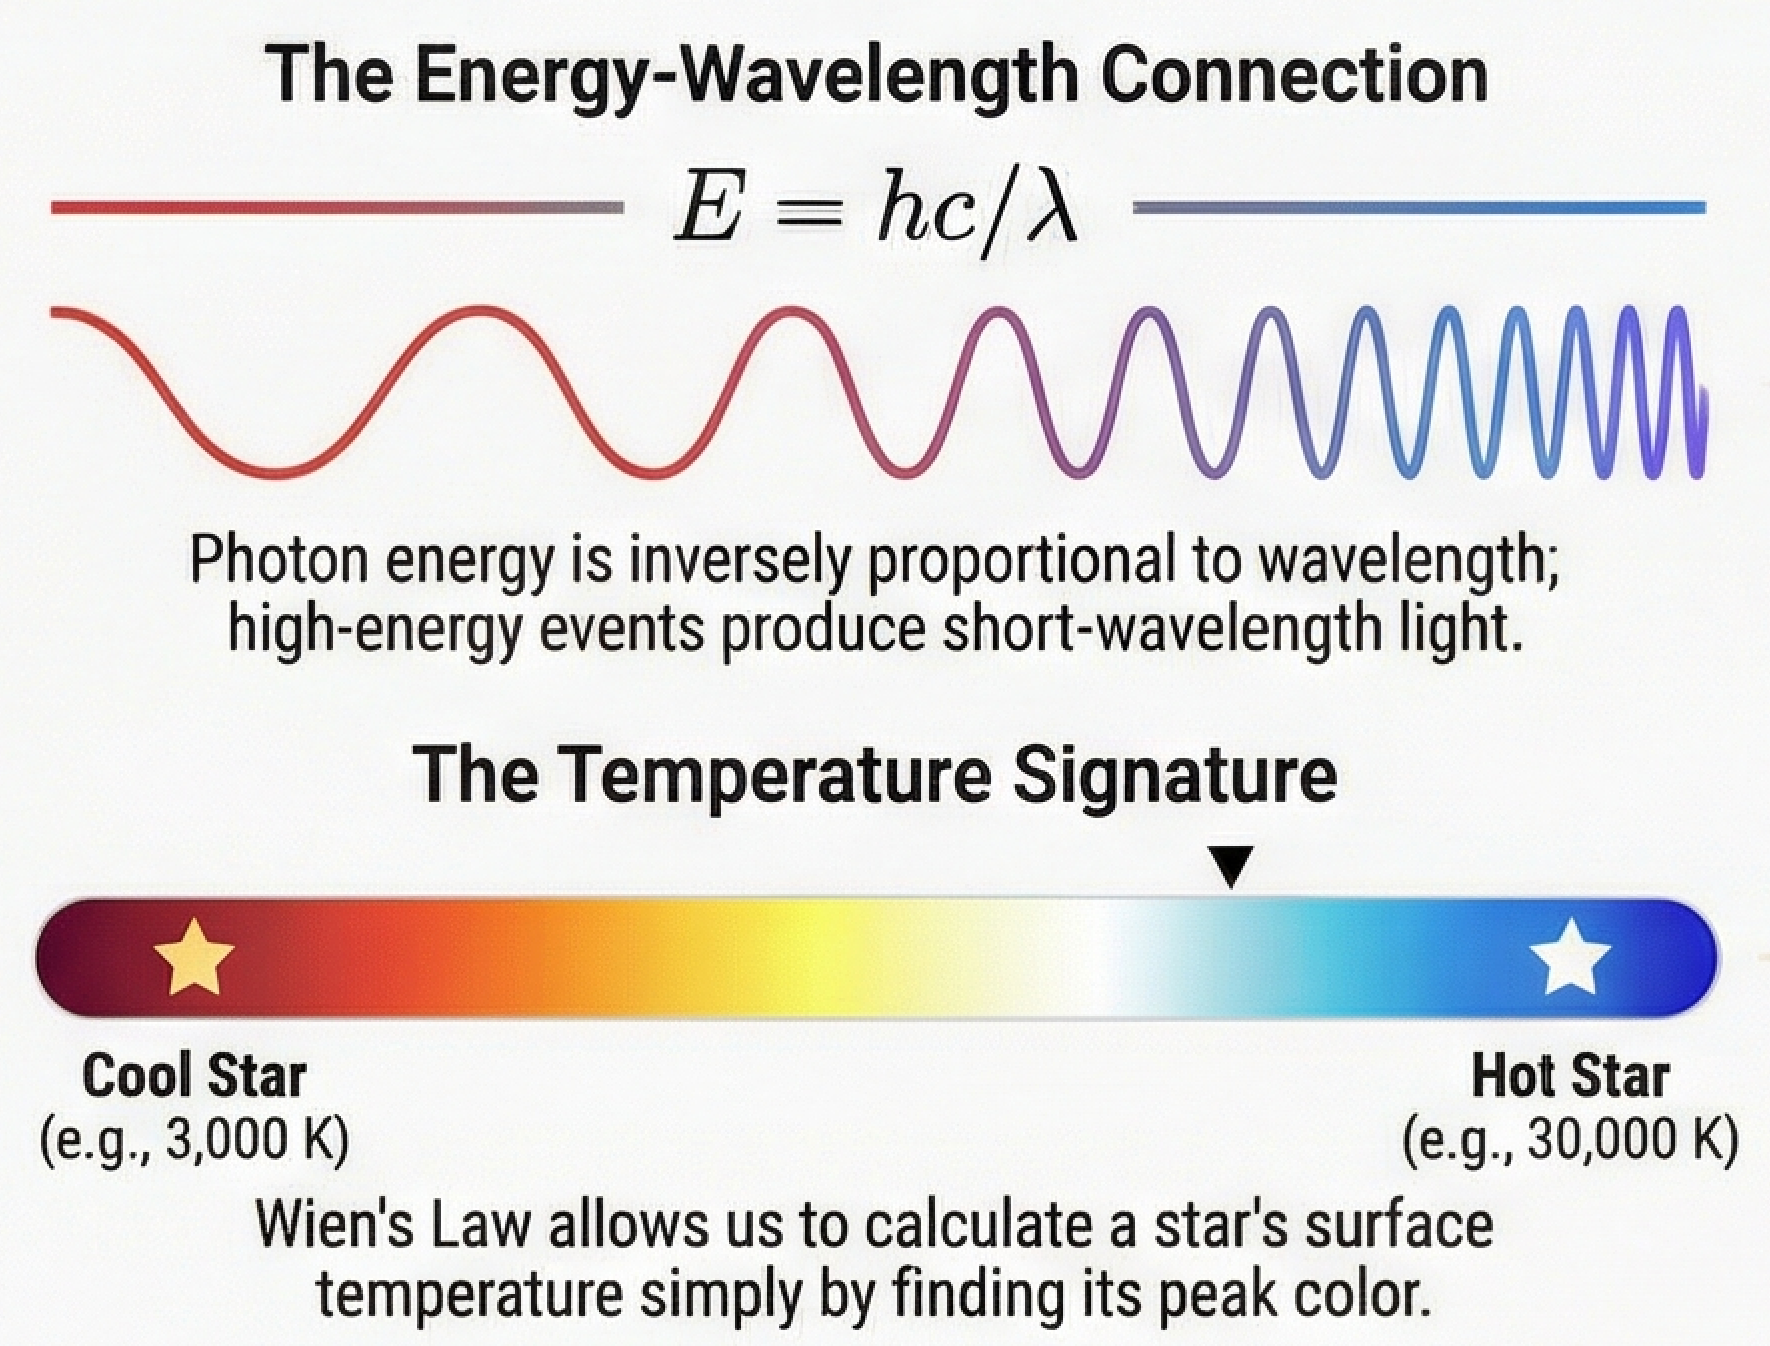
Why do X-ray telescopes see different objects than optical telescopes?
X-ray photons have much higher energy than optical photons, requiring much hotter sources. X-ray telescopes detect million-degree plasma — gas in galaxy clusters, matter falling into black holes, stellar coronae — while optical telescopes see stellar surfaces at thousands of degrees. Different wavelengths = different temperature regimes = different objects visible.
Looking Back in Time
Distance is a time dial
Light’s finite speed has a profound consequence for astronomy that deserves its own section.
When you look at the Sun, you see it as it was 8.3 minutes ago. The “Sun right now” is inaccessible — you can only see the “Sun 8.3 minutes ago.” For the Sun, this seems like a curiosity. For distant objects, it becomes transformative.
Lookback time
The time light takes to travel from an object to us. Because that’s also when the light was emitted, we see distant objects as they were in the past.
The universe is a time machine
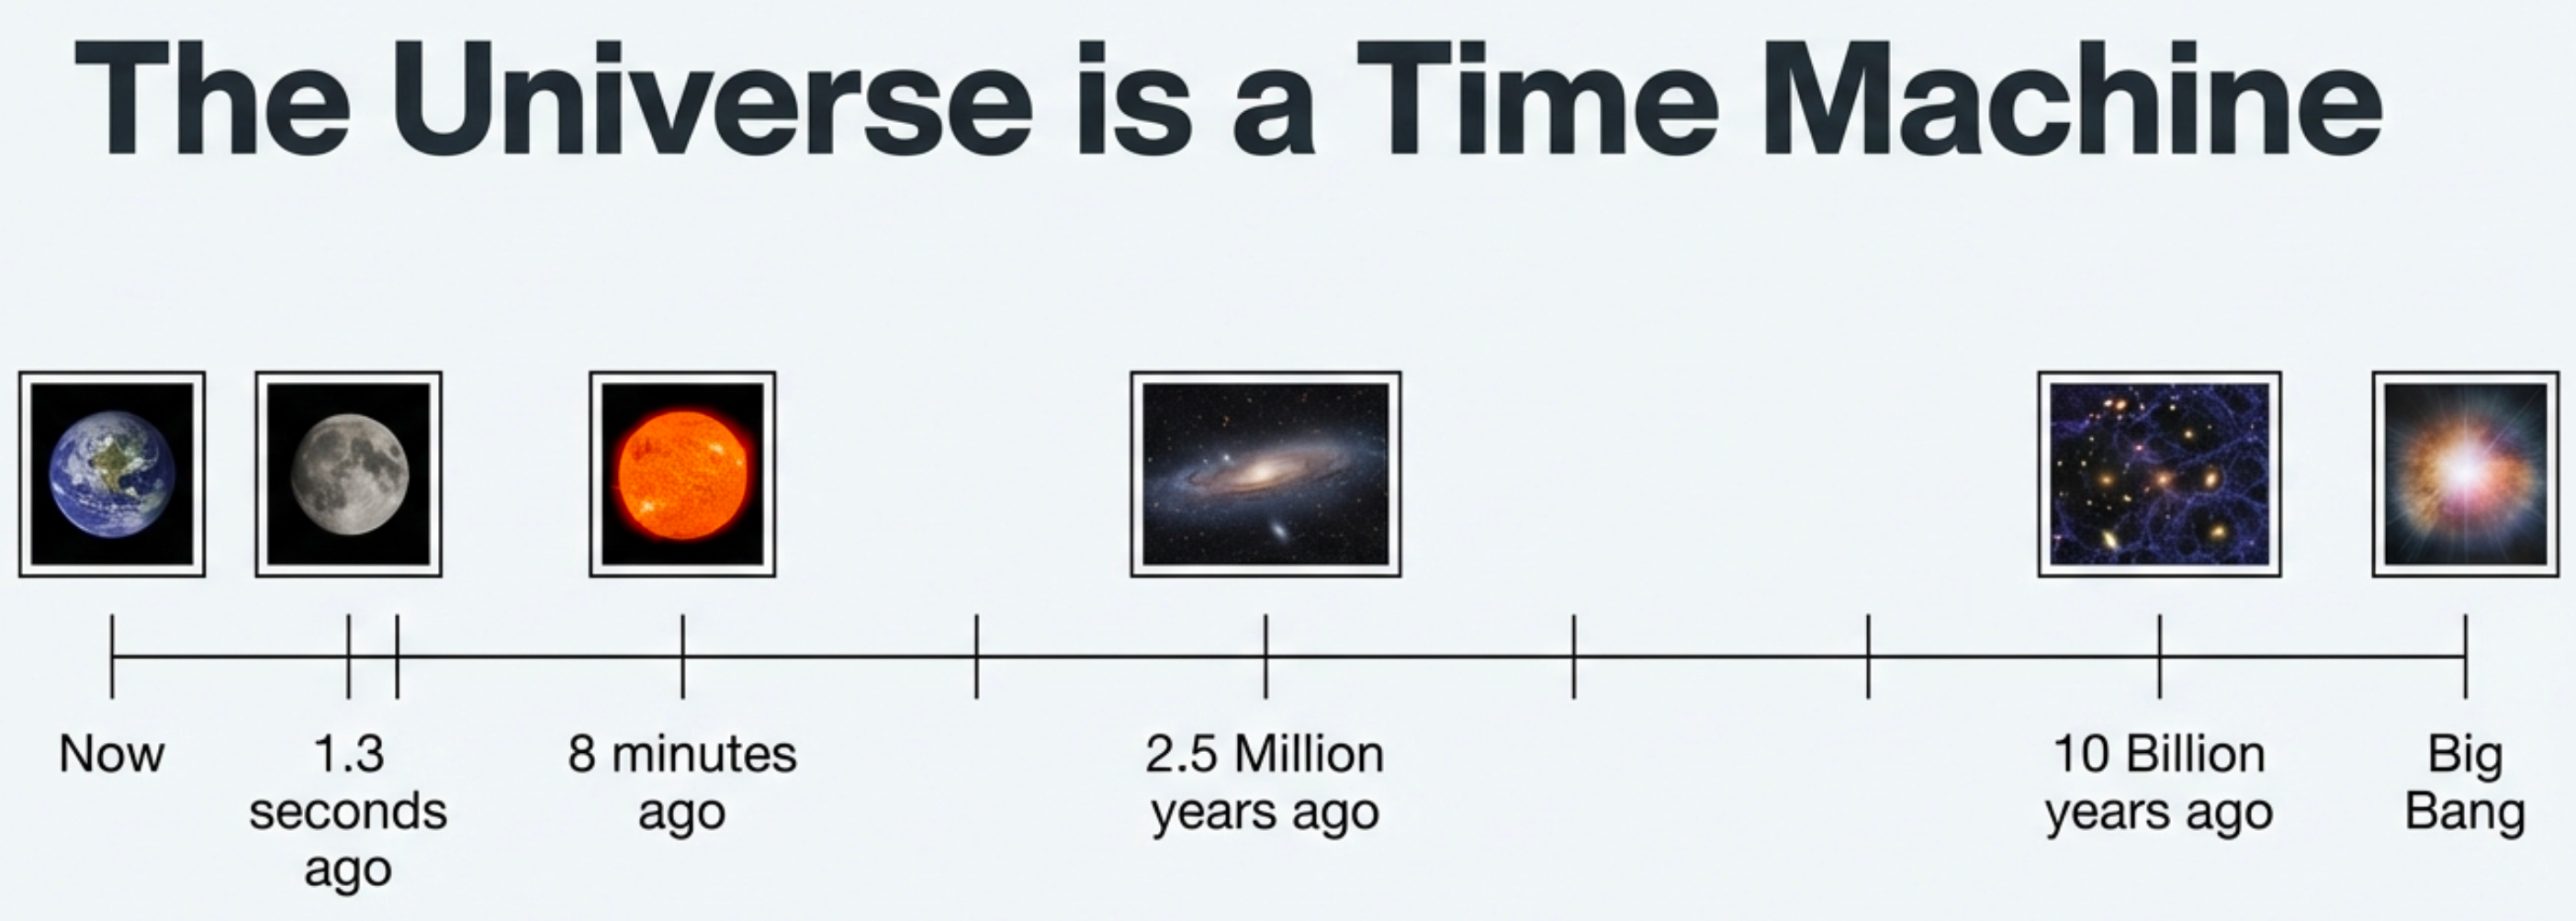
This
The cosmic microwave background (CMB) is the extreme case: light from 380,000 years after the Big Bang, traveling for 13.8 billion years. When we observe the CMB, we see the universe as a baby — the most ancient light in existence.
From Spoilers to Understanding
From spoilers to scientific judgment
Let’s recap what we’ve covered.
The thesis: pretty pictures → measurements → models → inferences.
The method: we measure four types of things (brightness, position, wavelength, timing); everything else is inferred using physical models; physics provides relationships, and math makes them precise and testable.
The key physics of light:
- Speed: cm/s (finite, constant)
- Wave relation: (longer λ ↔ lower ν)
- Photon energy: (shorter λ → higher E)
- The appearance of signals quantum mechanics
- Different wavelengths probe different temperatures/processes
- Finite light speed → lookback time
Where We’re Headed
Next class: the Math Boot Camp — units, scaling, order-of-magnitude estimation, and the ratio method. Not hazing; tools that make precise reasoning possible.
Coming soon: our first real inference problem — how do we measure distance to objects we can’t reach?
Today you saw the spoilers. Now we build the tools to understand them — one inference at a time.
Self-Assessment Checklist
Section 1.1 — The Course Thesis
- I can explain to a friend why “astronomy is about looking at pretty pictures” misses the point.
- I can identify which of the four observables (brightness, position, wavelength, timing) would help answer a specific question.
- I can explain why “astronomers measured a star’s temperature” is technically imprecise — and what they actually measured.
- I can predict relative distances from relative brightness using the inverse-square relationship.
Section 1.2 — The Spoiler Reel
- I can apply the three-question framework (measure / infer / physics) to a new astronomical image.
- I recognize that the spoilers are conclusions I’ll learn to justify, not just memorize.
- I can explain why different wavelengths reveal different physical components.
Section 1.3 — The Decoder Ring
- I can trace how a measurement becomes an inference using the pipeline: Signal → Measurement → Model → Inference → Prediction → Test.
- I can explain why physics provides the relationships and math makes assumptions explicit.
Section 1.4 — Light as Messenger
- I can use to predict how frequency changes when wavelength changes.
- I can use to explain why X-ray telescopes see hotter objects than optical telescopes.
- I understand that the constant signals we’re in quantum territory (details to come).
Section 1.5 — Lookback Time
- I can explain why observing a galaxy 10 million light-years away means seeing it 10 million years in the past.
- I can use distance as a “time dial” to reason about cosmic history.
Quick Practice
Use these as a fast warm-up. Keep answers short but explicit about what was measured vs what was inferred.
Quick check
An Astro 101 student says “astronomy is about looking at pretty space pictures.” How would you correct them using the framework from this lecture?
We measure photons (brightness, position, wavelength, timing) and infer physical properties using models; pictures are data, not answers.
Quick check
A news headline reads “Scientists measure the mass of a distant black hole.” What did they actually measure, and what model connected that measurement to mass?
They measured motion (e.g., Doppler shifts or orbital periods). The gravity/orbit model converts motion into mass.
Quick check
If you double a photon’s wavelength, what happens to its energy? Explain using .
Energy is inversely proportional to wavelength, so doubling halves .
Check the time dial
The Andromeda Galaxy is 2.5 million light-years away. When you observe it tonight, when did the light leave?
- Now
- 2.5 million years ago
- 2.5 million years in the future
Show answer
Answer: 2.5 million years ago
Multiple choice
The Andromeda Galaxy is 2.5 million light-years away. When you observe it tonight, you are seeing it as it was…
You see Andromeda as it was 2.5 million years ago; lookback time equals distance in light-years.
Now we earn the spoilers
The 9 graded practice problems for this lecture live in the companion practice set.
Glossary
- Doppler effect
The shift in observed wavelength caused by relative motion between source and observer: compression (blueshift) for approach, stretching (redshift) for recession. It lets us measure the speeds of stars, galaxies, and the expanding universe using light alone.
- Flux
Light energy per unit time per unit area reaching your detector — the precise, measurable version of “brightness.”
- Inference
Drawing conclusions about quantities we cannot directly access (like a star’s temperature) from quantities we can measure (like its color). Inference requires a model — a physical relationship connecting observable to unobservable.
- Lookback time
The time light takes to travel from an object to us. Because that’s also when the light was emitted, we see distant objects as they were in the past.
- Luminosity
The total light energy a source emits per unit time — an intrinsic property of the object, independent of how far away it is.
- Model
A mathematical relationship encoding physical assumptions. Models connect what we measure to what we want to know — and, crucially, they can be tested.
- Photon
A discrete packet (quantum) of light. Light is not only a wave; it also arrives in these indivisible bundles, each carrying a specific energy set by its frequency.
- Spectroscopy
The technique of spreading light into its component wavelengths and measuring brightness as a function of wavelength. It turns a single brightness measurement into thousands of data points encoding temperature, composition, and motion.
- Standard candle
An object whose intrinsic luminosity can be determined independently (from pulsation period, spectral type, or explosion physics), allowing distance to be calculated from observed brightness.