Spoiler Alerts
Section 4 of 9
Wavelength Changes What We See
Wavelength changes what we see
Spoiler 5: The Electromagnetic Spectrum — A Map of Physical Processes
Wavelength maps physical conditions
Photons across the entire EM spectrum
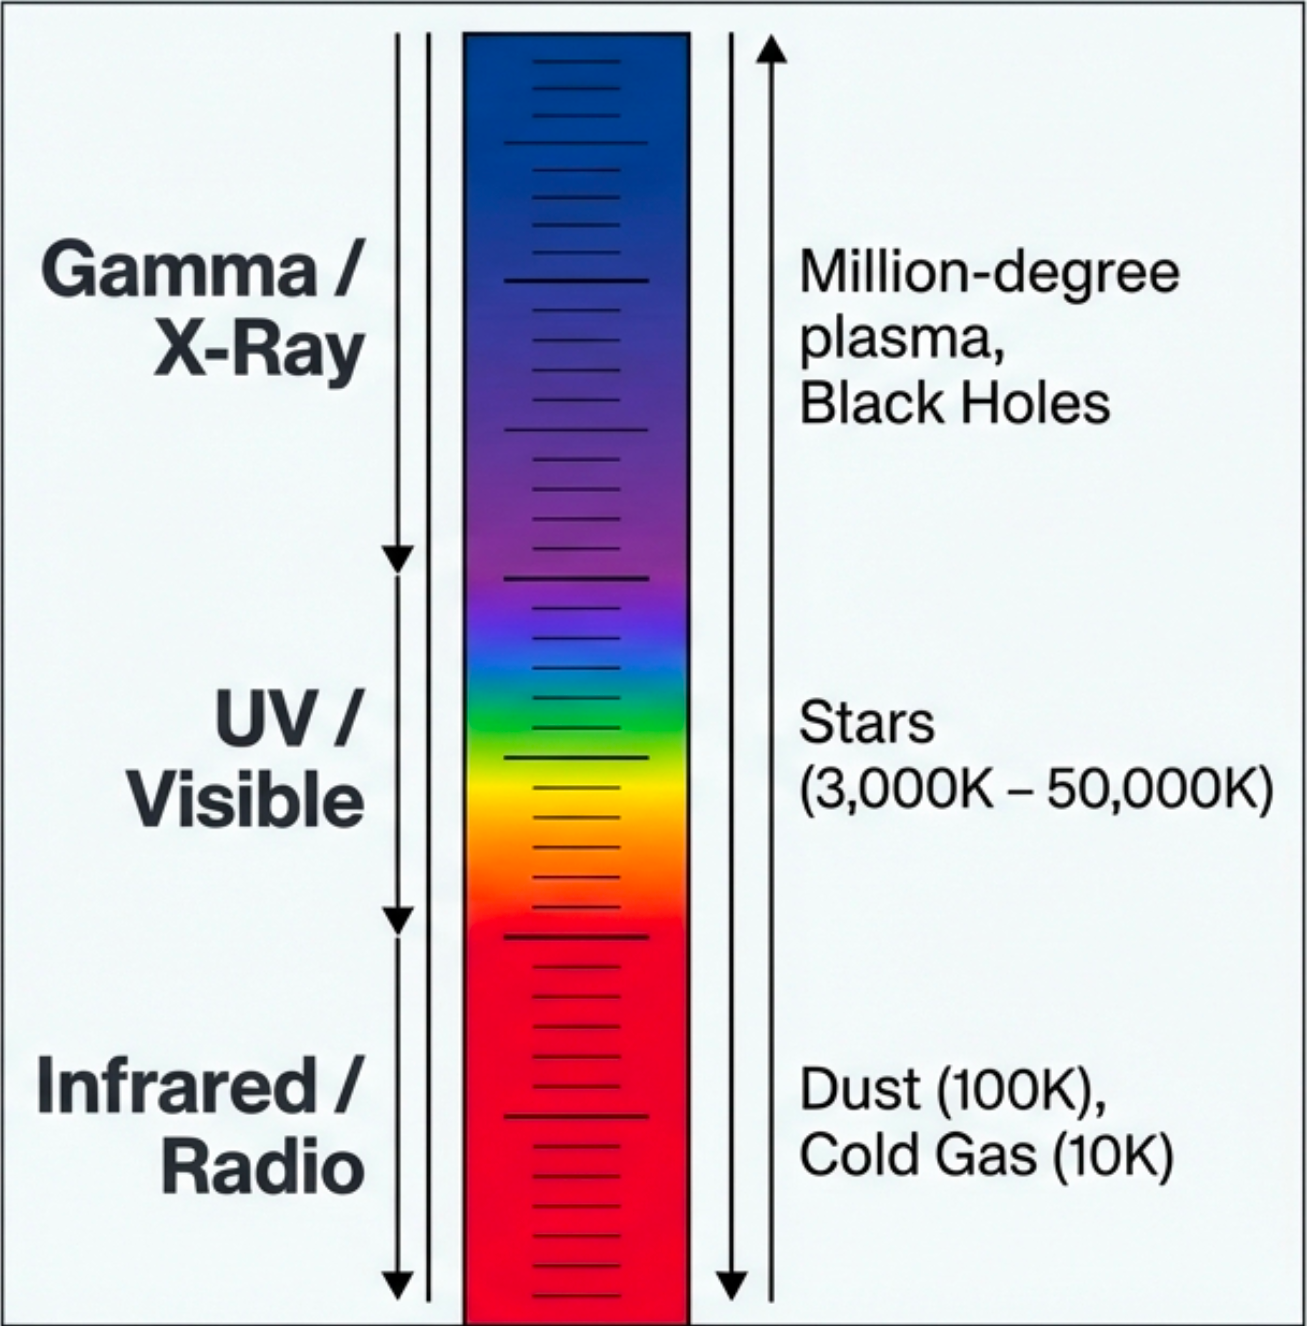
Photons across the entire electromagnetic spectrum — from radio waves with wavelengths of meters to gamma rays smaller than atoms.
Photon energy is tied to wavelength
Photon energy is tied to wavelength. Hotter or more violent processes produce higher-energy (shorter-wavelength) photons.
Different wavelengths reveal different conditions
Different physical conditions produce different wavelengths. Cold gas glows at radio wavelengths; stellar surfaces shine in visible light; million-degree plasma emits X-rays.
Bottom line: wavelength tells you about temperature and violence. The EM spectrum is organized by physics, not human convention — it’s a map of physical conditions. Longer wavelength means lower energy (colder, gentler); shorter wavelength means higher energy (hotter, more violent).
Spoiler 6: Same Galaxy, Different Physics
Same galaxy, different physics
Optical starlight vs 21-cm radio emission
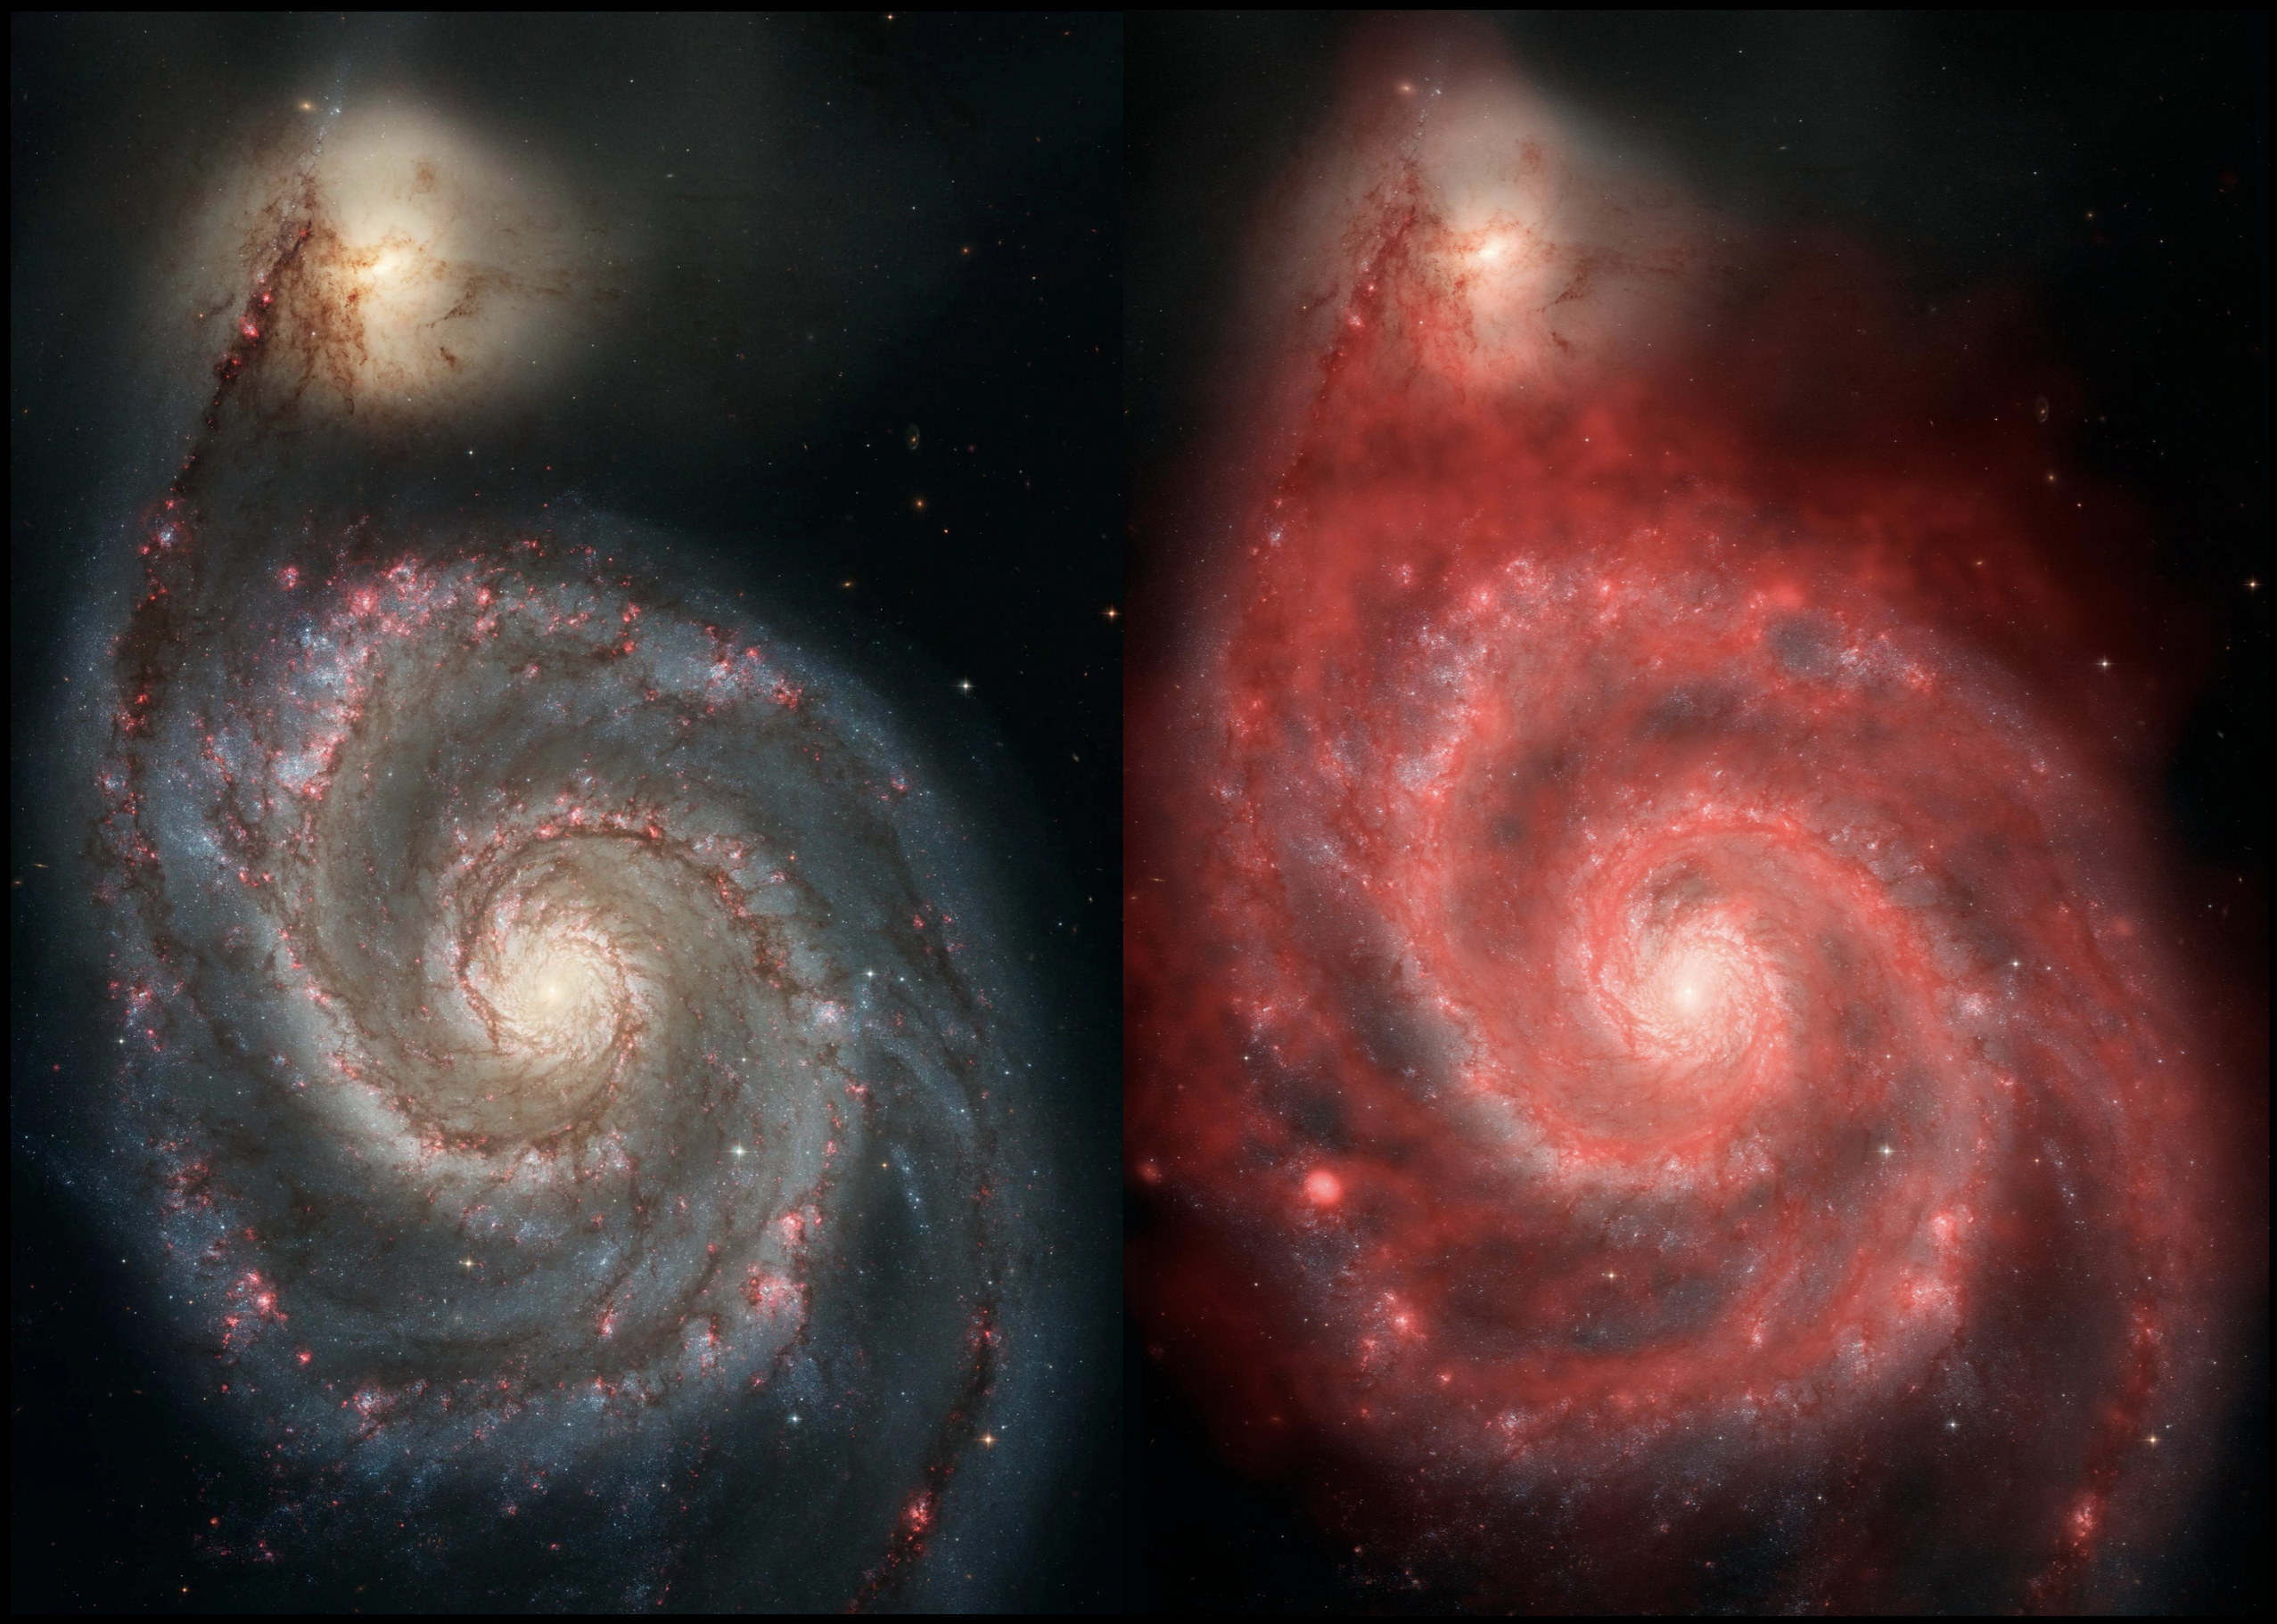
Optical starlight (~500 nm) from one observation; radio emission at 21 cm from another.
Different emitters at different wavelengths
Stars emit thermal radiation from their hot surfaces (peaking in the visible). Neutral hydrogen emits at exactly 21 cm due to a quantum mechanical transition in cold atomic gas.
Stars vs cold gas — and they don't overlap
The optical image shows where the stars are. The radio image shows where cold hydrogen gas lives. They don’t perfectly overlap.
Key insight: same object + different wavelength = different physical component revealed.
Transition: optical shows stars, but what if dust is blocking our view of where stars are born?
Spoiler 7: Pillars of Creation — Infrared Beats Dust
Infrared reveals what dust hides
Dark pillars in optical, hidden stars in infrared
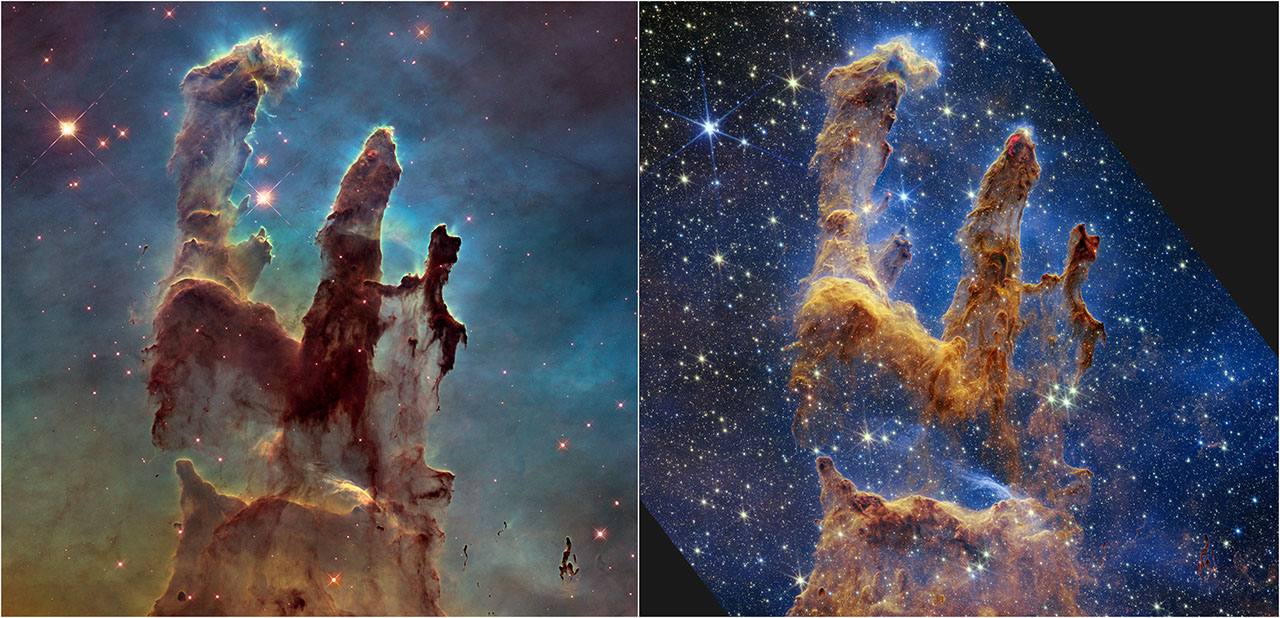
Optical: dark pillars. Infrared: thousands of previously hidden stars.
Dust blocks short wavelengths, not long ones
Dust grains (~0.01–1 μm) efficiently absorb and scatter light with comparable wavelengths. Longer wavelengths (infrared) pass through.
The 'empty' dark regions are full of newborn stars
Dust strongly blocks visible light but is transparent at infrared wavelengths. The “empty” dark regions are teeming with newborn stars.
DigressionJWST's superpower
At ~2 μm wavelength, dust absorbs roughly 10× less light than at visible wavelengths. JWST peers through cosmic dust that blocks Hubble.
Key insight: what you can’t see at one wavelength might be brilliantly visible at another.
Transition: we’ve seen how one alternative wavelength reveals hidden physics. What about combining many wavelengths?
Spoiler 8: The Crab Nebula — Many Windows, One Truth
Many windows, one physical system
The Crab observed from radio through X-ray
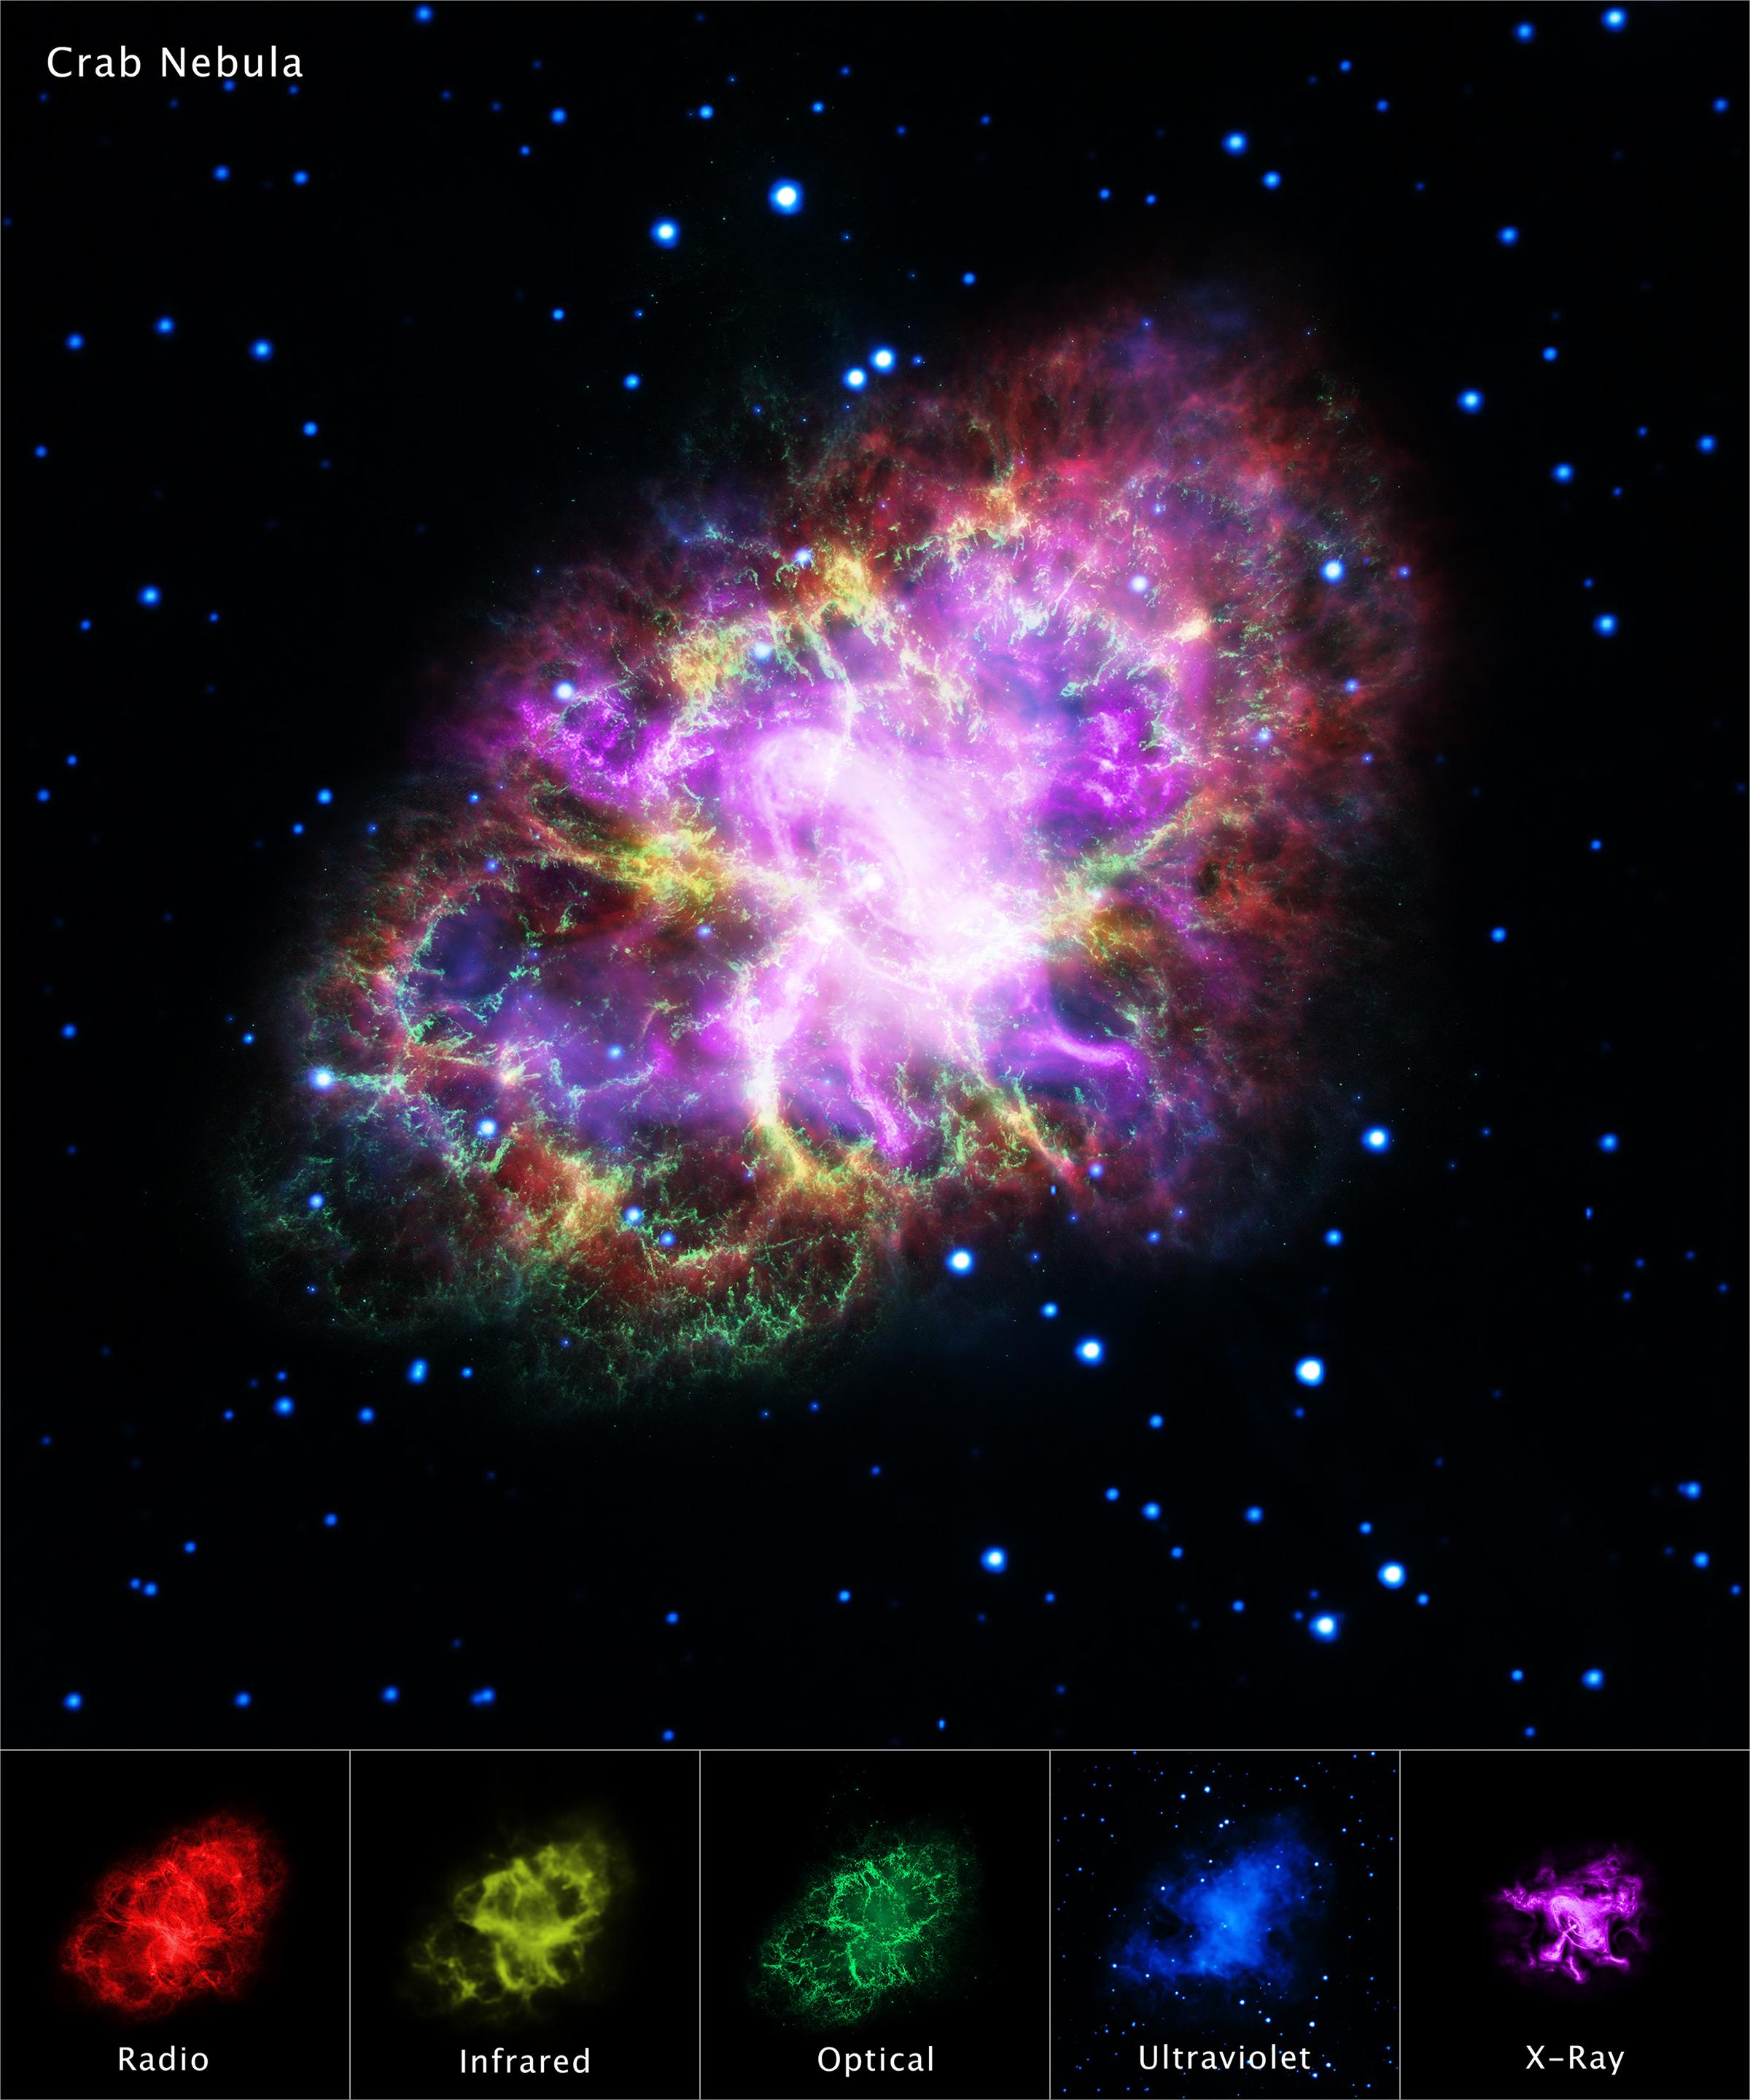
The Crab observed from radio through X-ray. At each wavelength, it looks completely different.
Different emission mechanisms dominate at different wavelengths
Different physical processes — synchrotron radiation, thermal dust emission, ionized-gas line emission, hot-plasma X-rays — dominate in different wavelength bands.
Multiple physical components coexist
Radio: magnetic fields + relativistic electrons. Infrared: warm dust. Optical: ionized gas from the 1054 CE supernova. X-ray: hot plasma and the central pulsar’s jets.
Key insight: many windows, one truth. Only by combining wavelengths can we understand complex astrophysical systems.