Surface Flux & Colors of Stars
Section 7 of 8
Color and the HR Diagram
Part 7: Color and the HR Diagram (Preview)
Hot stars are blue (short peak, high ); cool stars are red (long peak, low ); the relationship is quantitative, . Astronomers use color indices — brightness in two filter bands — to estimate temperature without finding the exact peak.
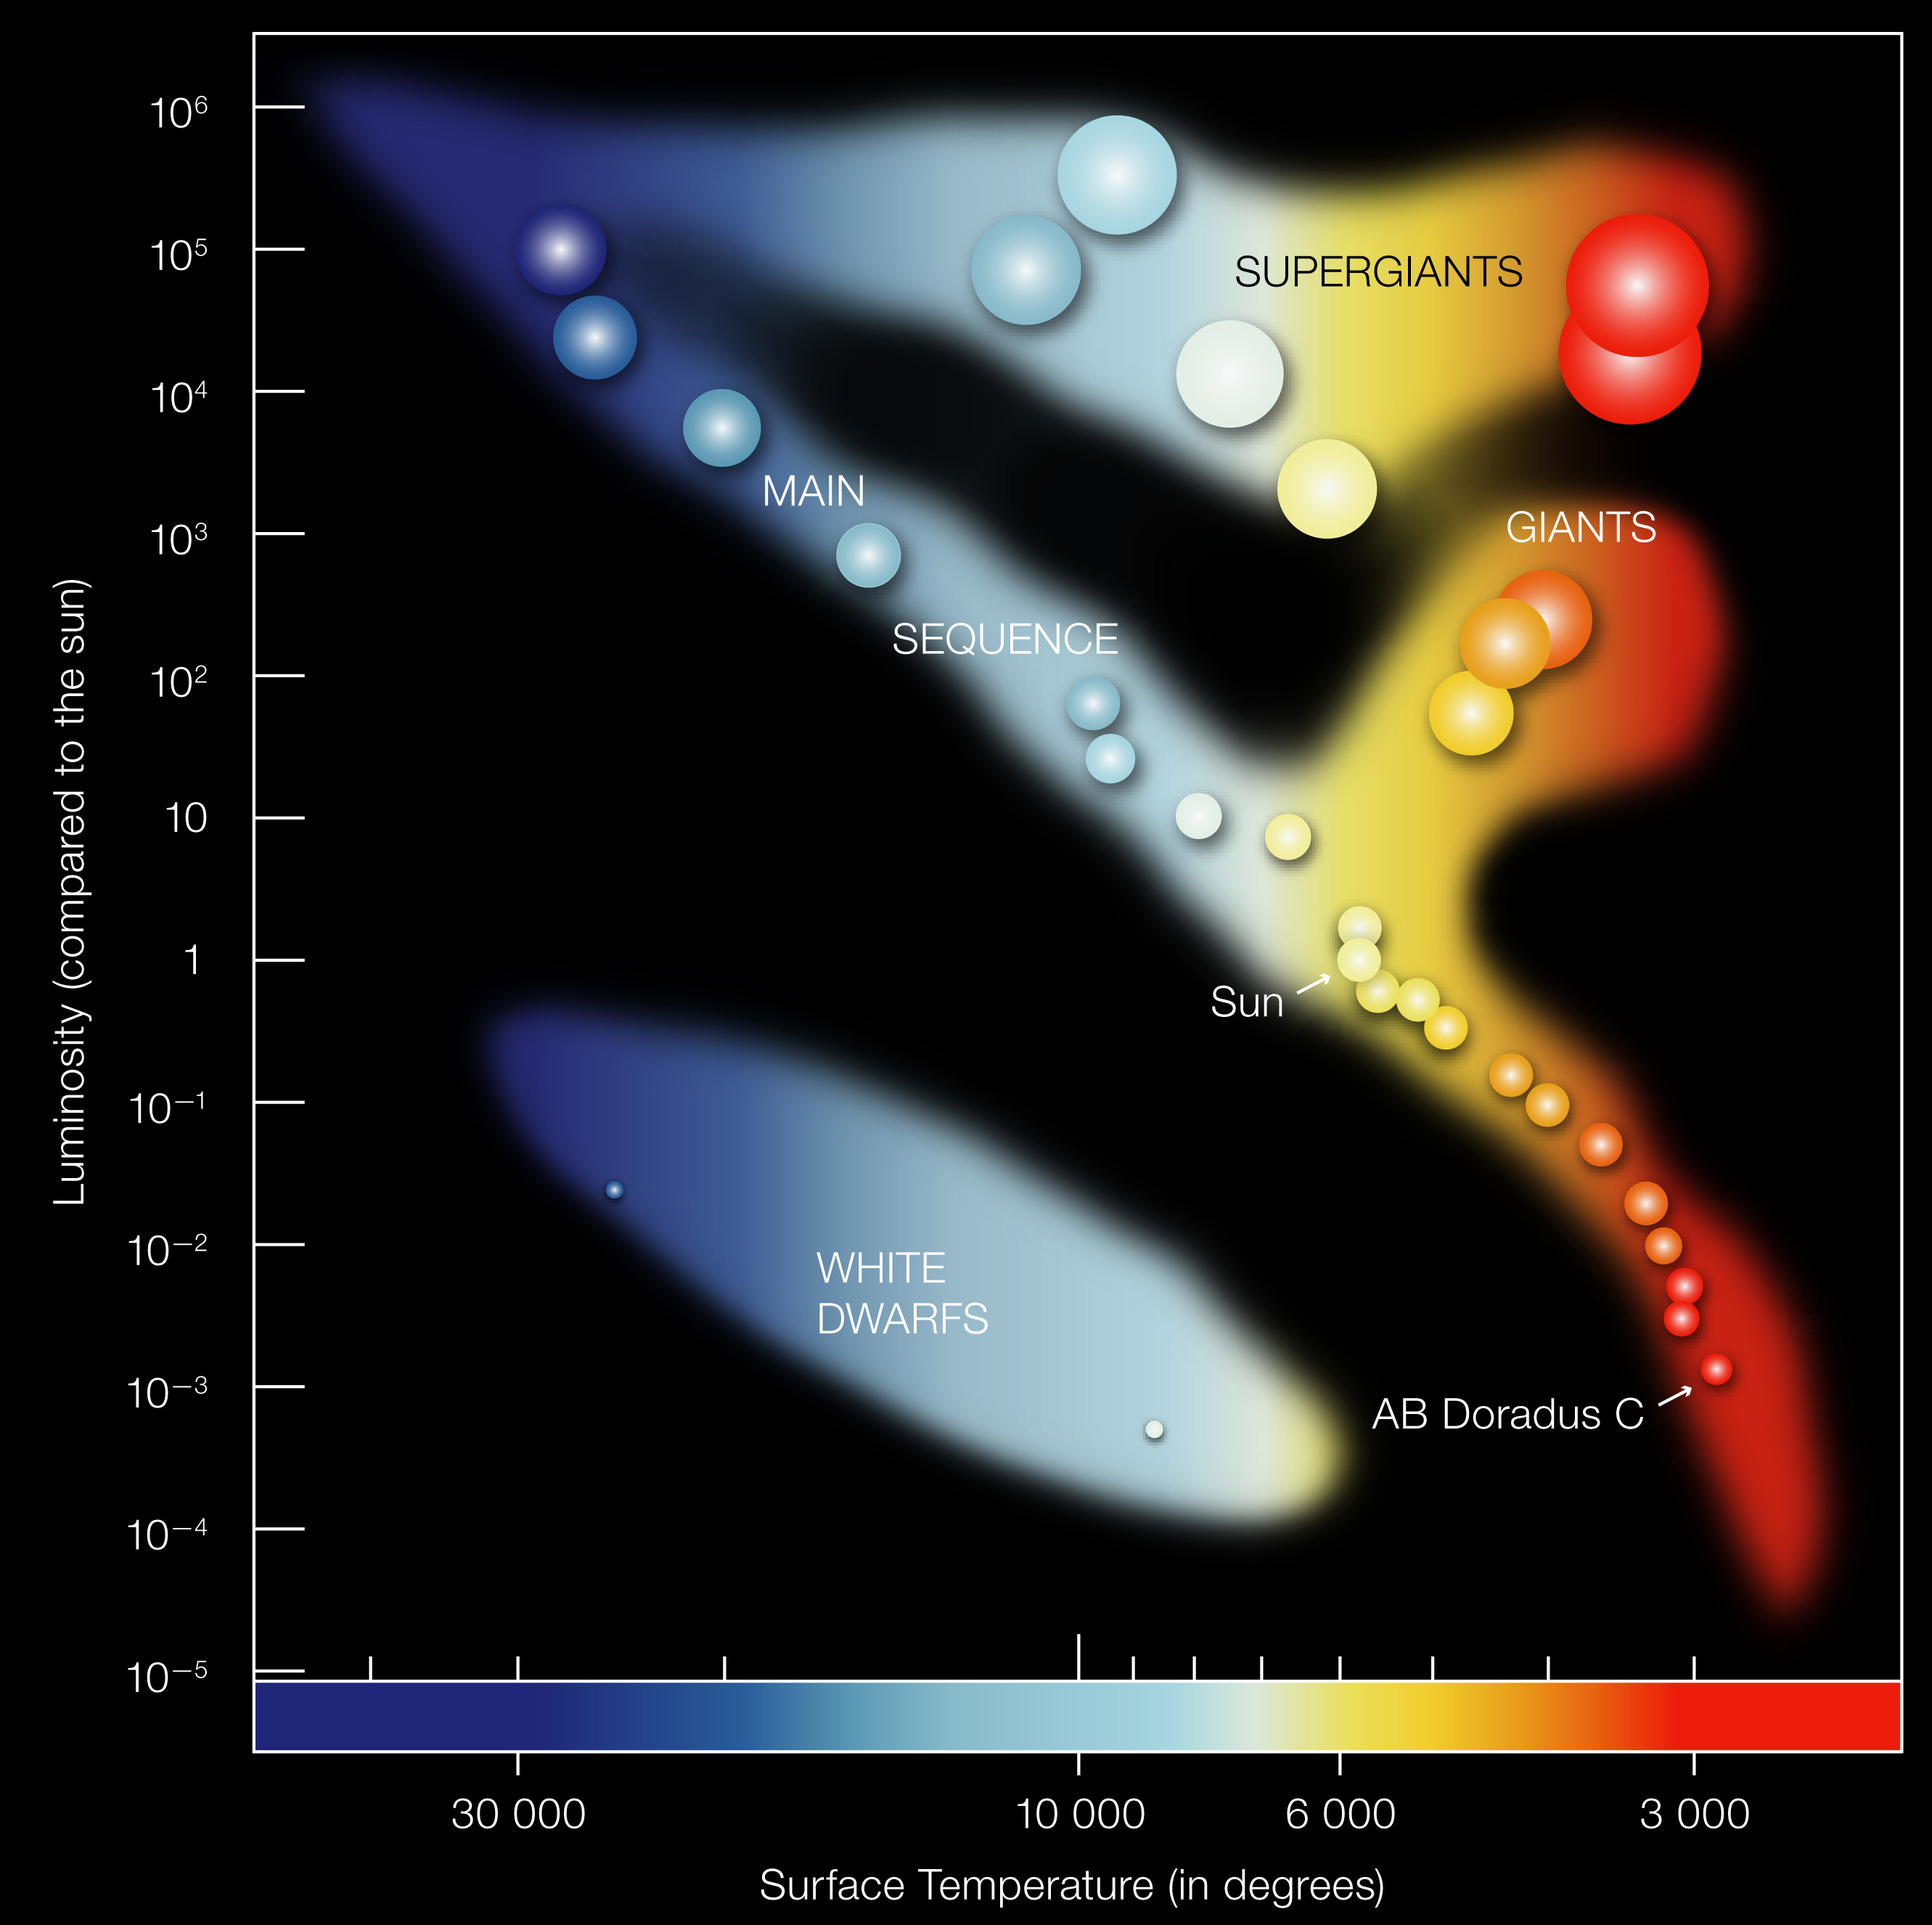
The Hertzsprung-Russell diagram plots luminosity (vertical) against temperature/color (horizontal). The key insight: the horizontal axis is a temperature axis — hot blue stars on the left, cool red stars on the right (historical convention). Since , lines of constant radius are diagonal curves across it; every star lies on some constant- curve.
When you plot many stars, they cluster: the main sequence (hydrogen-burning, where the Sun lives), the giant branch (cool but luminous — large radii compensate), and the white dwarf sequence (hot but dim — tiny radii, ~). Lines of constant radius separate these populations.