Surface Flux & Colors of Stars
Complete lesson
Two Stars with the Same Luminosity
After completing this reading, you should be able to:
Part 1: Two Stars with the Same Luminosity
Look toward Orion. Blue-white Rigel at the foot and red Betelgeuse at the shoulder both radiate roughly 100,000 times the Sun’s power — yet one is a compact blue supergiant and the other an enormous red supergiant whose surface would reach past Mars’s orbit. How can two stars with the same luminosity differ so much in size?
A hot (blue) object radiates energy much more efficiently per square centimeter than a cool (red) object. So to produce the same total luminosity, a hot star can be smaller; a cool star must be huge. This lecture quantifies that intuition with the Stefan-Boltzmann law — the second major step in stellar inference.
Surface Flux and Received Flux
Part 2: Surface Flux vs. Received Flux
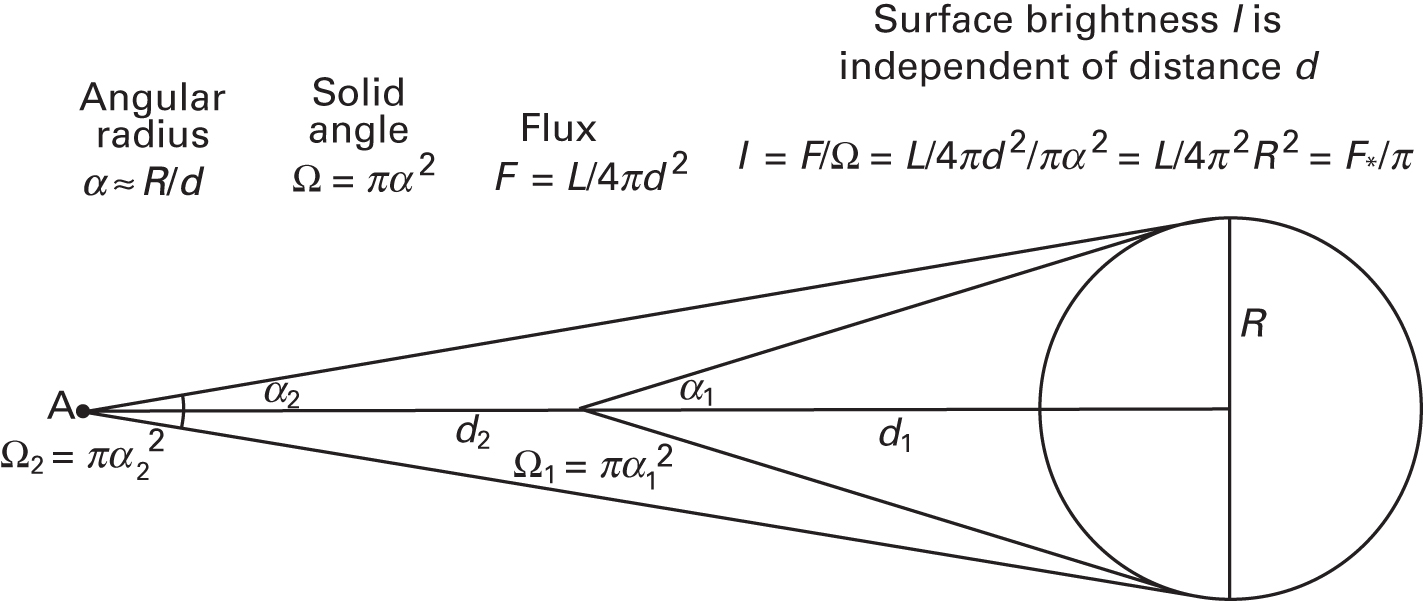
In Lecture 1 you learned that the flux received at Earth falls off with distance.
This
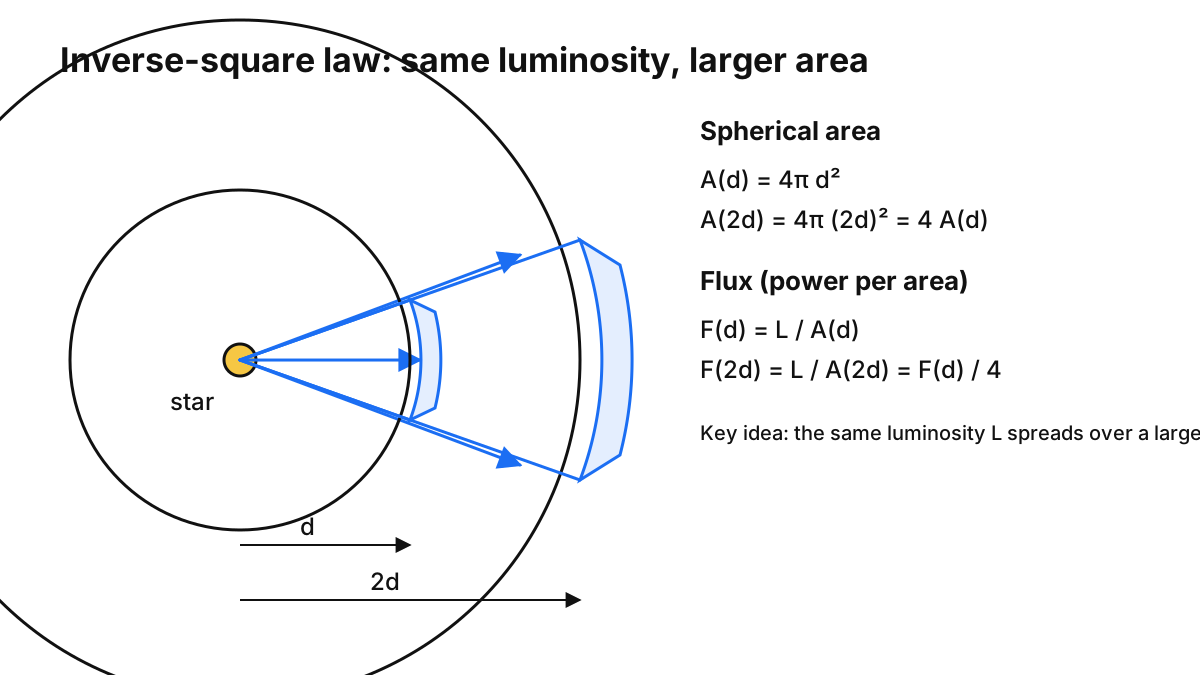
Received flux
The power per unit area an observer measures at distance , . Distance-dependent — it falls as .
Now consider a different quantity: if you could stand on the star’s surface, how much power per unit area would you receive? That is the surface flux:
Surface flux
The power per unit area radiated at the star’s own surface, . It depends only on the star’s intrinsic properties ( and ), not on the observer’s distance.
| Quantity | Equation | What it measures | Depends on |
|---|---|---|---|
| Received flux () | Brightness we measure | Star’s distance; our location | |
| Surface flux () | Radiation at the star’s surface | Star’s luminosity and radius only |
NoteSymbol legend — quantities used in this reading
| Symbol | Name | Units (CGS) |
|---|---|---|
| Luminosity | erg/s | |
| Received flux | erg s⁻¹ cm⁻² | |
| Surface flux | erg s⁻¹ cm⁻² | |
| Stellar radius | cm (or ) | |
| Distance | cm (or pc) | |
| Effective temperature | K | |
| Stefan-Boltzmann constant | erg cm⁻² s⁻¹ K⁻⁴ | |
| Wien’s constant | cm·K | |
| Peak wavelength | nm or cm |
Quick check
- If a star’s distance doubles, received flux does what?
- If a star’s radius doubles (with fixed), surface flux does what?
- Two stars have the same received flux at Earth. Must they have the same surface flux?
- Quarters — received flux scales as .
- Quarters — surface flux scales as .
- No. Received flux depends on both luminosity and distance; two stars with equal received flux can have different distances and luminosities, hence different surface fluxes.
The Stefan–Boltzmann Law
Part 3: The Stefan-Boltzmann Law
Every blackbody is described by its temperature. The Stefan-Boltzmann law quantifies how much power a blackbody radiates per unit area: , where . Multiplying by the spherical surface area gives the total luminosity.
Temperature dominates and size amplifies. A blackbody’s output rises steeply with temperature — as per unit area — while total luminosity scales with surface area as . So a hot star can be small and still bright, and a cool star must be huge to match it.
stefan-boltzmann(L)blackbody-stellar-spectra(T)The
Stefan-Boltzmann law
— the total power a spherical blackbody of radius and effective temperature radiates. Surface flux times area .
Scaling with the Sun
Part 4: Dimensionless Form — Scaling with the Sun
Working in absolute CGS units means juggling and — easy places for arithmetic errors. Express everything relative to the Sun instead: dividing the Stefan-Boltzmann law for any star by the same law for the Sun cancels the constants.
The and appear in both numerator and denominator, so they cancel — leaving only ratios. Solving for radius in solar units:
No physical constants appear — just ratios. Solar values: , .
Problem
From : (1) radius doubles, fixed → does what? (2) doubles, radius fixed → ? (3) both double → ?
- — luminosity scales as .
- — luminosity scales as (steep!).
- — ; the factor dominates.
Wien's Law: Color to Temperature
Part 5: Wien’s Law — Color to Temperature
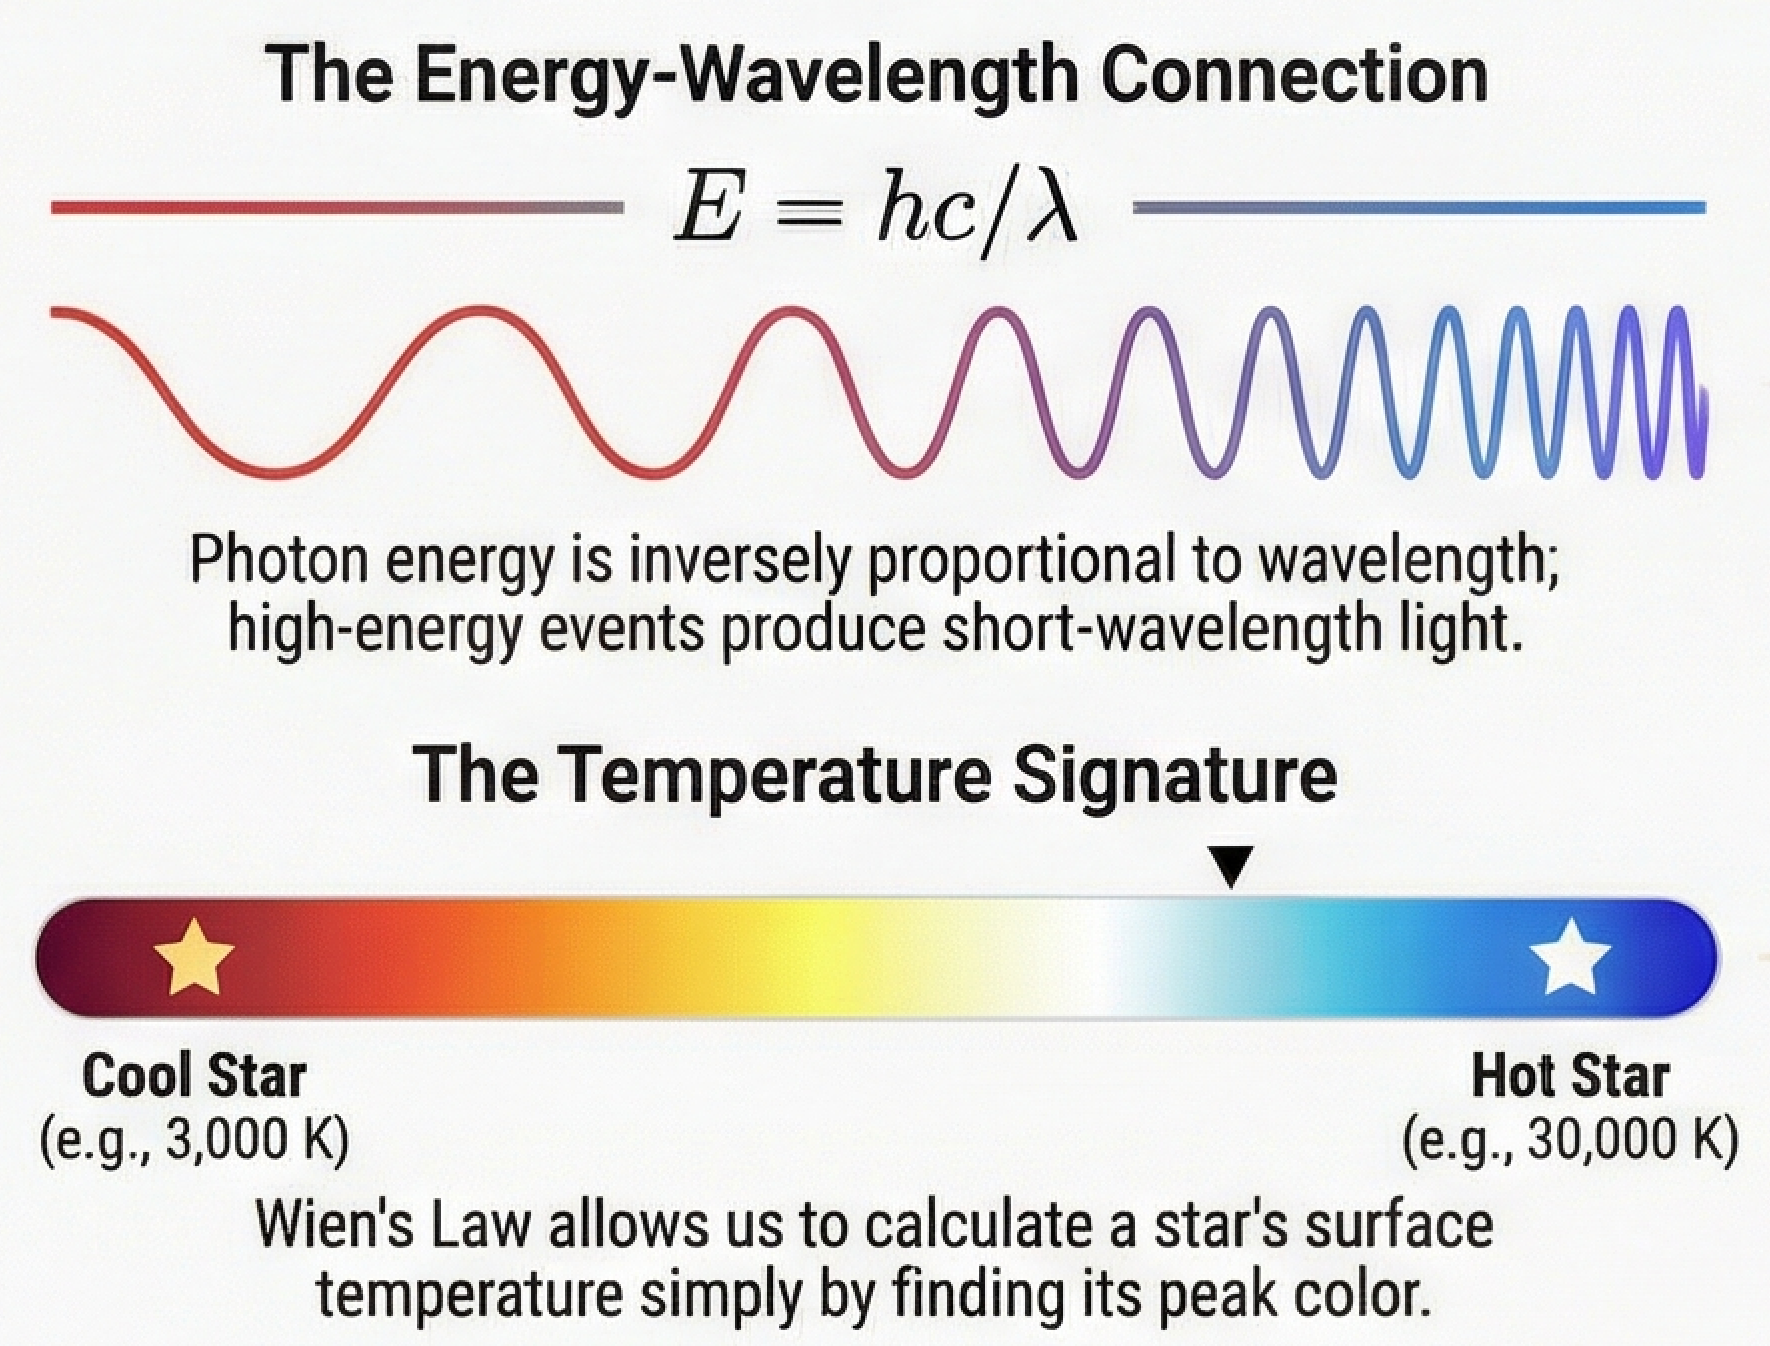
To use Stefan-Boltzmann we need an independent temperature. Wien’s displacement law supplies it: measure a star’s color (where its spectrum peaks) and read off temperature directly.
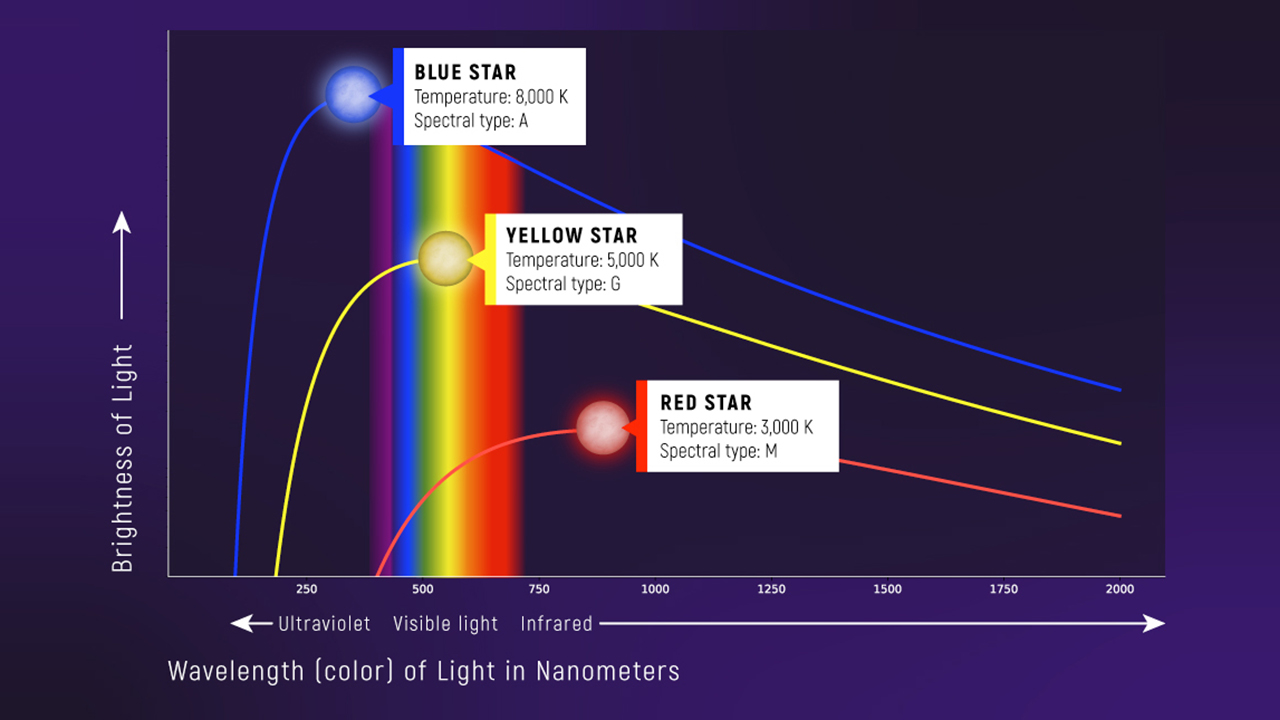
A star’s color is its temperature. Hotter stars peak at shorter (bluer) wavelengths; cooler stars peak at longer (redder) wavelengths. The relationship is inverse — double the temperature, halve the peak wavelength.
wien-displacement(T)energy-wavelength-connection(T)Each Planck curve has a single peak, and
Wien's law
with — the peak wavelength of a blackbody’s per-wavelength Planck curve is inversely proportional to temperature. Hotter is bluer.
Problem
From : (1) doubles → peak wavelength? (2) A star twice as hot as the Sun peaks where, relative to the Sun? (3) One star peaks red (700 nm), another blue (400 nm) — what’s the temperature ratio?
- Halves — peak wavelength is inversely proportional to temperature.
- Halves — at twice the Sun’s temperature, the peak is at half the wavelength (~250 nm, ultraviolet).
- Blue is hotter — since .
Problem
The Sun’s spectrum peaks at . Calculate its surface temperature using Wien’s law, , with .
StepApply Wien's law
.
Dimensional check
✓ — the nm cancels, leaving kelvin.
Result
, matching the directly measured solar surface temperature — a validation that the Sun radiates approximately as a blackbody.
Problem
Rigel (blue) peaks at ; Betelgeuse (red) at . Find both temperatures via Wien’s law.
StepRigel
.
StepBetelgeuse
.
Dimensional check
✓ for both.
Result
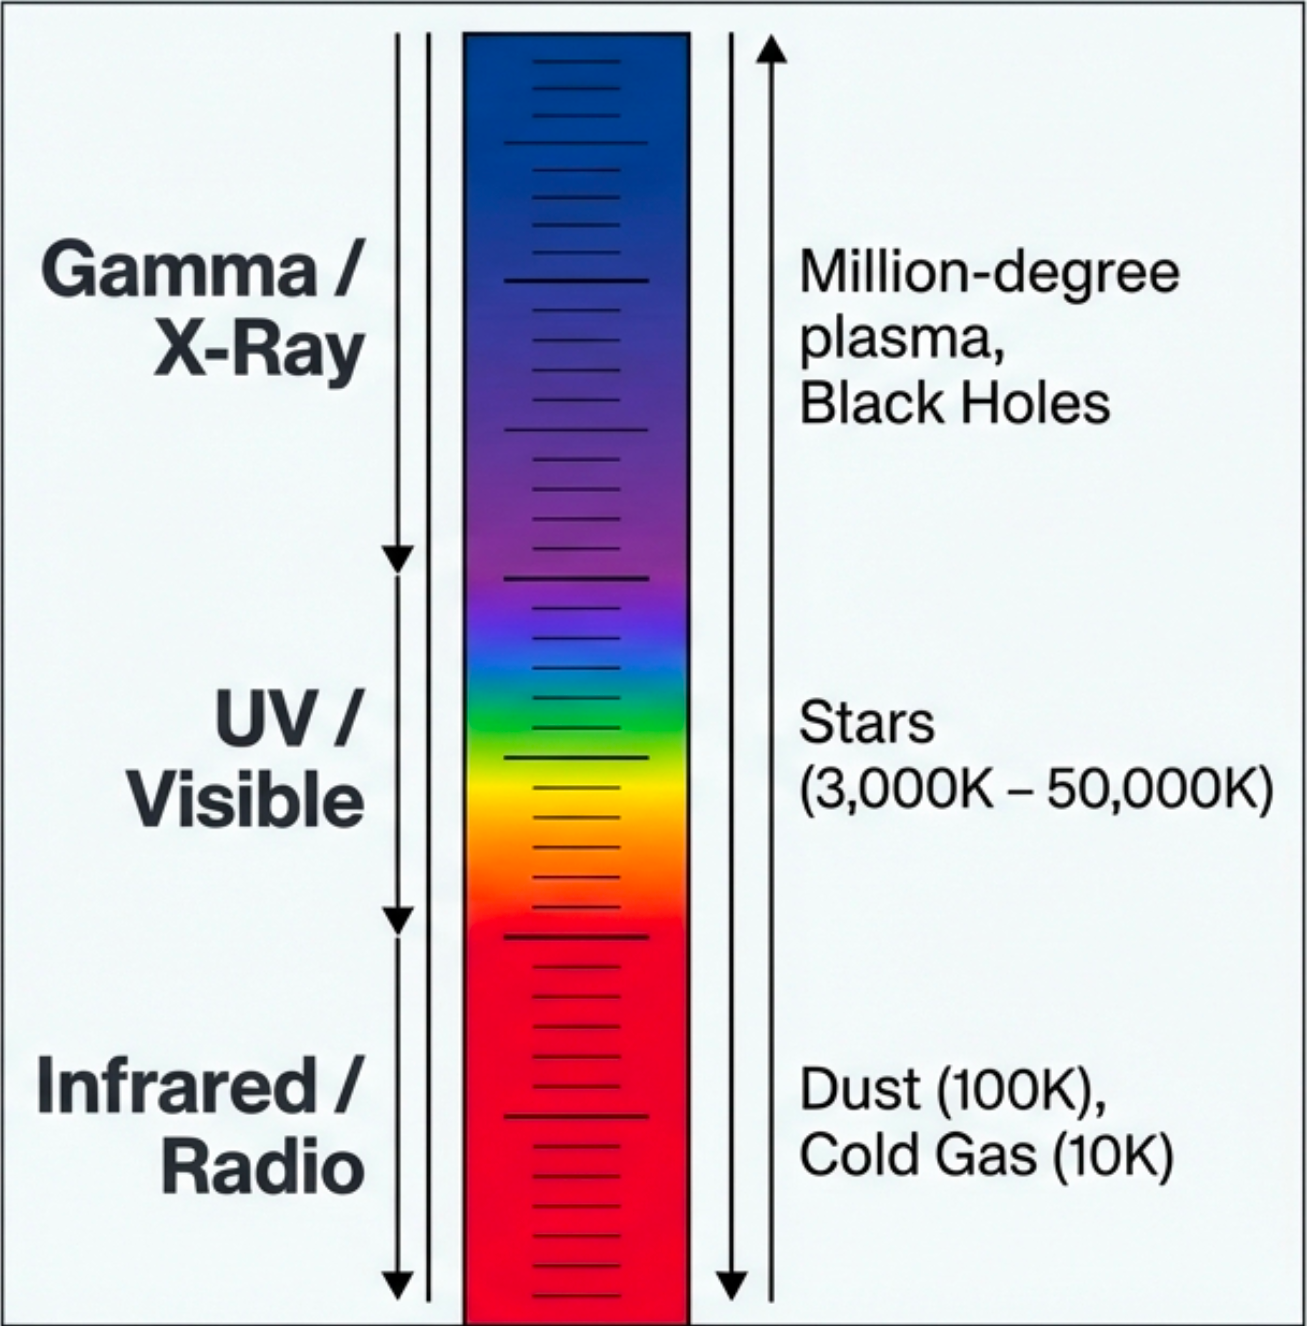
— Rigel is about 3.5 times hotter. Their visible colors directly reflect this: hot is blue, cool is red. This color–temperature relationship anchors the HR diagram’s horizontal axis.
Inferring Stellar Radii
Part 6: Inferring Stellar Radii
We trust radii inferred from light because the chain is cross-validated: parallax distances match photometric luminosities, interferometry measures some angular diameters directly, and eclipsing binaries give independent sizes. The chain is model-based but repeatedly tested.
Solving the Stefan-Boltzmann law for radius: isolate , then raise to the power, . In solar units, .
Problem
Sirius A has and (from color), with , . Find its radius.
StepTemperature ratio, fourth power
, so .
StepSolve in solar units
, so .
Dimensional check
Solar-unit ratios are dimensionless; the result is a pure multiple of ✓. In CGS, .
Result
. Hot stars don’t need to be big to be bright: at , each cm² radiates the Sun’s surface power, so 25× the luminosity needs only ~70% more radius.
Predict first
Betelgeuse is 10^5 times more luminous than the Sun but only 60% as hot. Will its radius be closer to 10x, 100x, or 1000x the Sun's? Commit before checking the calculation.
Then work Example 4 below.
Problem
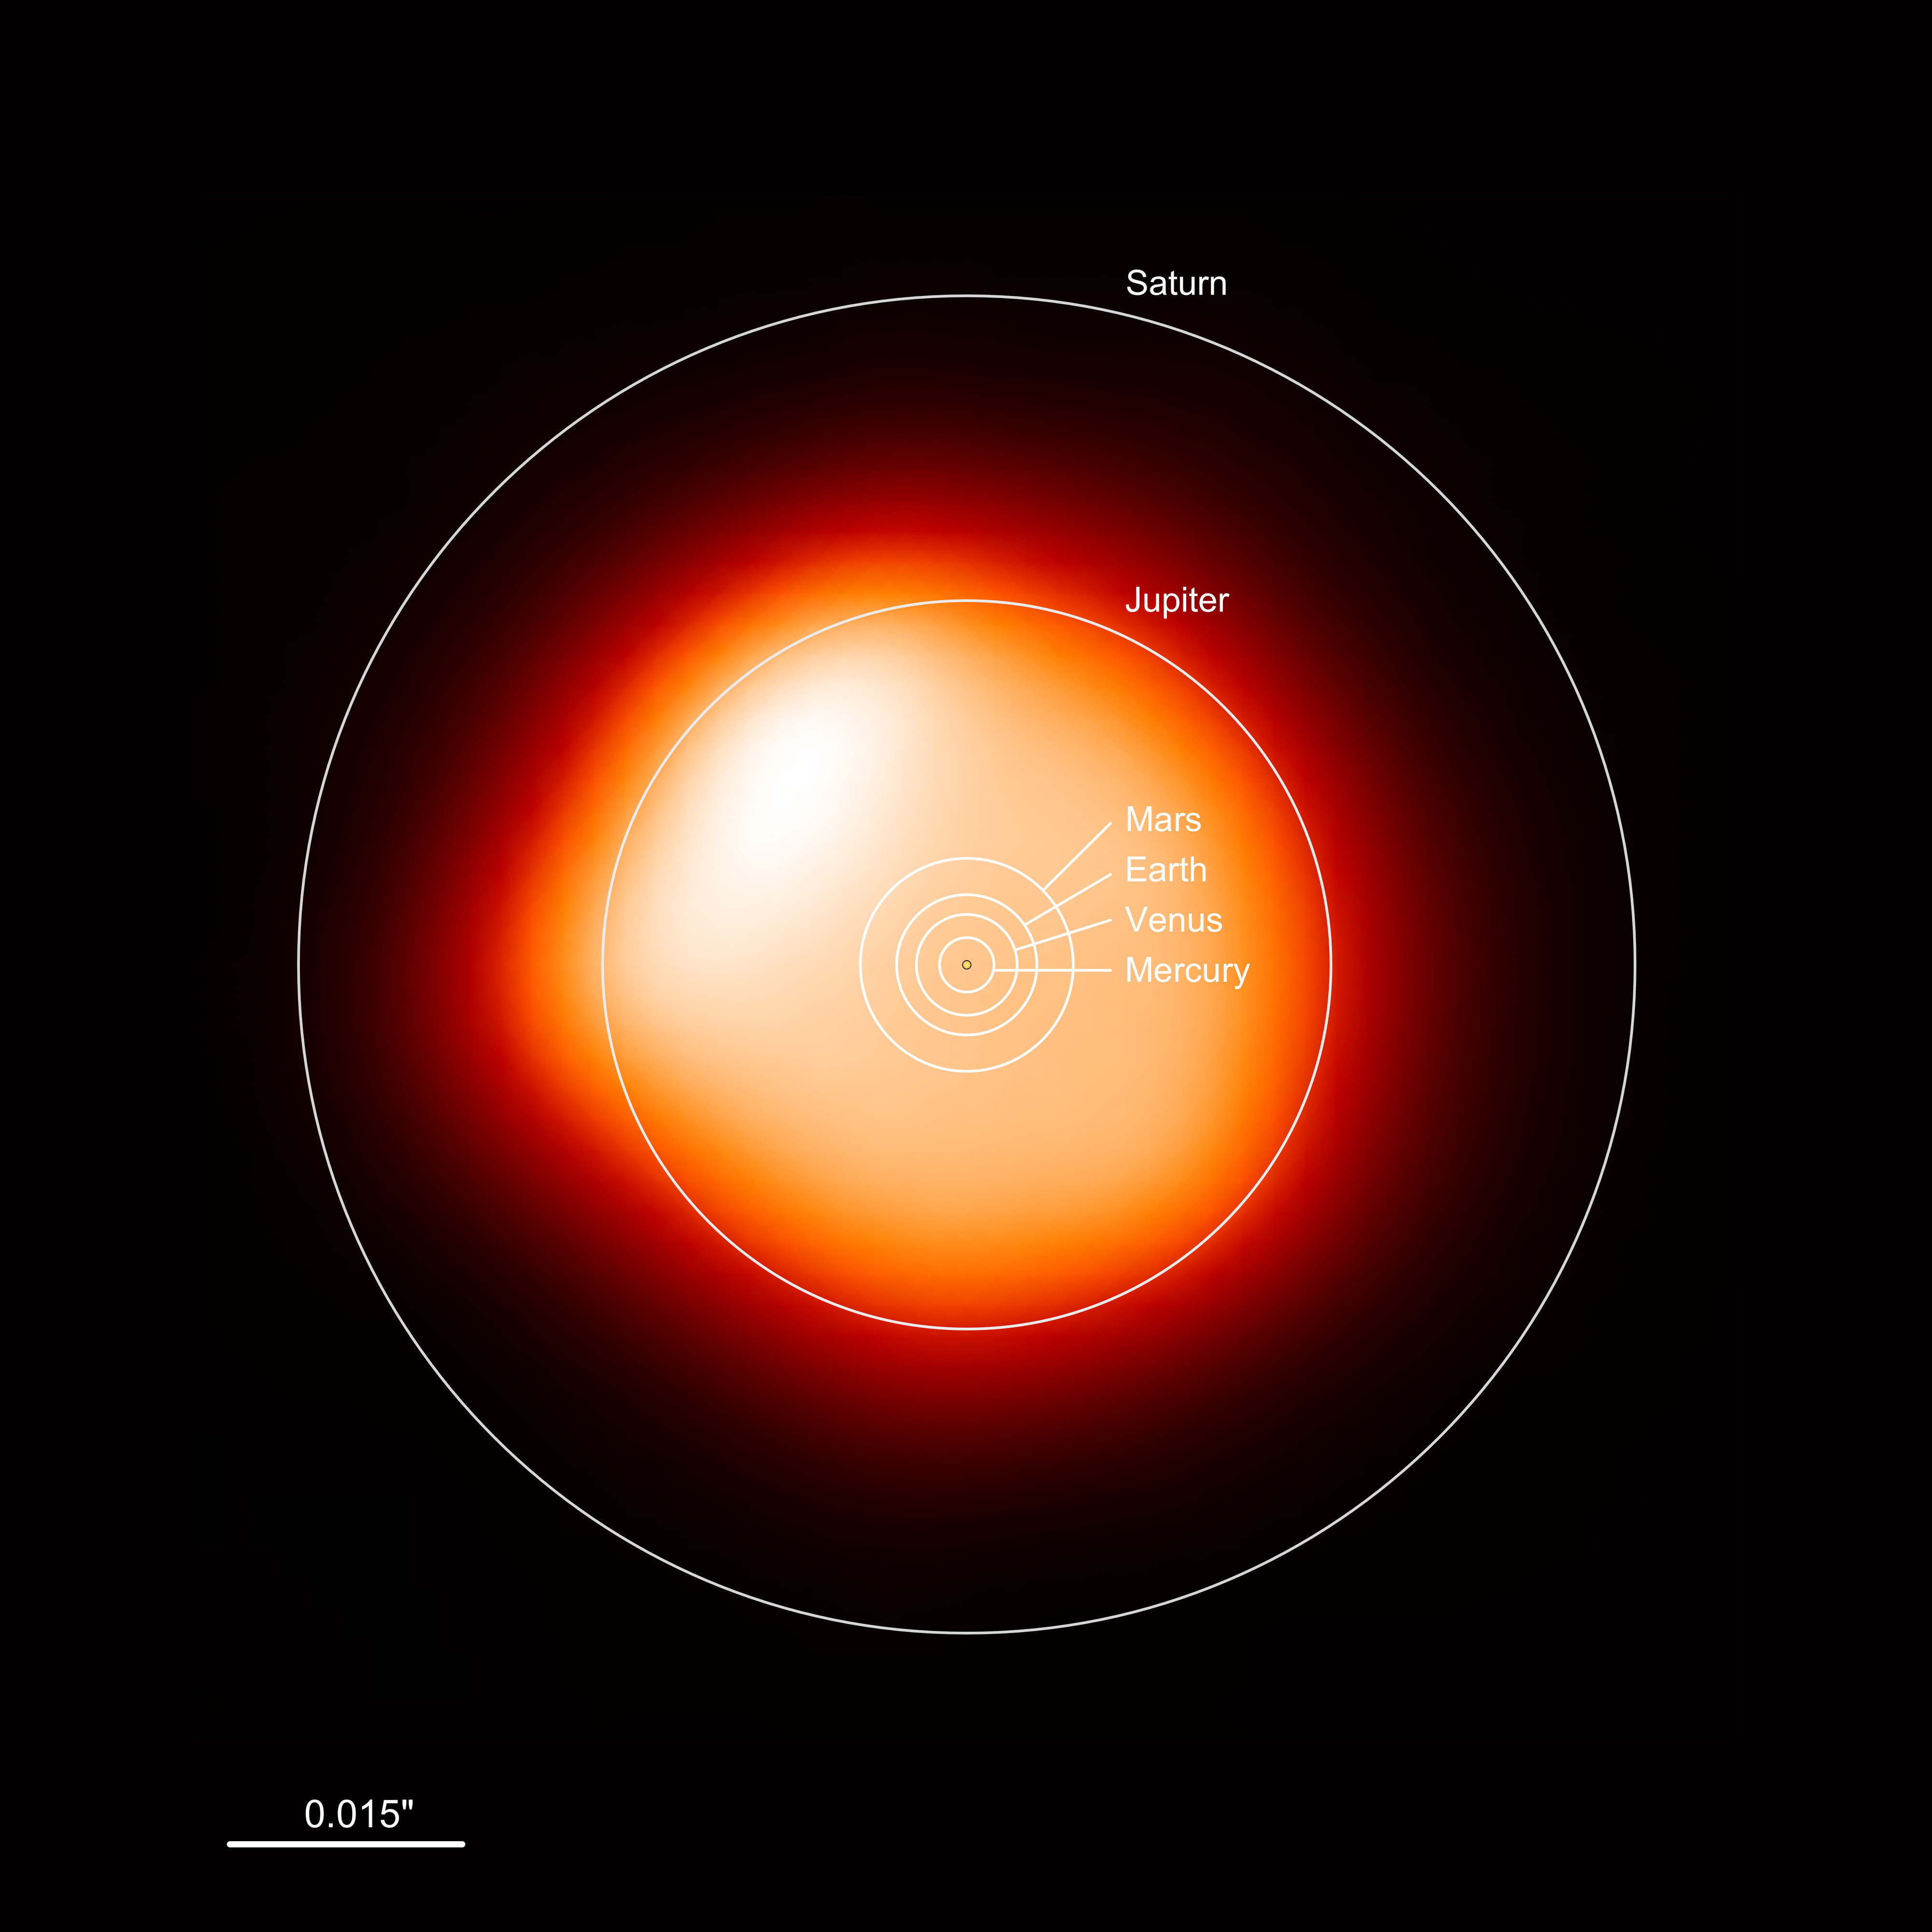
Betelgeuse has and . Find its radius and compare it to the Sun.
StepTemperature ratio, fourth power
, so .
StepSolve in solar units
, so .
Dimensional check
Dimensionless ratios ✓. In physical units, .
Result
— its surface would reach past Mars and approach Jupiter. It is enormous because it is cool: each cm² radiates only of the Sun’s surface power, so producing demands ~760,000× the Sun’s surface area.
Without looking back: two stars have the same luminosity but one is twice as hot. Which is larger, and by what factor? Which equation justifies it?
The cooler star is larger. At fixed , the Stefan-Boltzmann law gives , so doubling the temperature shrinks the radius by a factor of — the hotter star is one-quarter the radius.
Color and the HR Diagram
Part 7: Color and the HR Diagram (Preview)
Hot stars are blue (short peak, high ); cool stars are red (long peak, low ); the relationship is quantitative, . Astronomers use color indices — brightness in two filter bands — to estimate temperature without finding the exact peak.
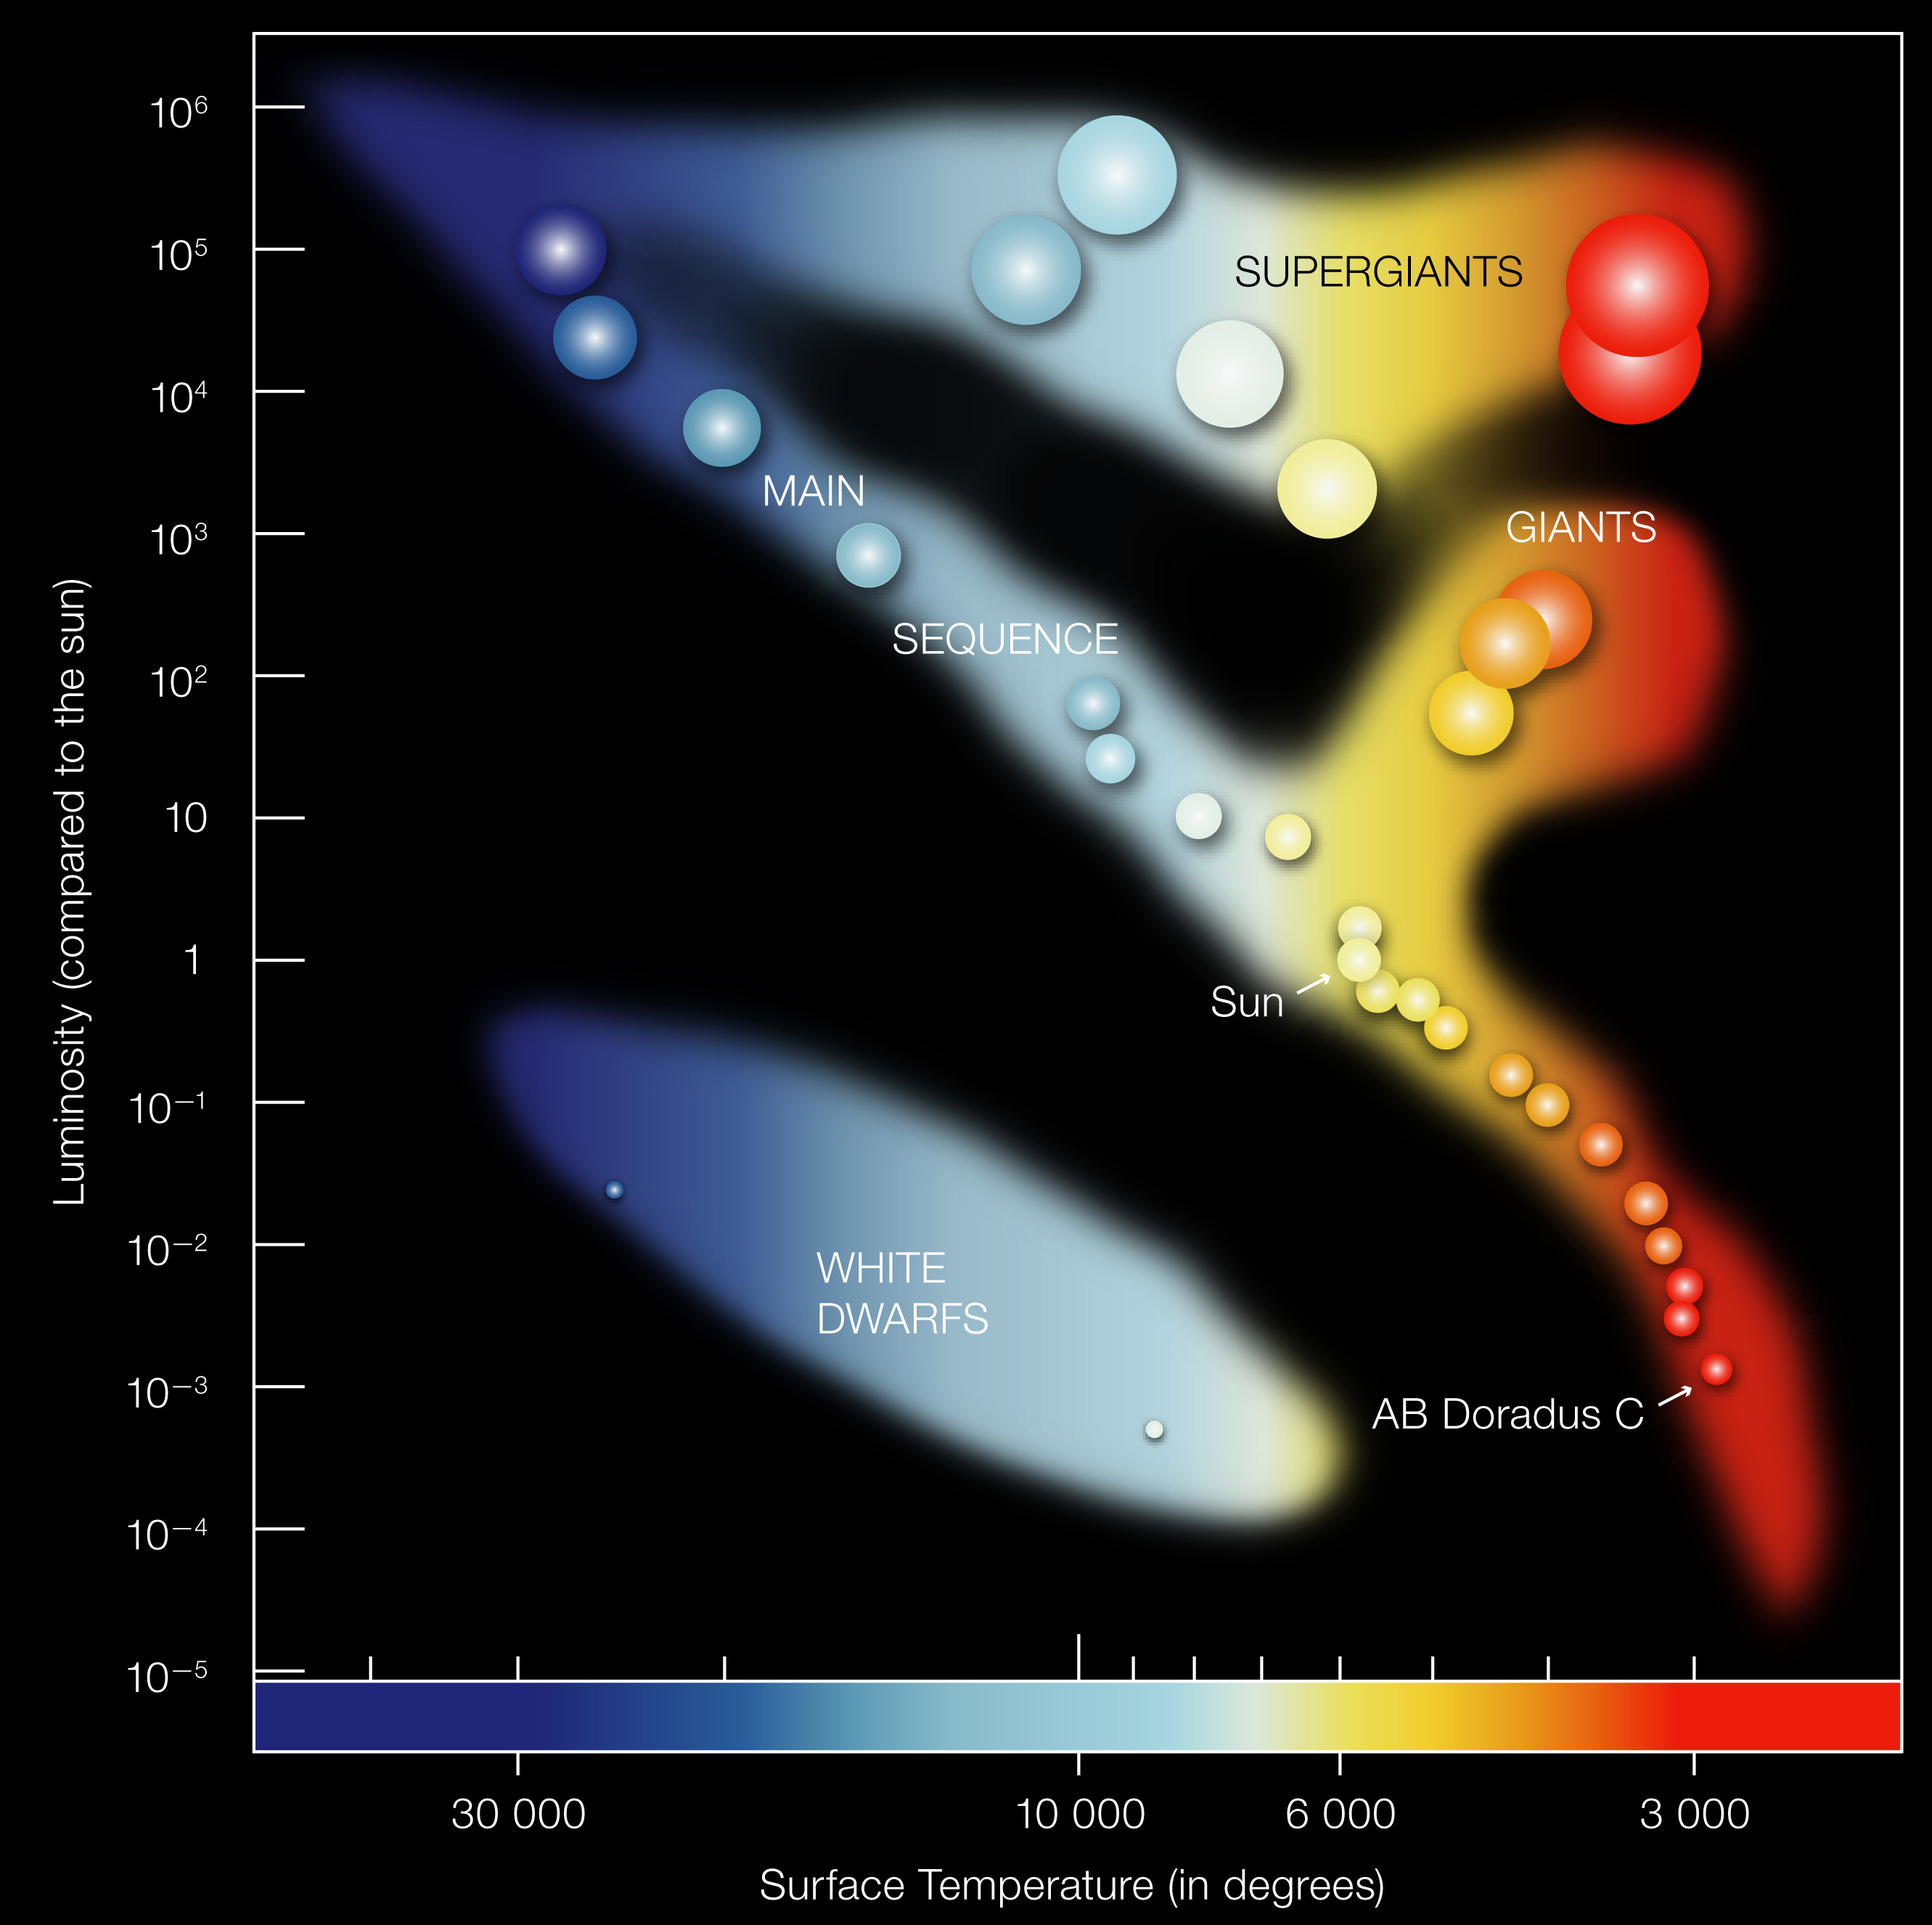
The Hertzsprung-Russell diagram plots luminosity (vertical) against temperature/color (horizontal). The key insight: the horizontal axis is a temperature axis — hot blue stars on the left, cool red stars on the right (historical convention). Since , lines of constant radius are diagonal curves across it; every star lies on some constant- curve.
When you plot many stars, they cluster: the main sequence (hydrogen-burning, where the Sun lives), the giant branch (cool but luminous — large radii compensate), and the white dwarf sequence (hot but dim — tiny radii, ~). Lines of constant radius separate these populations.
Assumptions and Synthesis
Part 8: Assumptions and Limitations
The Stefan-Boltzmann law assumes:
- Spherical symmetry — uniform radiation from a sphere of radius . Reality: rapid rotators are oblate, binaries tidally distorted. Small error for most stars.
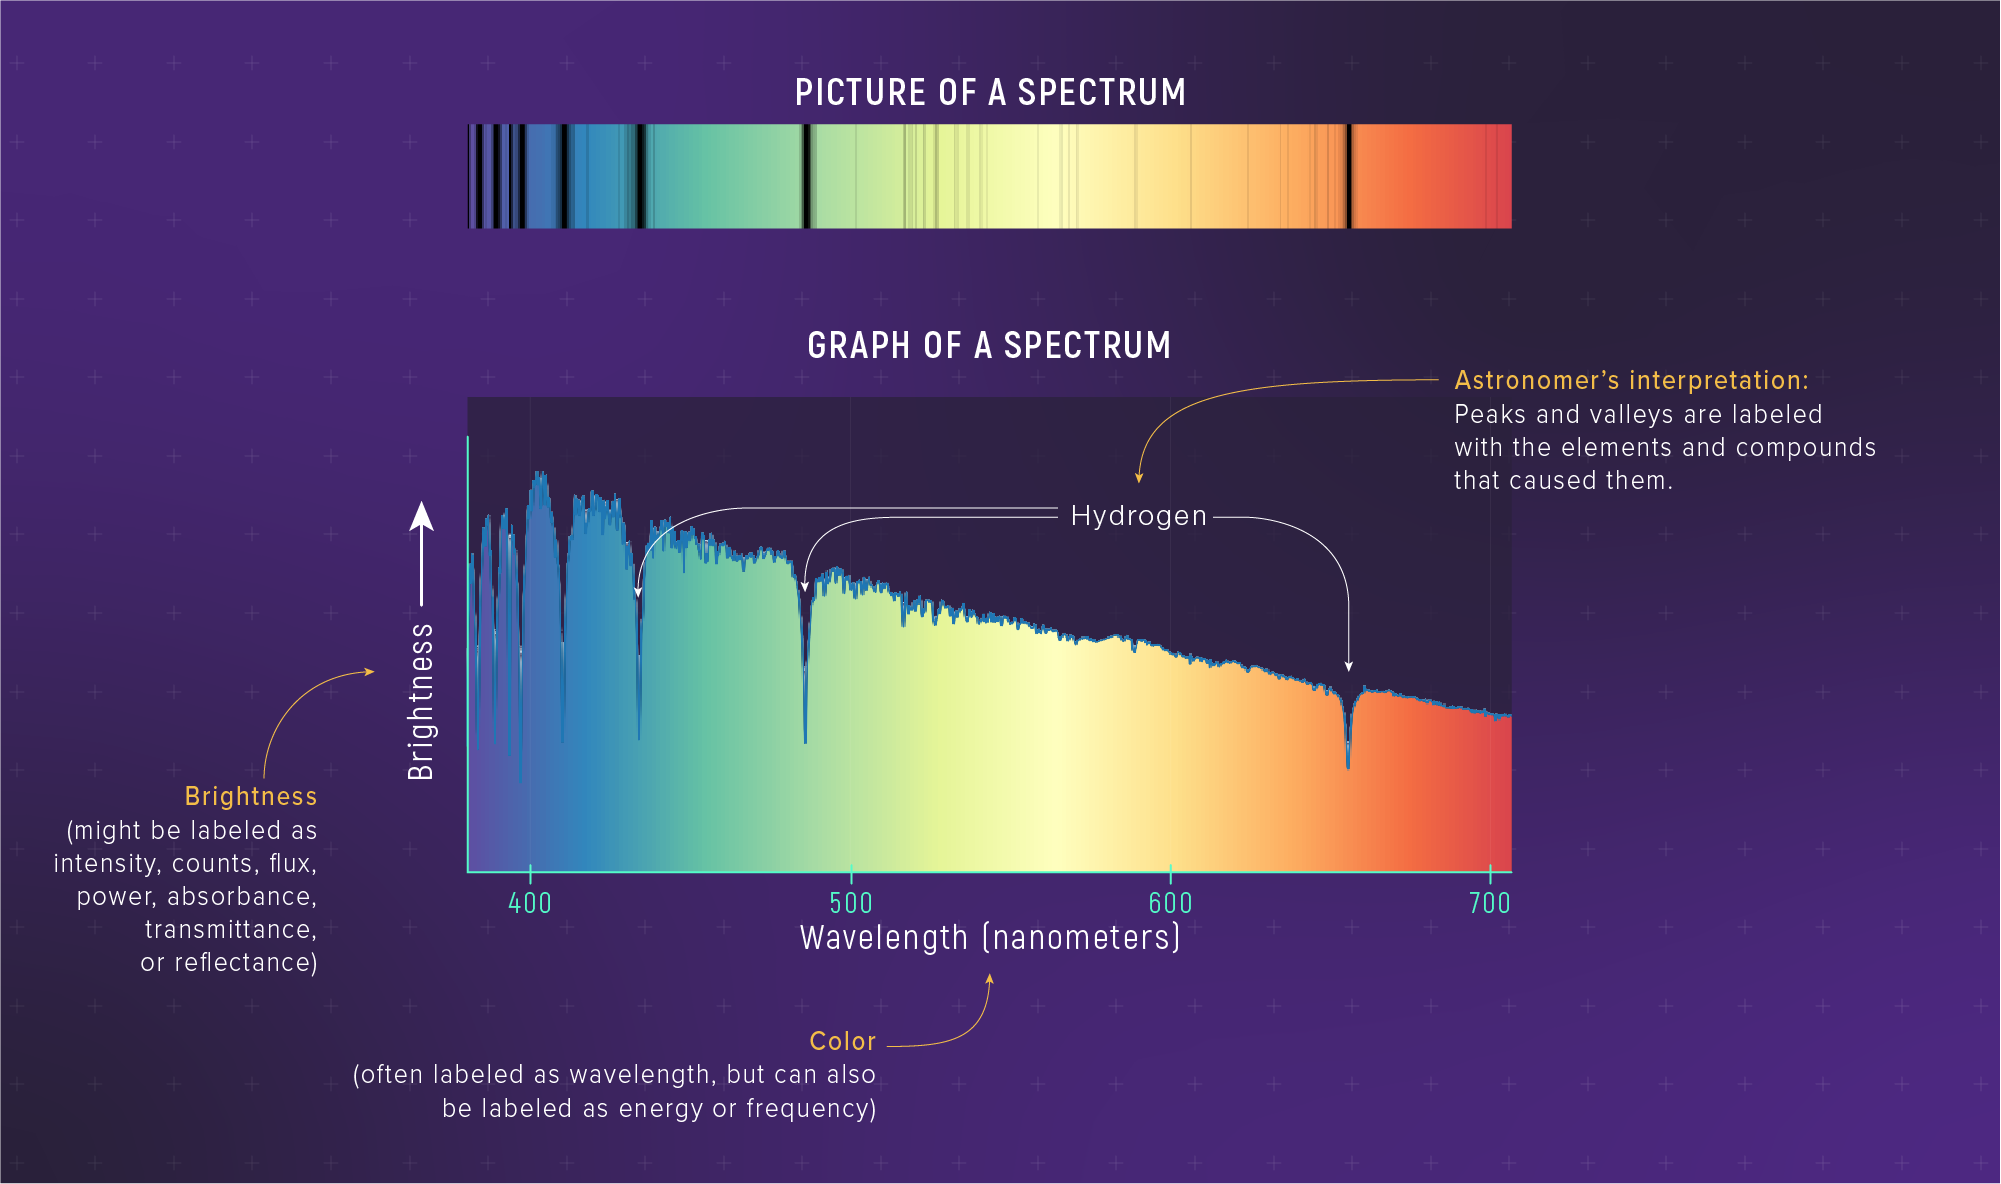
- Uniform surface temperature — Reality: gradients and starspots exist, so is an effective temperature: the blackbody temperature reproducing the total flux.
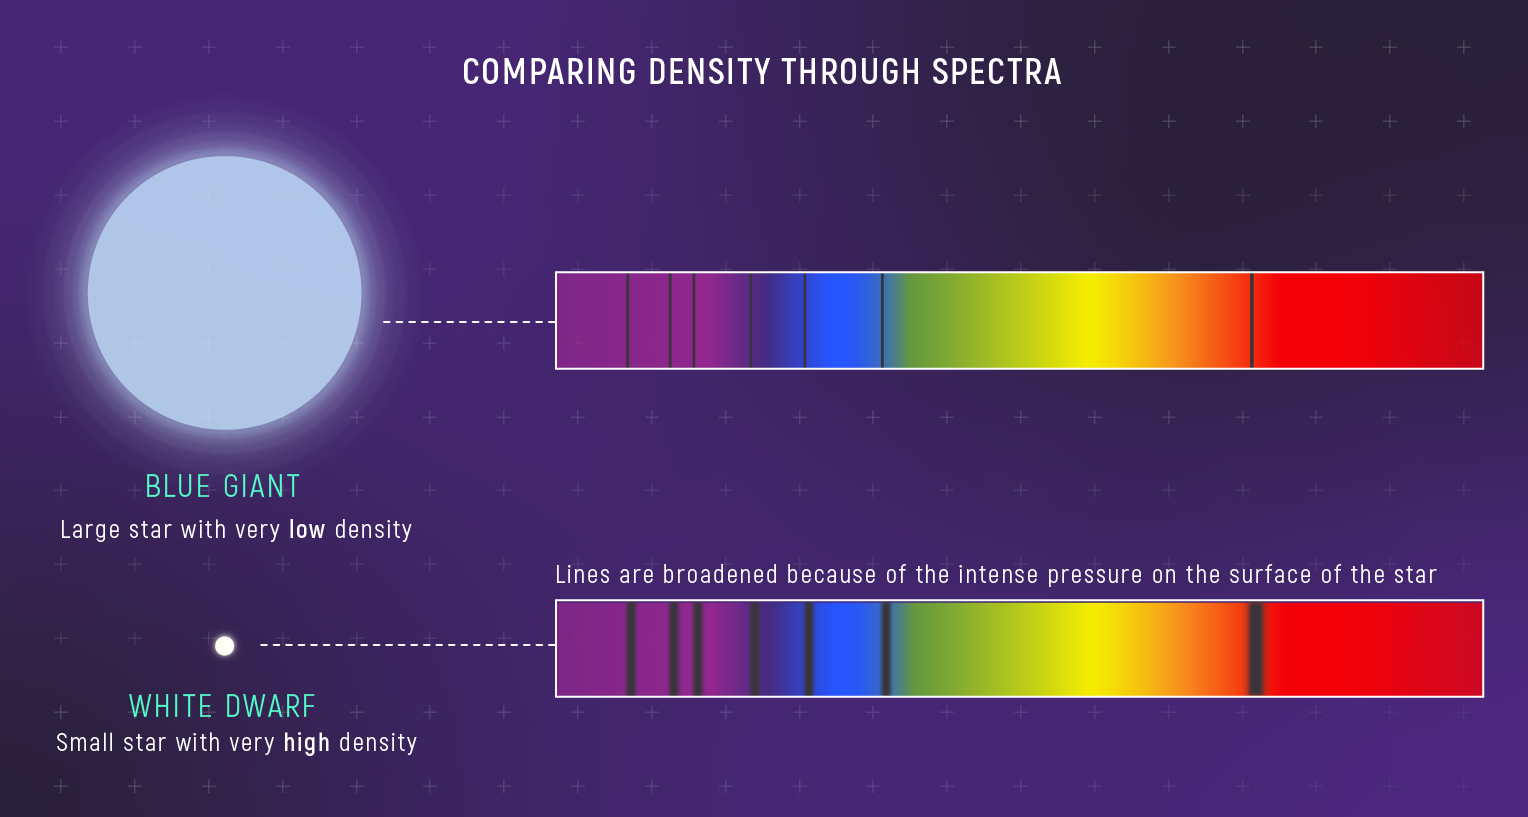
- Blackbody radiation — Reality: real spectra have absorption lines and non-thermal emission, but the overall Planck shape is a good approximation; lines are second-order.
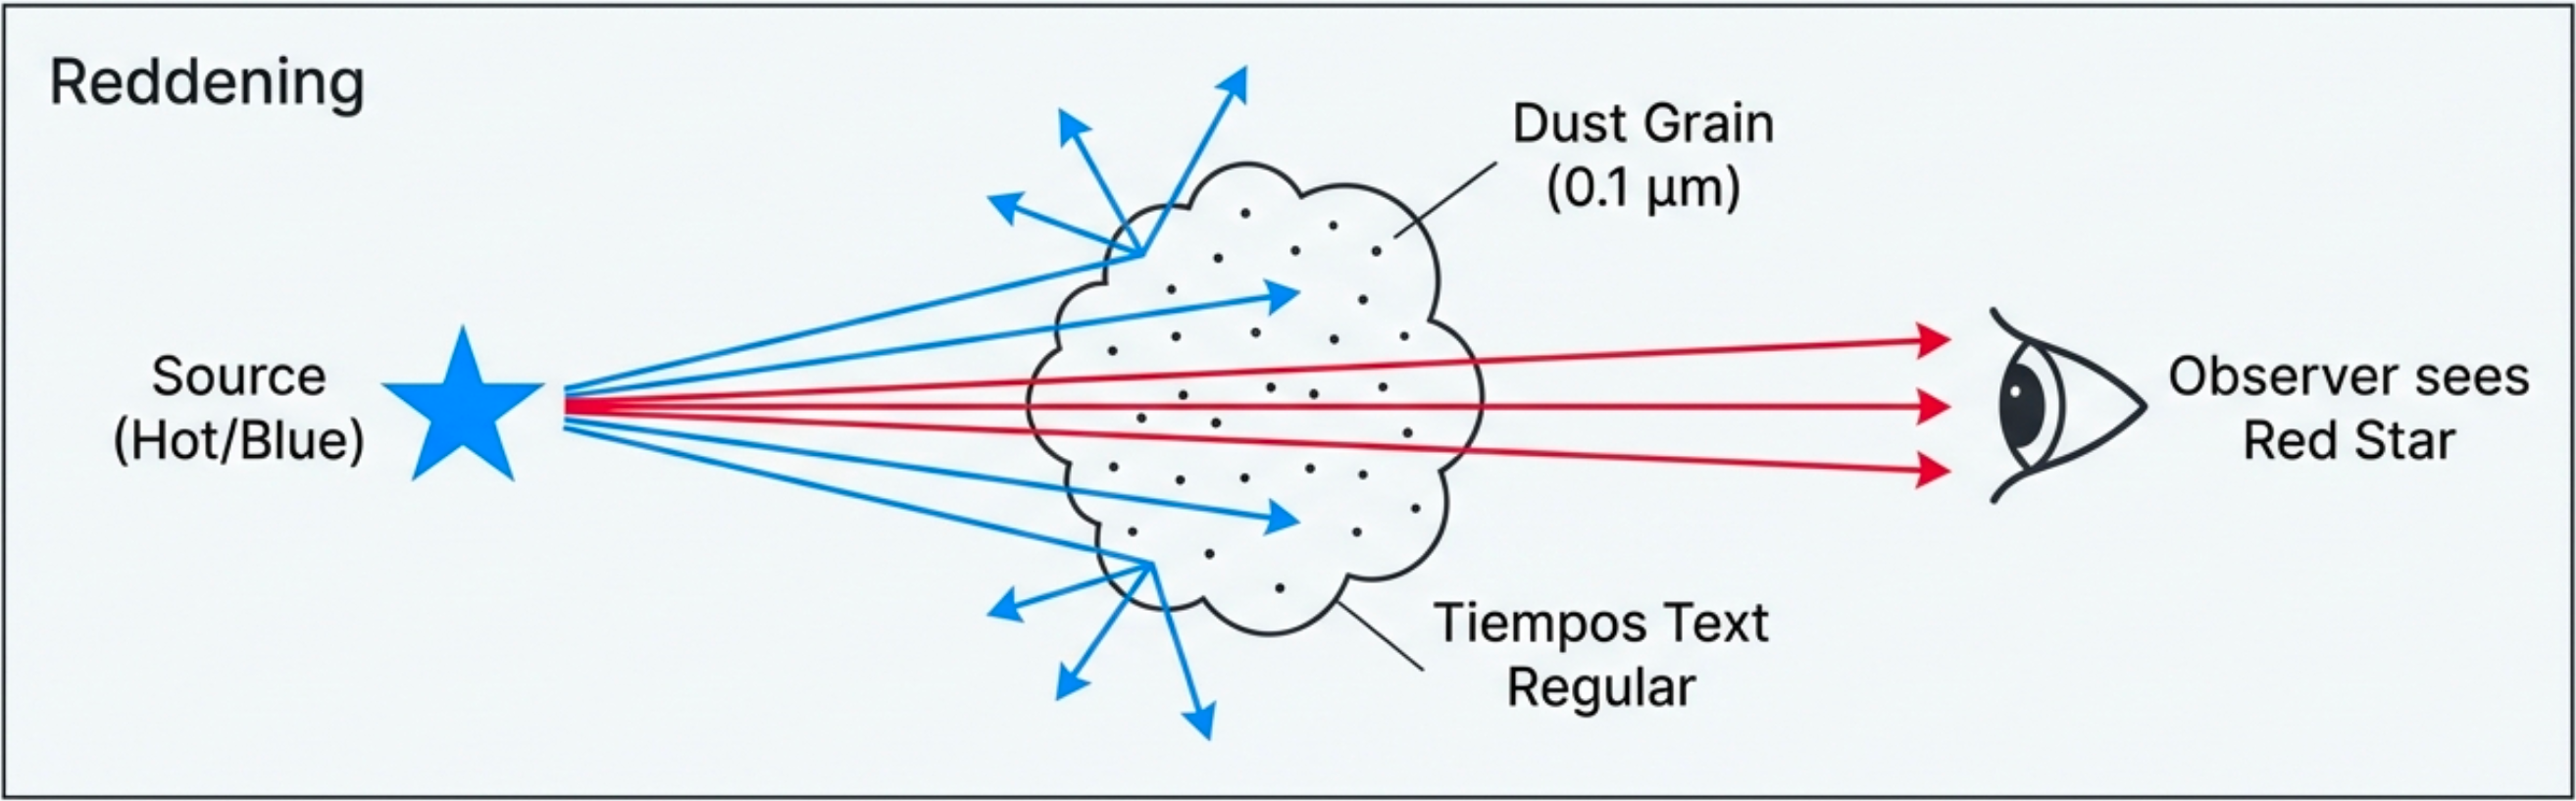
Astronomers determine
Effective temperature
The temperature a uniform blackbody would need to radiate the same total surface flux as the star, . It is the "" used throughout the Stefan-Boltzmann and Wien relations.
Summary: Observable → Model → Inference
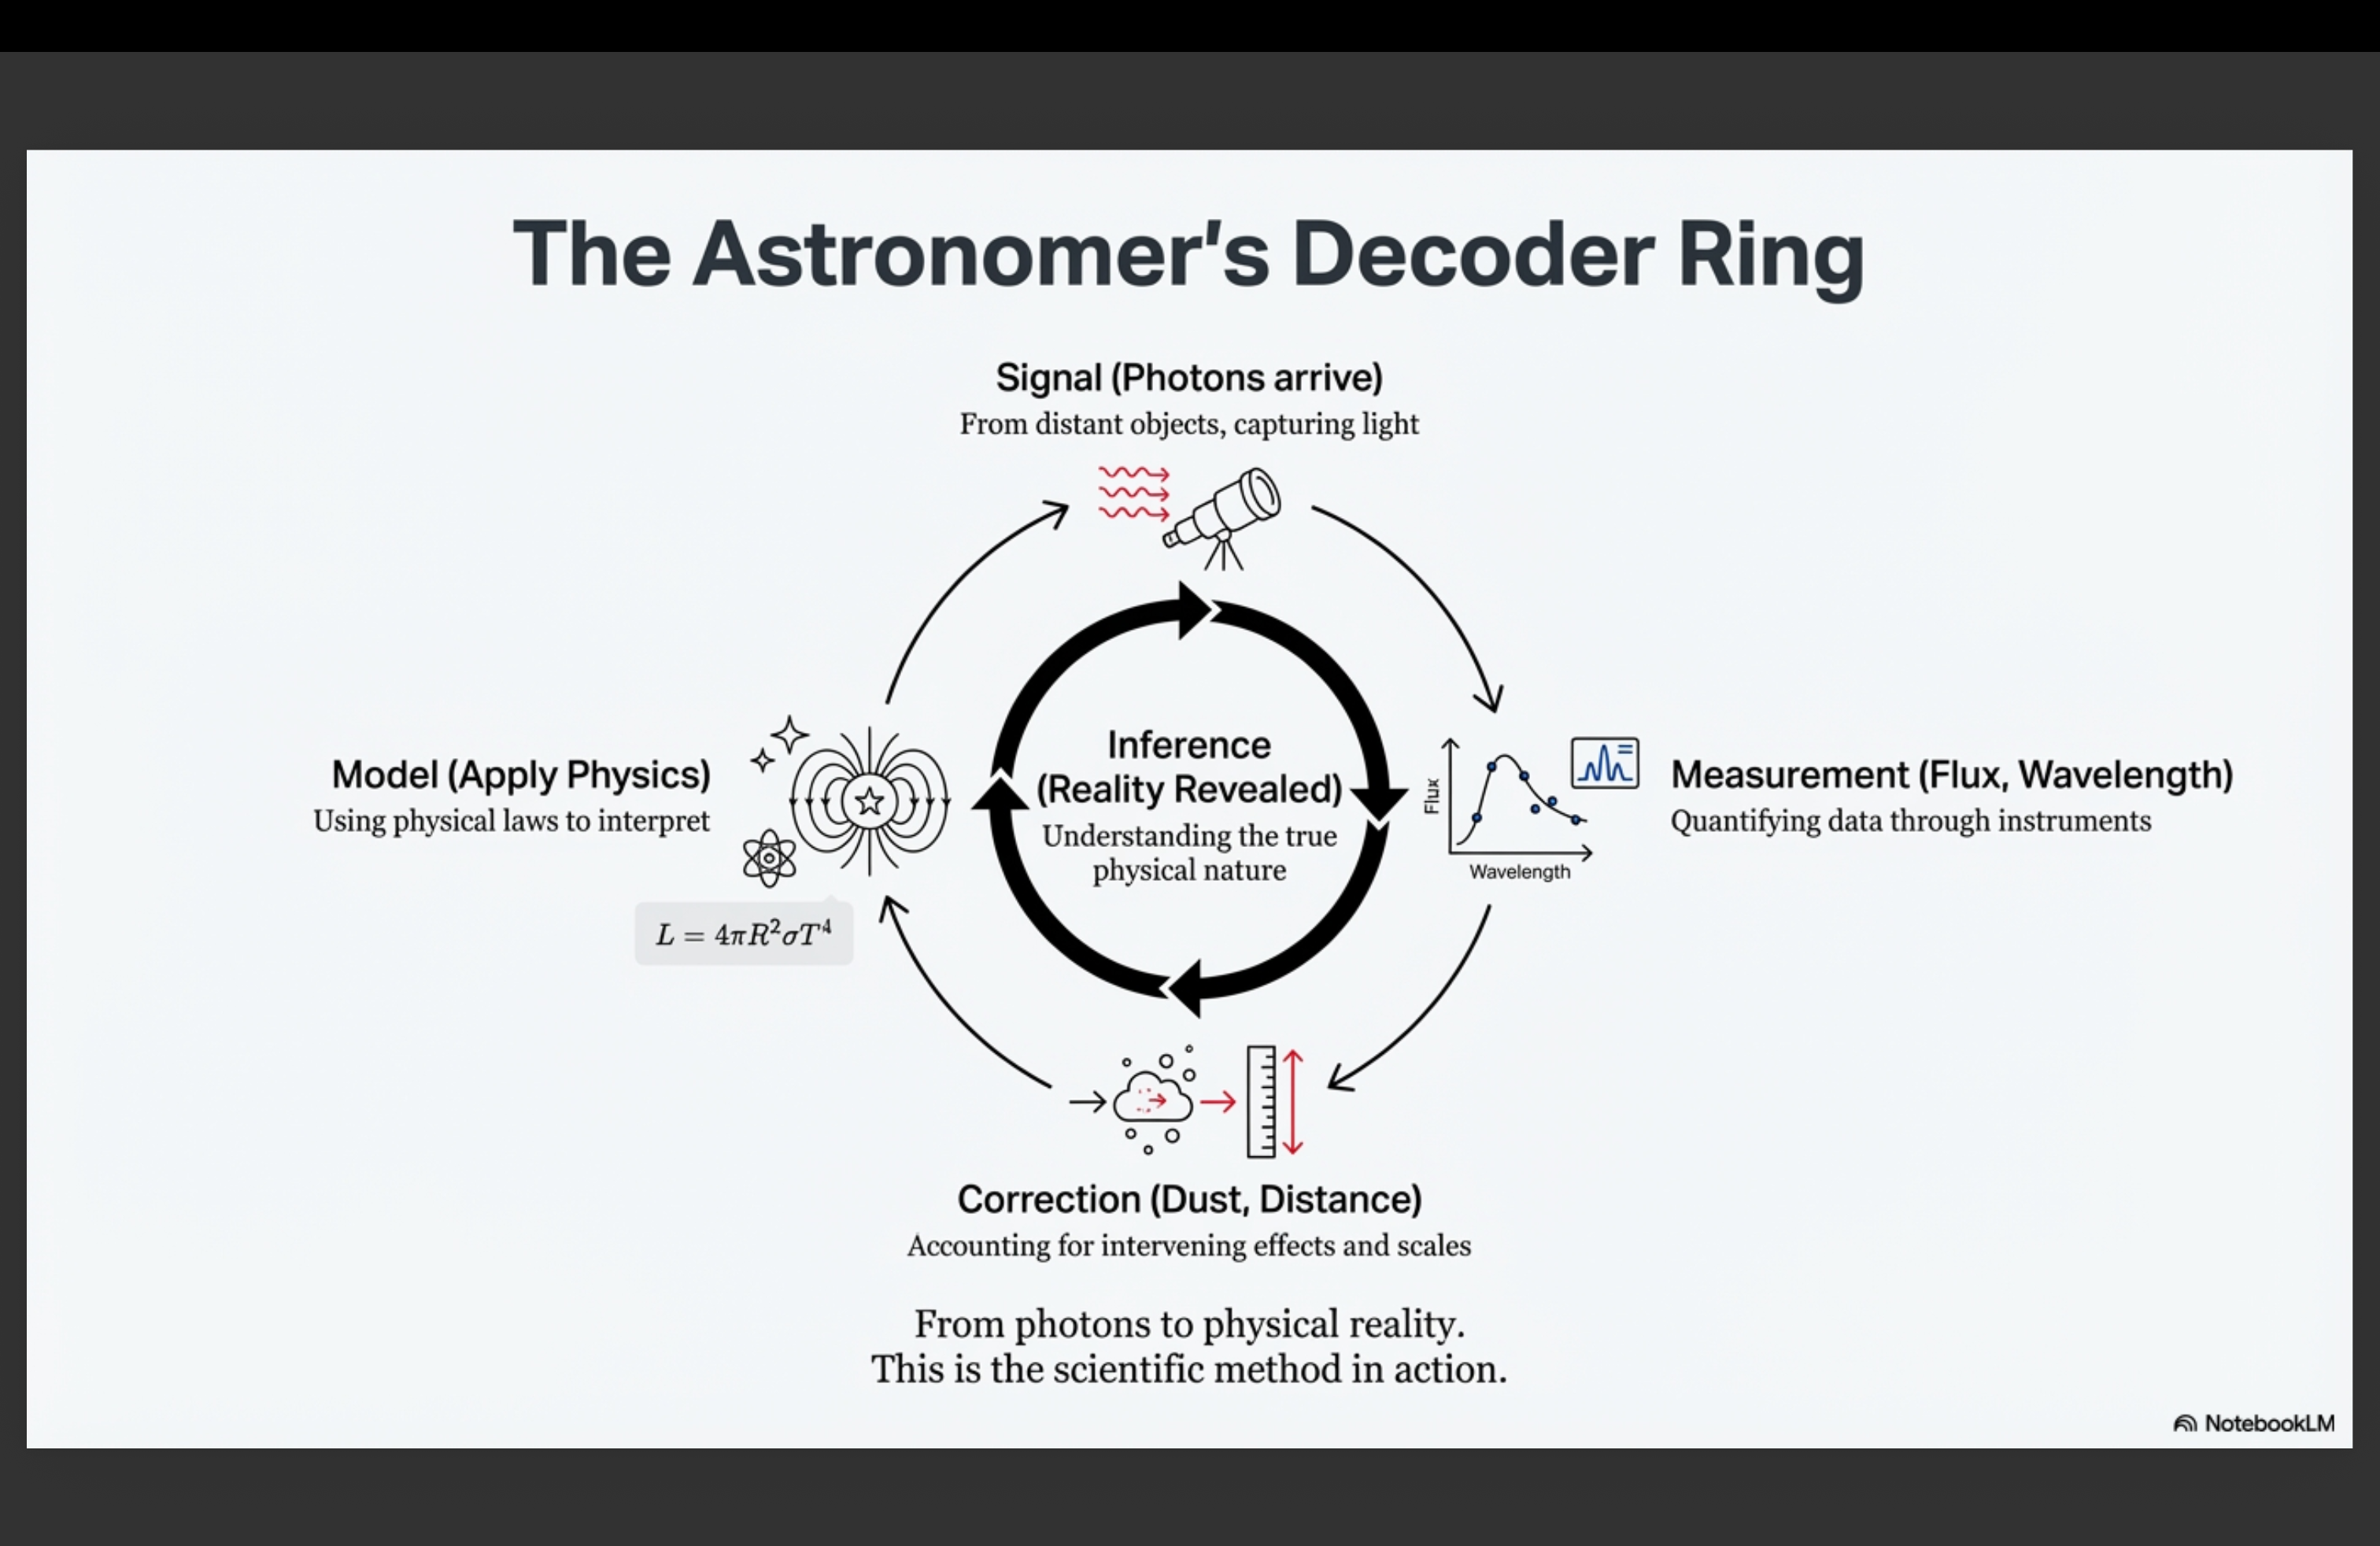
| We observe | We use | We infer |
|---|---|---|
| Received flux at distance | Luminosity | |
| Peak wavelength | Wien: | Temperature |
| Luminosity and temperature | Stefan-Boltzmann: | Radius |
Each star yields at least three fundamental properties from two measurements (brightness + color) and one distance. That is the power of multi-wavelength, multi-technique astronomy.
Glossary
- Effective temperature
The temperature a uniform blackbody would need to radiate the same total surface flux as the star, . It is the "" used throughout the Stefan-Boltzmann and Wien relations.
- Received flux
The power per unit area an observer measures at distance , . Distance-dependent — it falls as .
- Stefan-Boltzmann law
— the total power a spherical blackbody of radius and effective temperature radiates. Surface flux times area .
- Surface flux
The power per unit area radiated at the star’s own surface, . It depends only on the star’s intrinsic properties ( and ), not on the observer’s distance.
- Wien's law
with — the peak wavelength of a blackbody’s per-wavelength Planck curve is inversely proportional to temperature. Hotter is bluer.