Light as Information
Section 6 of 9
Atoms and Spectral Lines
Part 6: Atoms and Spectral Lines
The Sun’s spectrum isn’t a smooth rainbow — it’s crossed by hundreds of dark absorption lines. They aren’t imperfections; they’re information. The key idea: atoms have quantized energy levels.
The Bohr Model
Modern quantum mechanics is deeper, but the
Bohr model
An early model of the atom in which an electron occupies discrete, quantized energy levels labeled by an integer . It correctly predicts hydrogen’s energy levels and spectral lines, and supplies the intuition behind quantum atomic structure.
For hydrogen, the energy of level is:
The ground state () is the most tightly bound; higher levels have energies closer to zero (less bound, easier to ionize).
Photon Absorption and Emission
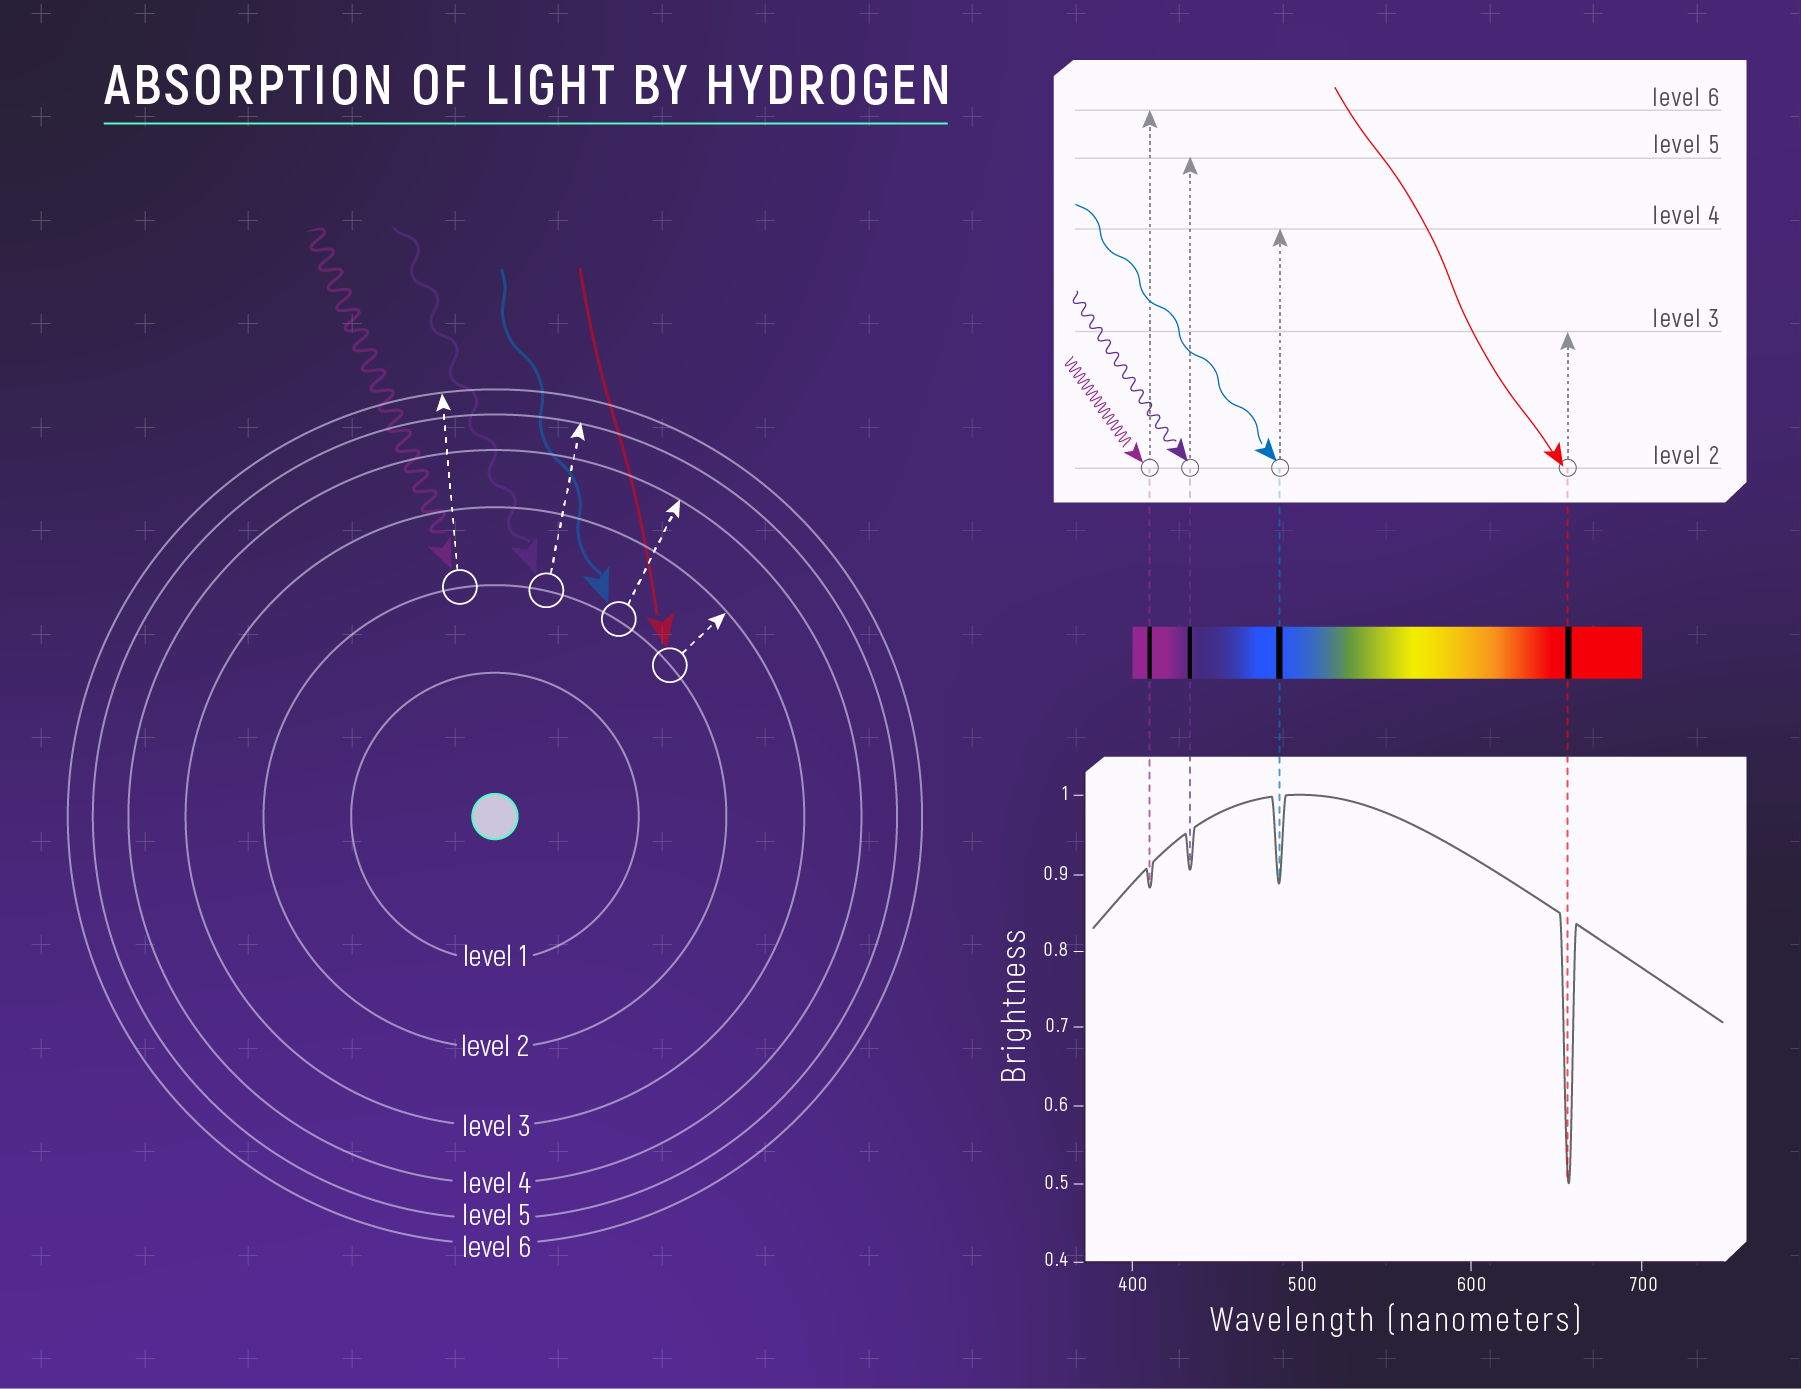
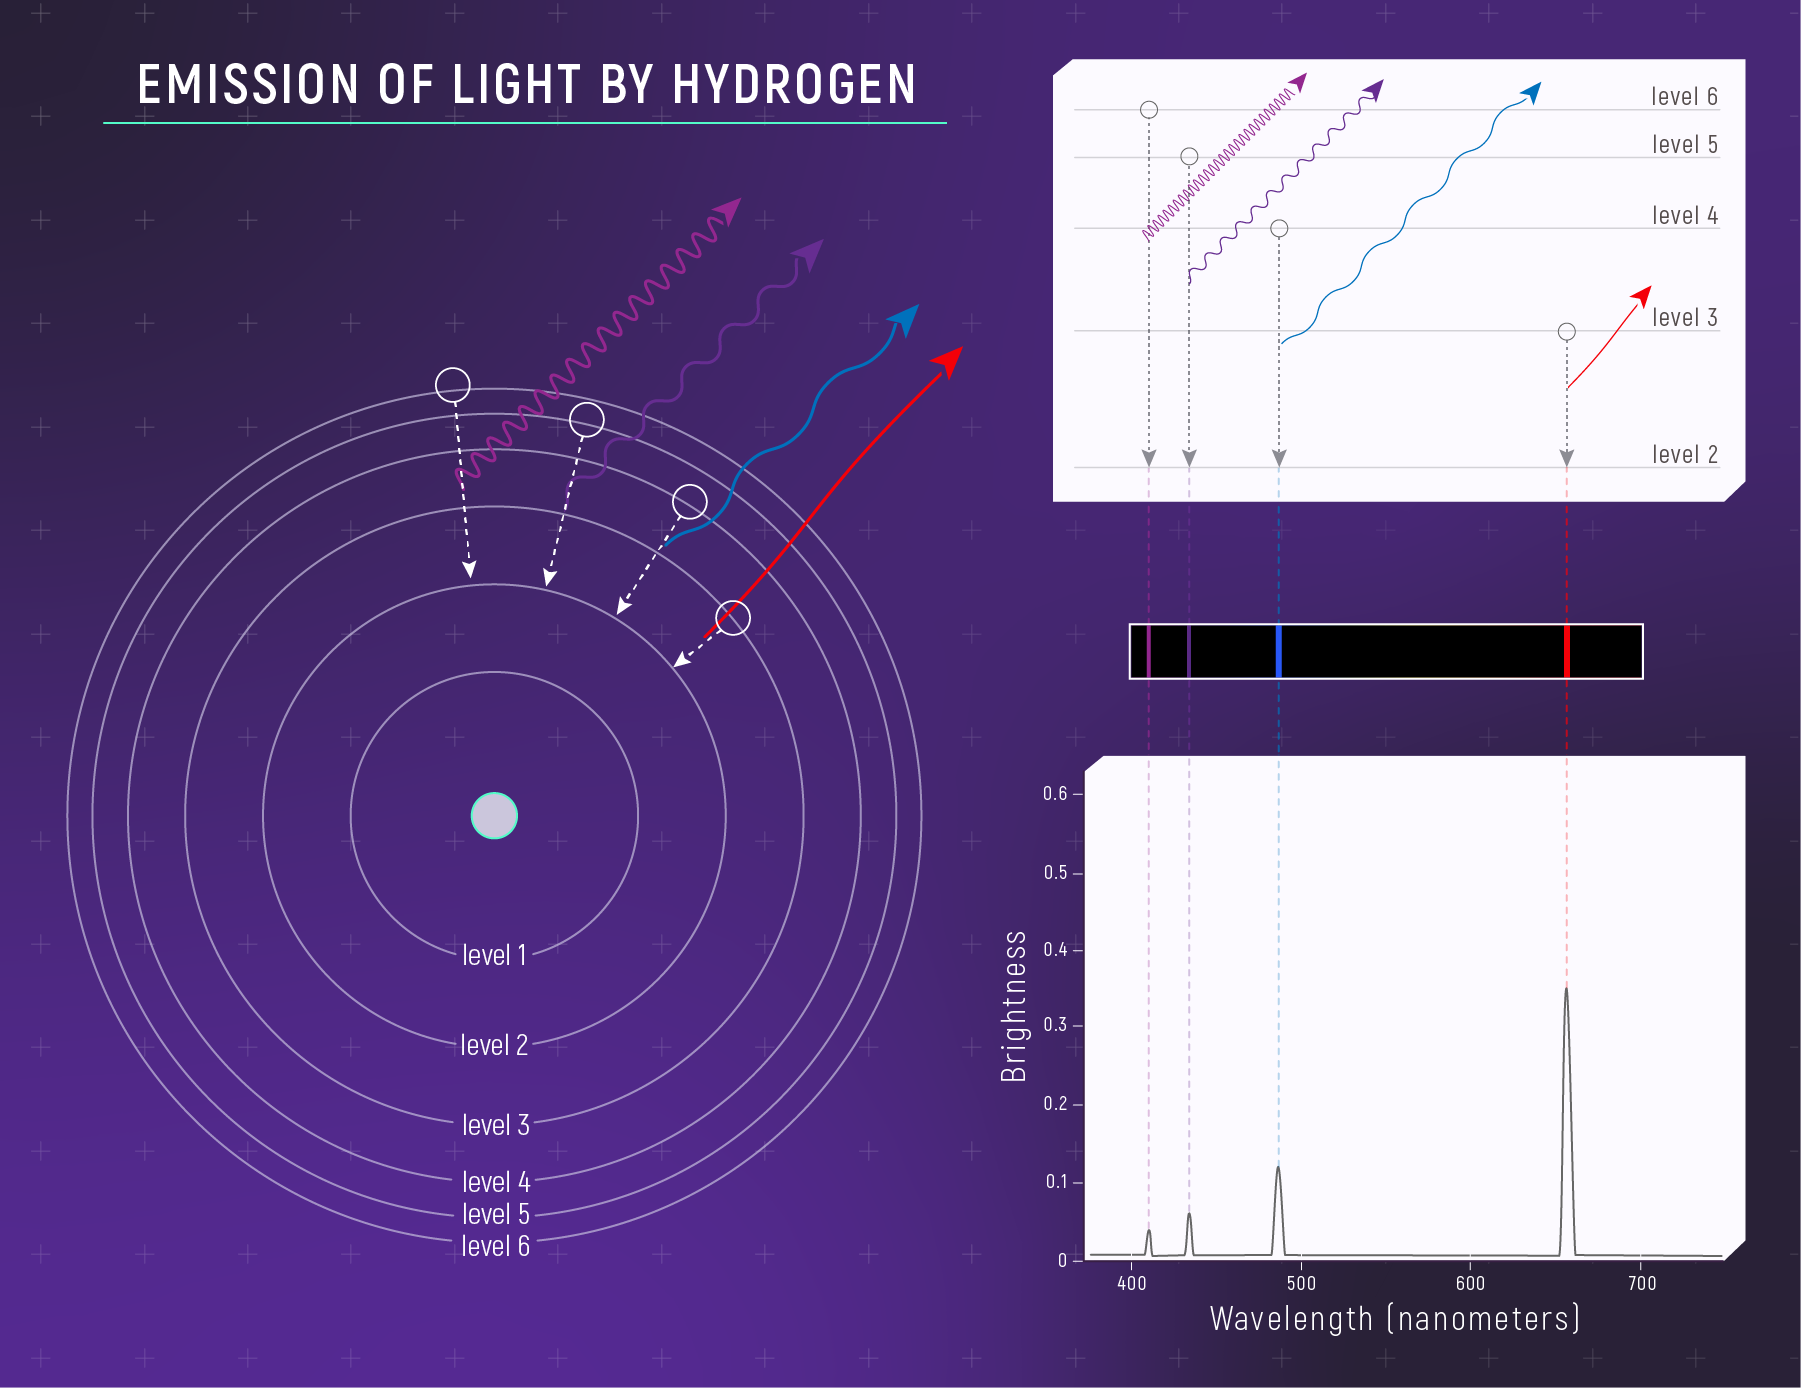
When an electron changes levels, the atom absorbs or emits a photon whose energy matches the difference:
An absorption line appears when photons of a particular energy are removed because electrons jump up; an emission line appears when a thin gas produces photons as electrons fall down.
Kirchhoff’s Laws: Three Types of Spectra
Kirchhoff's laws
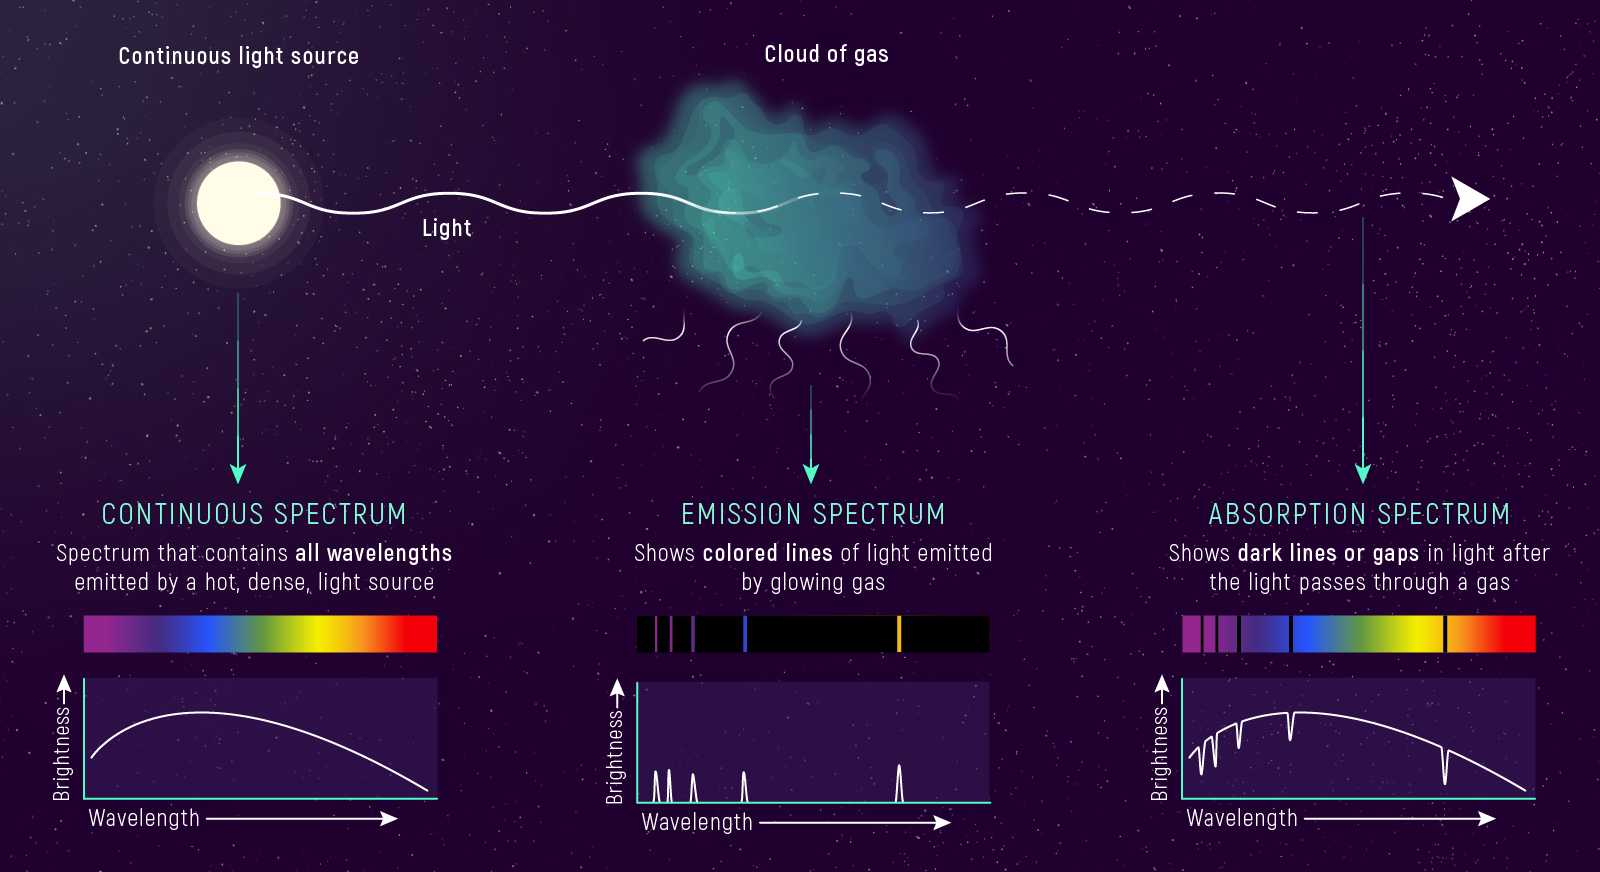
Three rules linking a spectrum’s appearance to its source: (1) a hot dense object gives a continuous spectrum; (2) a hot thin gas gives an emission-line spectrum; (3) cool gas in front of a hot continuous source gives an absorption-line spectrum.
A
Continuous spectrum
A smooth spectrum spanning all wavelengths, with no lines — emitted by a hot, dense (blackbody-like) source such as a stellar interior.
Absorption spectrum
A continuous spectrum crossed by dark lines, produced when cooler gas in front of a hot continuous source removes photons at its characteristic wavelengths. Stellar spectra are absorption spectra.
Emission spectrum
Bright lines on a dark background, produced by a hot, thin gas with no bright continuum behind it — for example, an emission nebula.
Spectral lines reveal more than composition: which transitions are populated gives temperature; Doppler shifts give velocity; line widths give density/pressure — all developed in Module 2.
In an absorption spectrum, where must the absorbing gas be located relative to the bright source — and why does it produce dark lines rather than bright ones?
The cooler gas must lie in front of the hot continuous source along the line of sight. It removes photons at its characteristic wavelengths (electrons jumping up), leaving dark notches in the otherwise-continuous spectrum.