Light as Information
Complete lesson
Light as Evidence
After completing this reading, you will be able to:
By the end of this reading you’ll be able to: use the continuum shape to infer temperature; use absorption and emission lines to infer composition; use line shifts to infer line-of-sight motion; and use telescope scalings to infer faintness reach and angular detail.
Part 1: Why Light Matters
Look up on a clear night. Every point of light you see is a message from across space and time. But what does that message contain?
In Lecture 1 we learned that astronomers can directly measure only four things: brightness, position, wavelength, and timing. Everything else — temperature, mass, radius, age, composition — must be inferred. Today we begin building the inference toolkit, starting with the question: what can we learn from a star’s color?
The answer involves one of the most important developments in physics: the birth of quantum mechanics. Max Planck’s attempt to explain how hot objects glow led to a revolution that reshaped our understanding of the universe — and the equation he derived, the Planck function, remains the foundation of stellar astrophysics. By the end of this reading you’ll be able to look at a star and estimate its surface temperature from its color, understand why hot stars are blue and cool stars are red, and have your first encounter with a professional-grade physics equation, along with strategies for making such equations less intimidating.
The Electromagnetic Spectrum
Part 2: The Electromagnetic Spectrum
Unit convention: we use CGS units throughout (cm, s, erg, K). For convenience, optical/UV wavelengths are often written in nm, where .
Light as a Wave
Light is an electromagnetic wave — oscillating electric and magnetic fields that propagate through space at a constant speed.
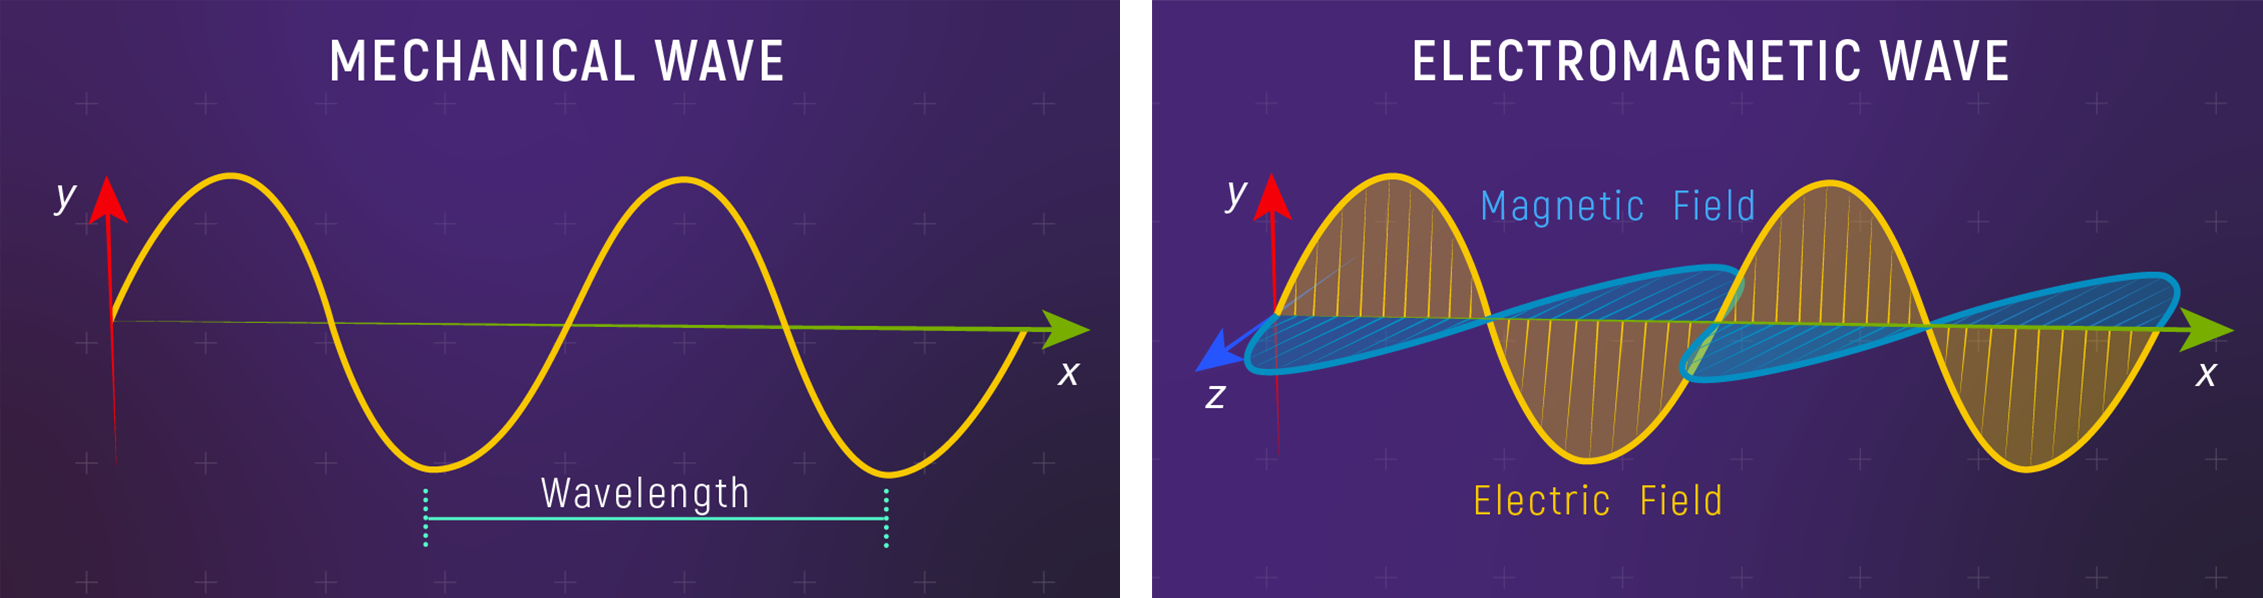
Unlike mechanical waves (water ripples, sound, a vibrating string), electromagnetic waves don’t need a medium. A water wave is the water moving up and down; a sound wave is air molecules compressing and expanding. But light travels perfectly well through the vacuum of space — what’s oscillating are the electric and magnetic fields themselves.
Both wave types share the same vocabulary:
- Wavelength (): the distance between successive crests. For light, wavelengths range from kilometers (radio) down to sub-atomic scales (gamma rays).
- Frequency (): the number of oscillations per second, in s (Hertz, Hz).
- Speed (): in vacuum, all electromagnetic waves travel at .
Nanometer
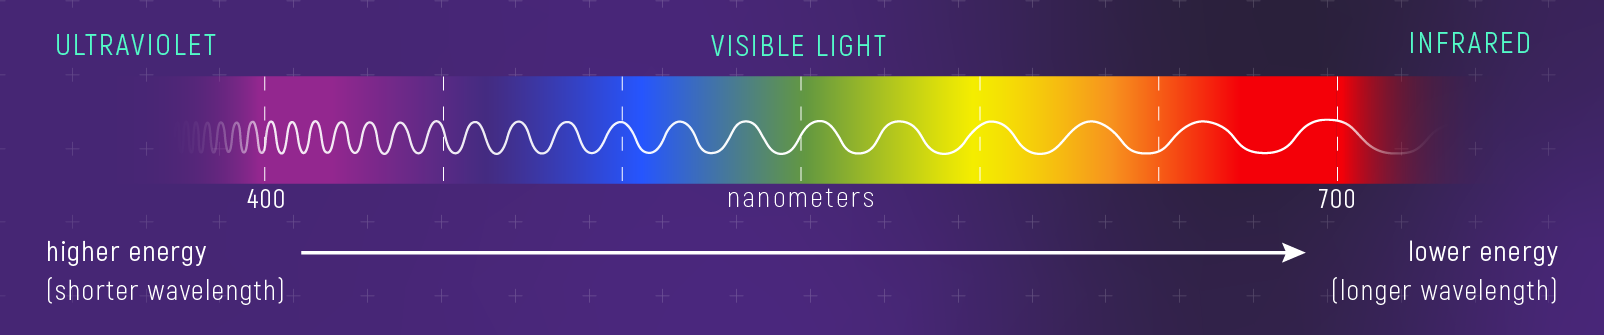
A unit of length, — roughly ten hydrogen-atom diameters, and the natural unit for optical and UV light. Visible light spans about 400-700 nm.
Optical and UV wavelengths are often written in
All EM waves travel at the same speed in vacuum; they differ only in how they trade off wavelength against frequency. Since is constant, the two are inversely related, : long wavelength means low frequency, short wavelength means high frequency.
Problem
Using : (1) if wavelength doubles, frequency does what? (2) If frequency triples, wavelength does what? (3) Radio waves have cm; visible light cm. How do their frequencies compare?
- Halves — frequency is inversely proportional to wavelength.
- Drops to one-third — same inverse relationship.
- Visible light has higher frequency, because its wavelength is shorter.
The Spectrum: From Radio to Gamma
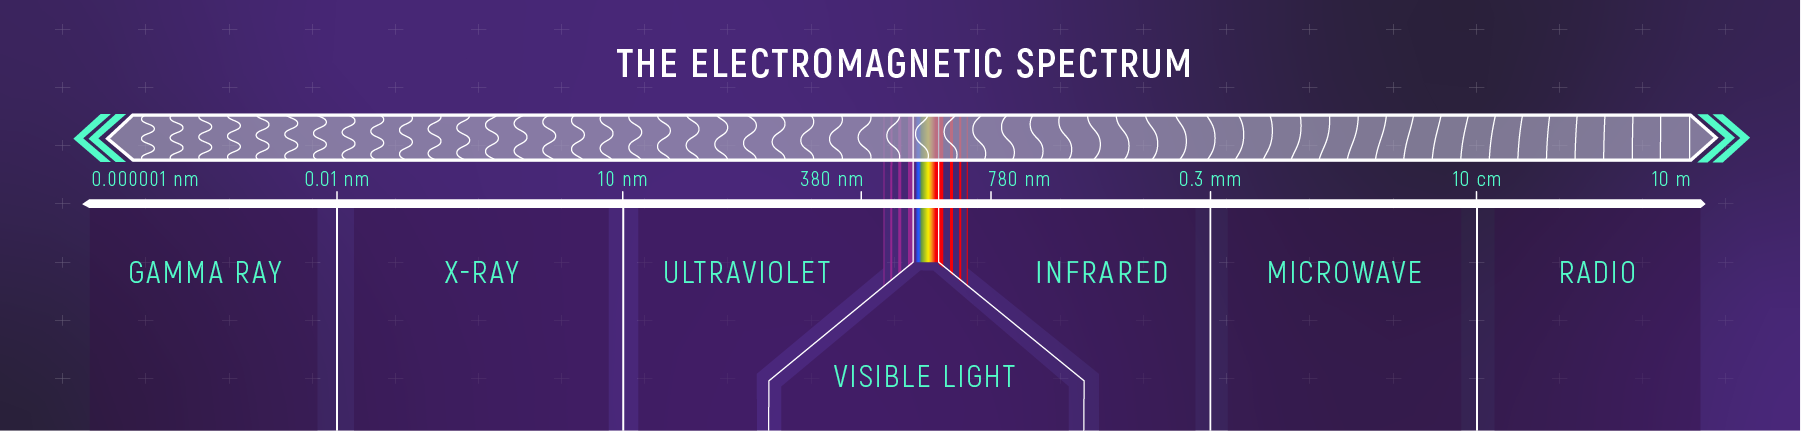
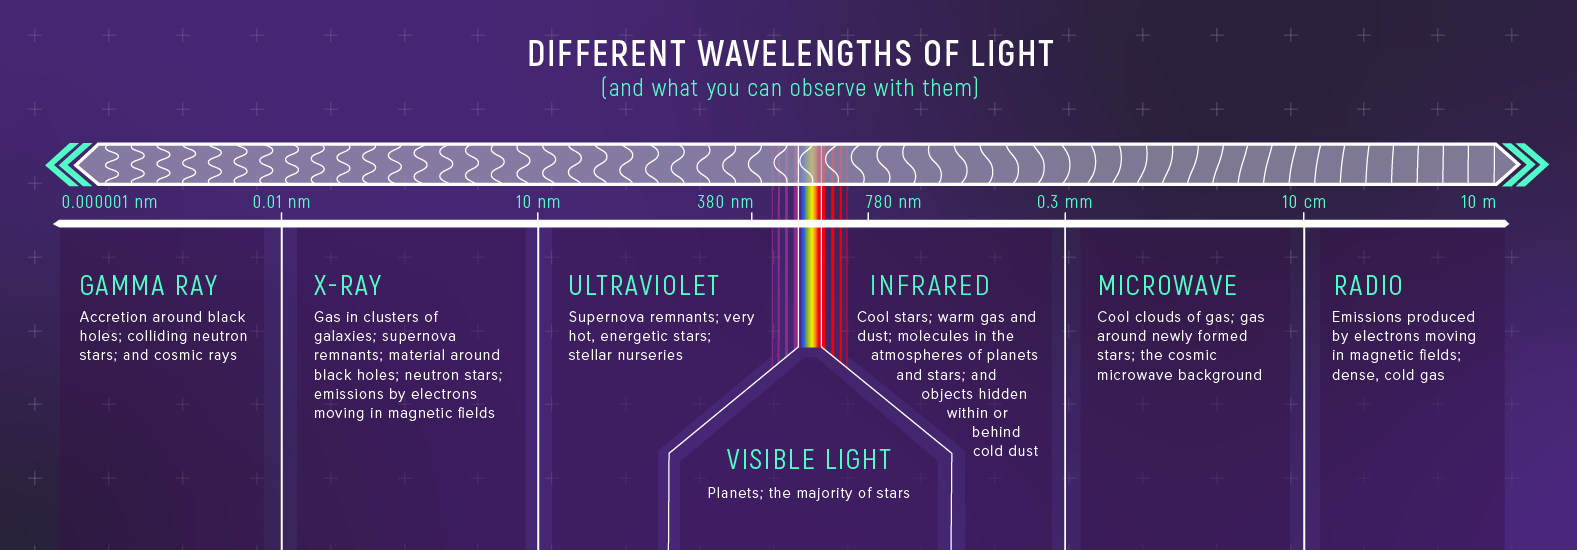
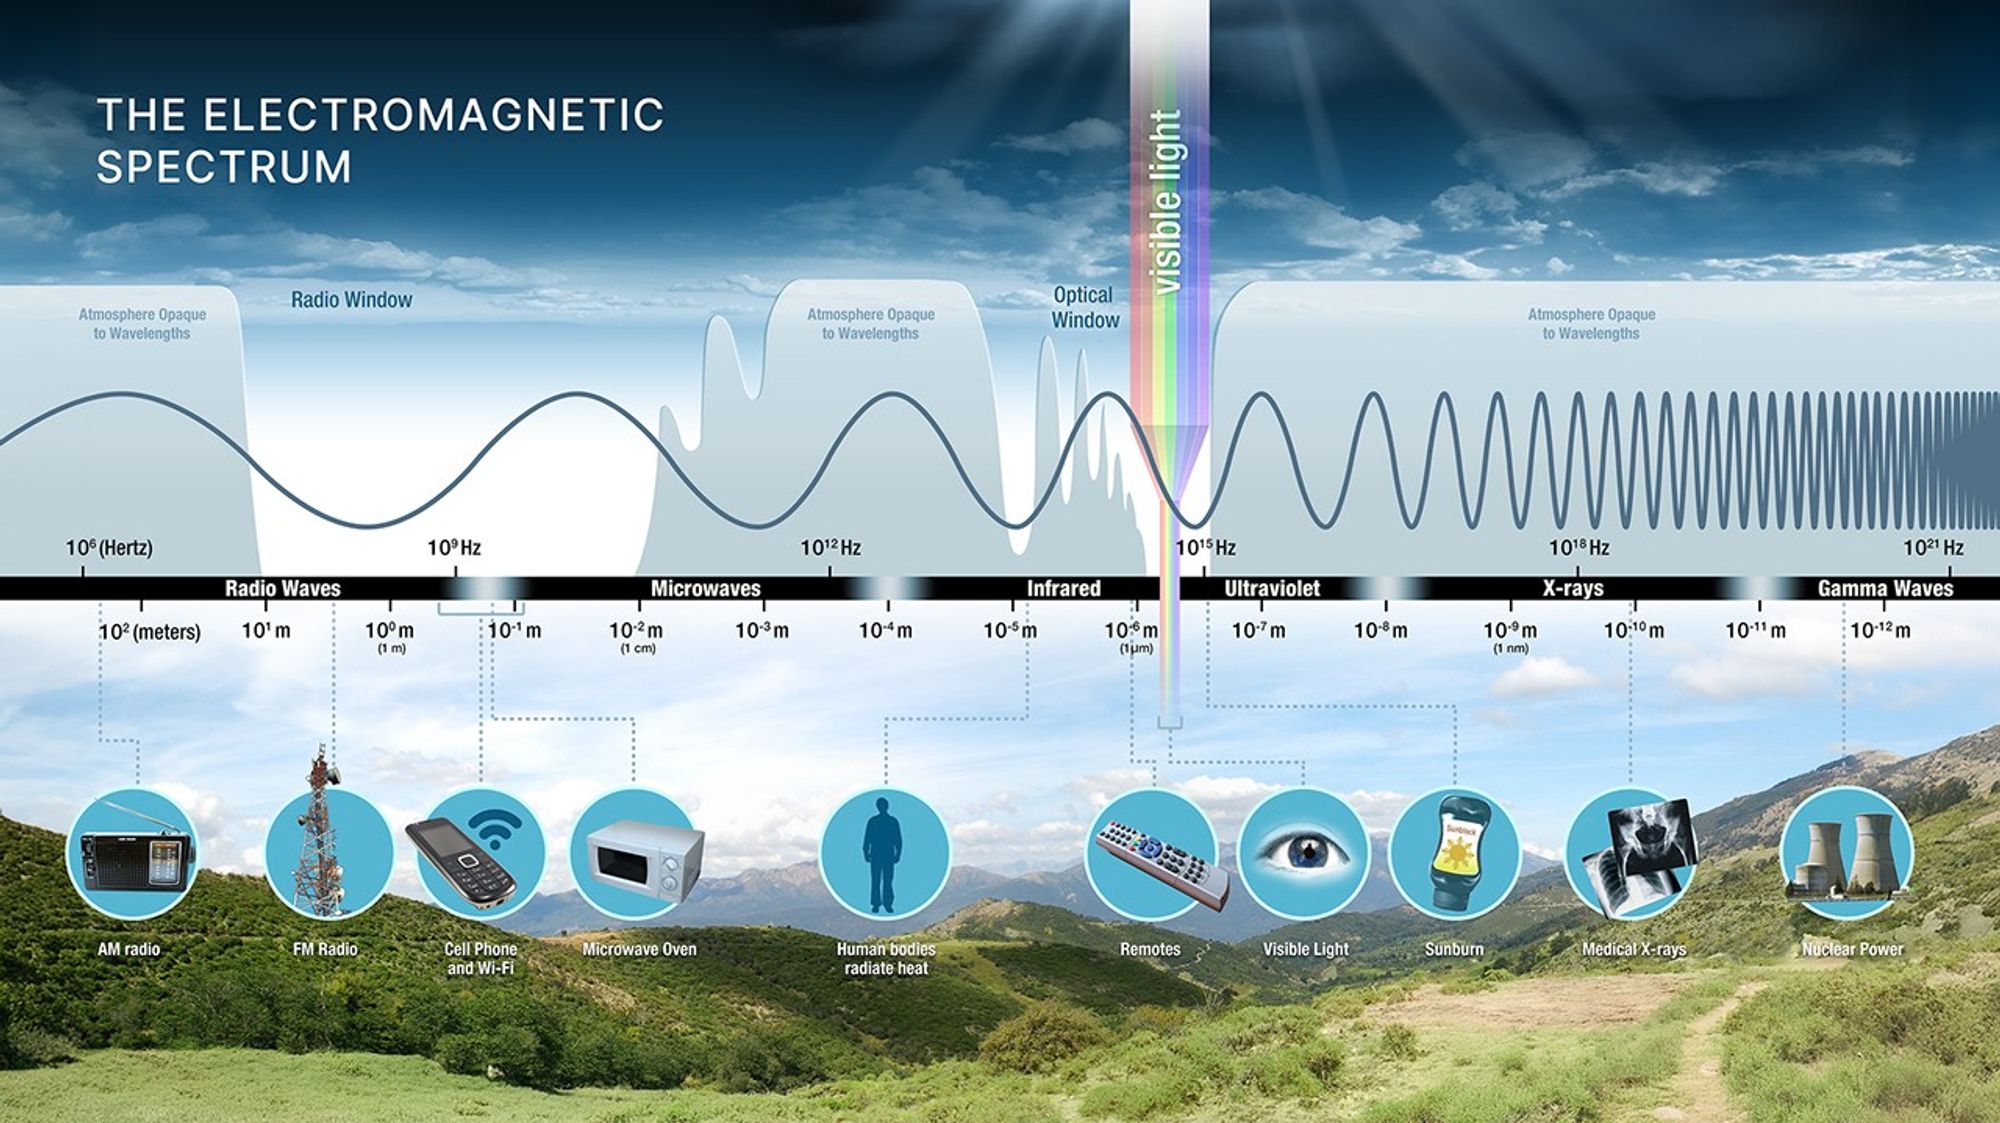
The electromagnetic spectrum spans an enormous range of wavelengths, divided into named bands:
| Band | Wavelength Range | What It Reveals |
|---|---|---|
| Radio | cm | Cold gas, magnetic fields, pulsars |
| Microwave | – cm | CMB, molecular clouds |
| Infrared | nm– cm | Warm dust, cool stars, exoplanets |
| Visible | – nm | Stellar surfaces, nebulae |
| Ultraviolet | – nm | Hot stars, active galactic nuclei |
| X-ray | – nm | Million-degree plasma, accretion disks |
| Gamma | shorter than nm | Extreme events: supernovae, GRBs |
Key insight: different wavelengths reveal different physics. A galaxy looks completely different in radio versus X-rays because you’re seeing different physical components — cold gas versus hot plasma. This is why astronomers build telescopes for every part of the spectrum.
Light as Particles: Photon Energy
Light also behaves as particles called photons. Each photon carries a discrete amount of energy:
Here erg·s is Planck’s constant. The energy depends on either frequency or wavelength (they’re linked by ). The story: — shorter wavelength means higher energy, which is why gamma rays can damage DNA while radio waves pass harmlessly through your body.
Problem
Using : (1) if wavelength doubles, photon energy does what? (2) If wavelength is halved? (3) A 200 nm photon versus an 800 nm photon — how do their energies compare?
- Halves — energy is inversely proportional to wavelength.
- Doubles — halving doubles .
- The 200 nm photon has more energy (). This is why UV causes sunburns but red light doesn’t.
Pause & Predict
Same atmosphere, same sunlight - what's different? Commit to a guess before Part 3.
Part 3 answers this with Rayleigh scattering.
Light-Matter Interactions
Part 3: How Light Interacts with Matter
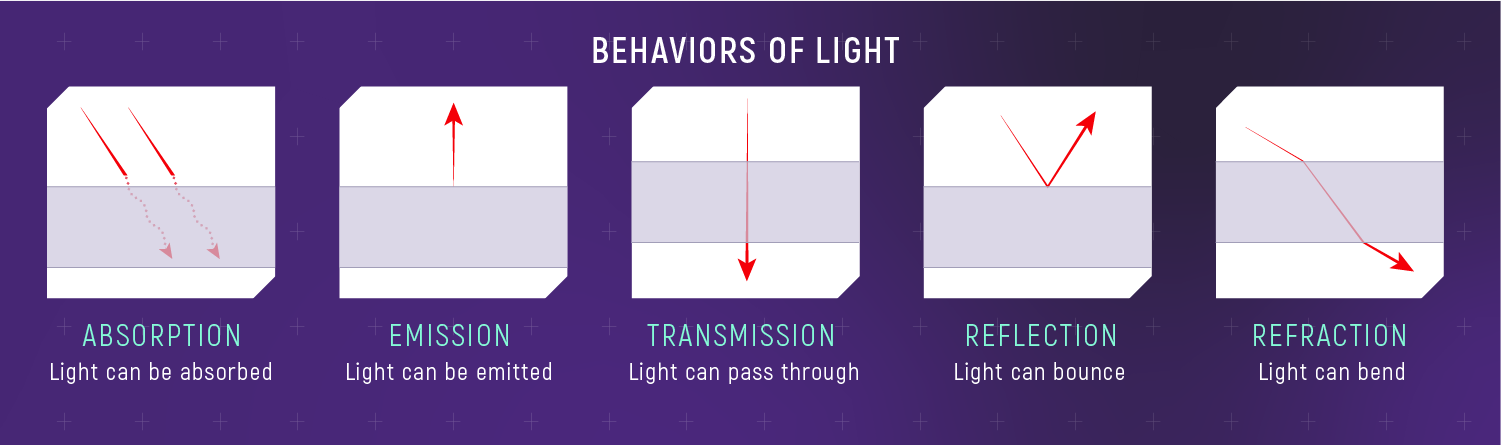
Light carries information because it doesn’t just travel — it interacts. The fundamental interactions are absorption, emission, and scattering; at a boundary we also describe transmission (it gets through), reflection (it bounces), and refraction (it bends). Every spectrum you will ever interpret is some combination of these.
- Absorption: a photon is destroyed and its energy goes into the material (heat, or exciting an electron). Absorption is selective — that selectivity turns a smooth spectrum into one with informative “missing” wavelengths.
- Emission: matter loses energy by creating a photon. What sets the photon’s wavelength is the energy the material loses — which is why atoms produce lines at specific wavelengths.
- Transmission: light passes through without being absorbed. Glass transmits visible but absorbs UV; Earth’s atmosphere transmits visible and radio but absorbs most X-rays.
- Reflection: light bouncing off a surface. The fraction reflected (the
albedo - Refraction: bending as light crosses between media. Lenses focus by refraction; atmospheric refraction makes stars twinkle. It is wavelength-dependent — blue bends more than red, which is why prisms spread white light.
Albedo
The fraction of incident light a surface reflects. A bright icy moon has high albedo; dark rock has low albedo. It encodes information about surface composition and texture.
Scattering: Blue Skies and Red Sunsets
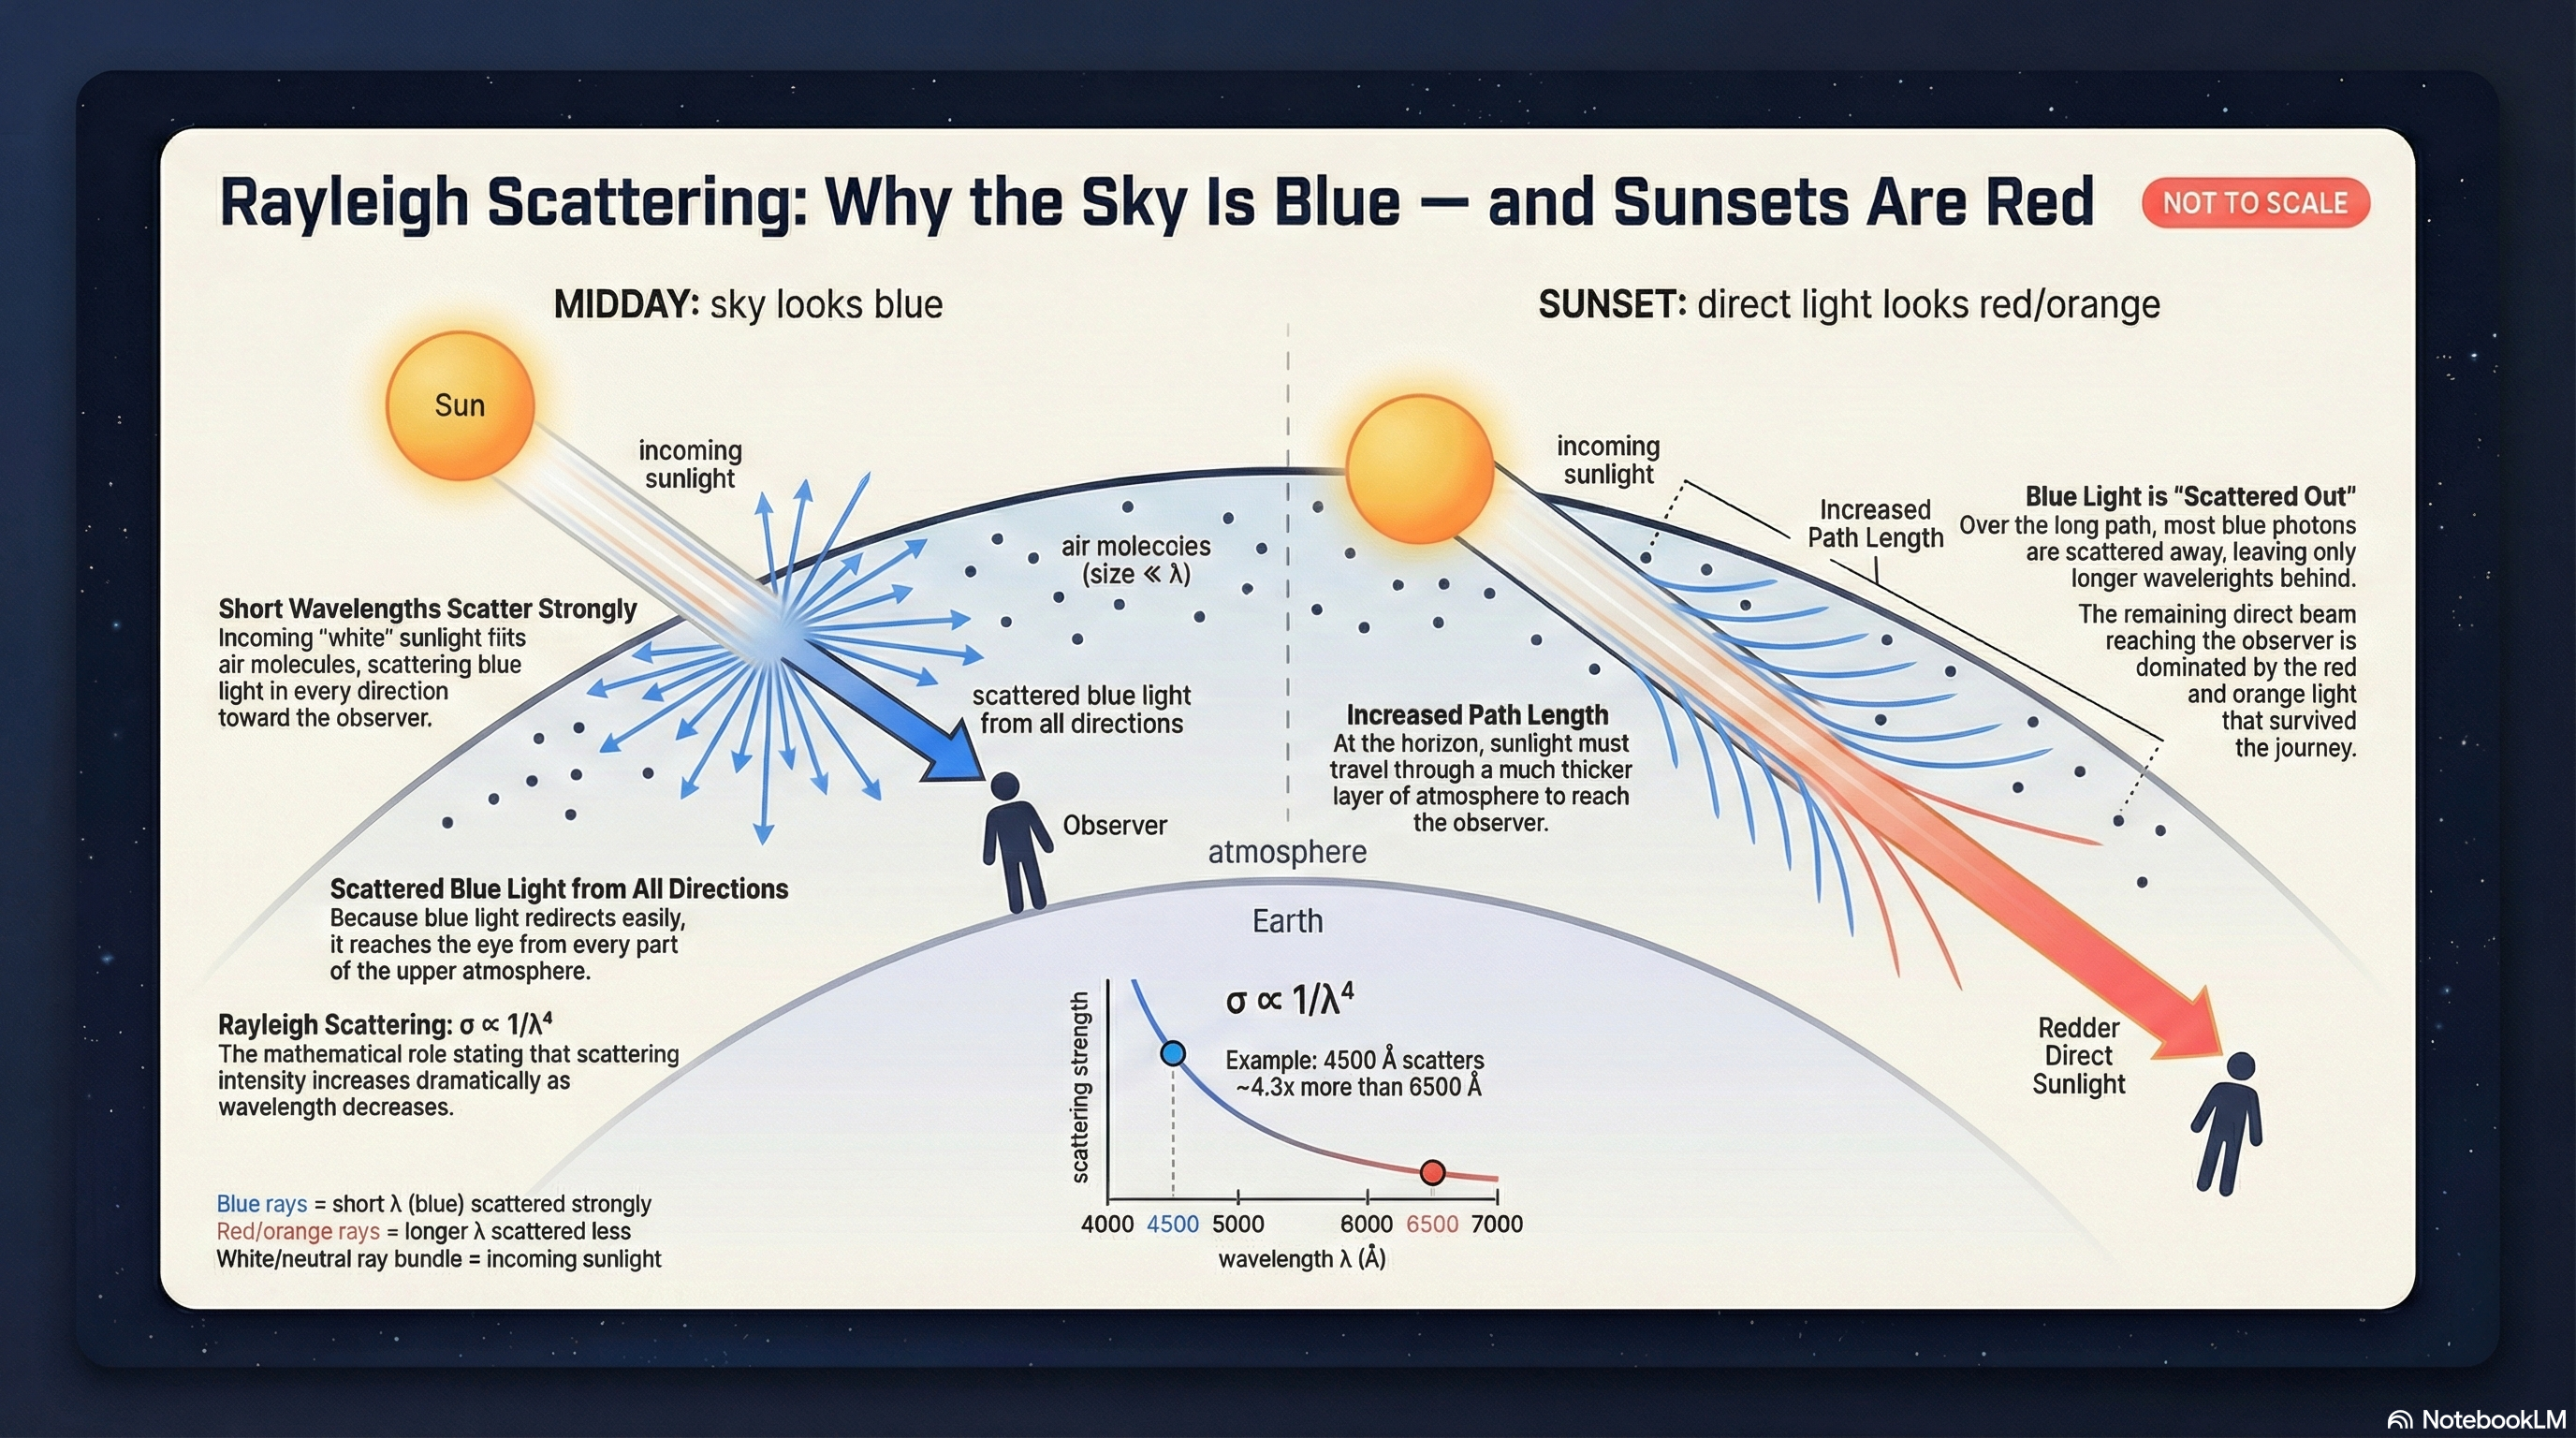
Scattering redirects light into new directions. When the scattering particles are much smaller than the wavelength (like air molecules), we get
Rayleigh scattering
Scattering of light by particles much smaller than its wavelength, with a steep dependence. It makes the daytime sky blue, sunsets red, and reddens starlight passing through interstellar dust.
The dependence is steep: blue light ( nm) scatters about times more than red ( nm), so .
Why the sky is blue: sunlight enters the atmosphere and meets countless N and O molecules. Short wavelengths scatter strongly in all directions, so when you look away from the Sun, much of what you see is scattered blue light arriving from all over the sky. Why sunsets are red: at sunset, light travels through much more atmosphere; along that long path the blue is preferentially scattered out of the direct beam, so the light that continues forward is redder. Same physics, different geometry.
Opacity and How Far Light Gets
Often we care less about “what is this made of?” than “how far can photons travel before being absorbed or scattered?” That idea is captured by
Opacity
A measure of how strongly matter absorbs or scatters light at a given wavelength. High opacity means light is blocked over a short distance. It is strongly wavelength-dependent — a cloud can be transparent in the optical but opaque in the UV.
You observe two identical stars — one nearby, one far away behind interstellar dust. Which appears redder, and why?
The distant star behind the dust. Dust scatters and removes short (blue) wavelengths more efficiently than long (red) ones, so the transmitted light is reddened — the same physics as the blue sky and red sunset.
Blackbody Radiation
Part 4: Blackbody Radiation
What Is a Blackbody?
A
Blackbody
An idealized perfect absorber and emitter: it absorbs all incident radiation and, when heated, emits a spectrum (the Planck curve) that depends only on its temperature . Stars are approximate blackbodies.
Stars are approximate blackbodies — their spectra deviate due to absorption lines, but the overall shape follows the blackbody curve. Other astronomical blackbodies: planets (Earth emits as a K blackbody in the infrared), the Cosmic Microwave Background (the most perfect blackbody ever measured, at 2.725 K), and accretion disks around black holes.
The Planck Spectrum: Qualitative Picture
When you heat an object it glows, and the color depends on temperature: a stovetop burner dull red (700 K), an incandescent filament yellow-white (2700 K), the Sun yellow (5800 K), a welding arc blue-white (6000+ K).
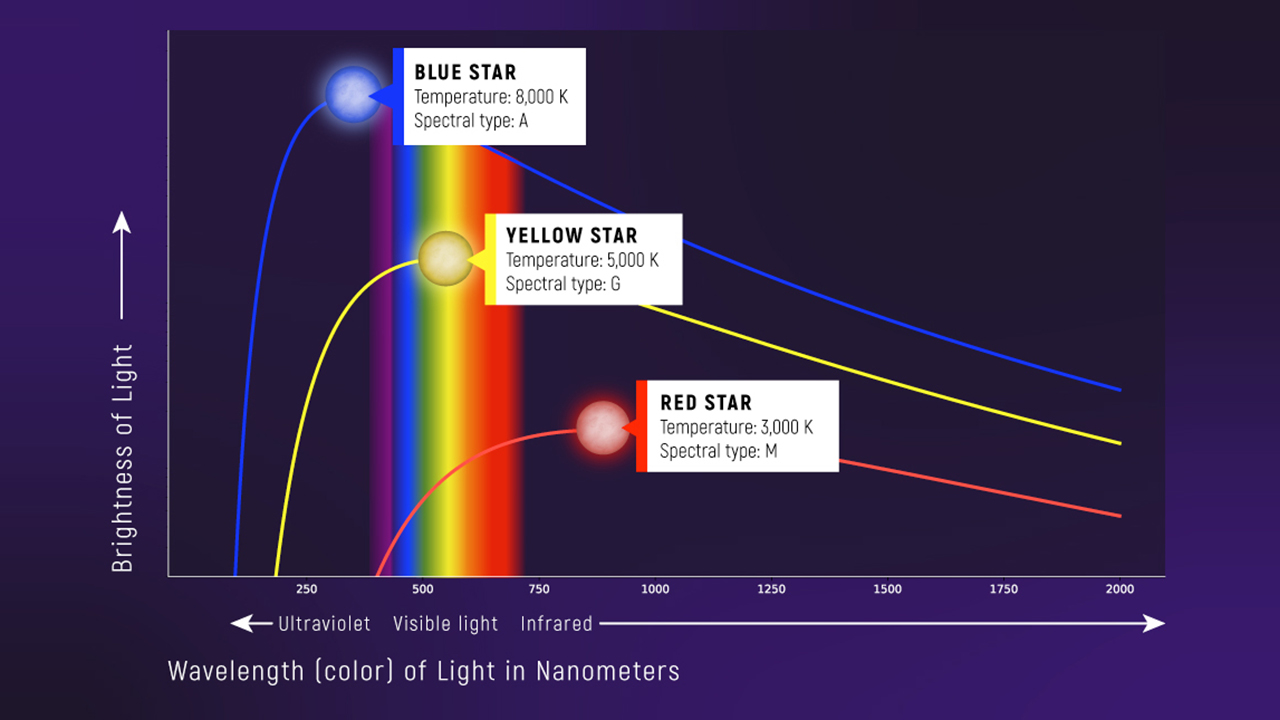
The blackbody spectra (Planck curves) show two patterns: (1) the peak shifts to shorter wavelengths as temperature increases — hot objects peak in the blue/UV, cool objects in the red/IR; (2) the total energy emitted increases dramatically with temperature — the area under the curve grows as (the Stefan-Boltzmann law, quantified in Module 2).
Pause & Predict #1
Think about the shape of the Planck curve, not just the peak location.
Check your reasoning against the answers below.
Multiple choice
An 8000 K star peaks in the ultraviolet, yet it still looks blue to your eyes (not invisible). Why?
Blue star: the Planck curve is broad, not a spike. Even with its peak in the UV, the star emits plenty of visible light — and more blue than red (blue is closer to the UV peak). Our eyes integrate this imbalance and perceive blue.
Red star: the same in reverse. It emits across a broad range including visible light, but more red than blue. The key insight: blackbodies emit at all wavelengths; the peak only tells you where emission is strongest. Color perception depends on the ratio of blue to red light.
The Ultraviolet Catastrophe
Before 1900, classical physics gave the Rayleigh-Jeans law, . It works at long wavelengths, but as the intensity diverges — classical physics predicted any warm object should emit infinite energy in the ultraviolet. This ultraviolet catastrophe was a fundamental failure: ovens don’t emit infinite UV.
Planck’s Quantum Solution
In 1900 Max Planck found the fix — “an act of desperation.” He proposed that energy is emitted in discrete packets (quanta) with energy . To emit a short-wavelength (high-frequency) photon, an oscillator needs energy ; if the available thermal energy () is less than , emission is suppressed — you can’t emit a fraction of a photon. This quantum suppression cuts off the catastrophe. It took Einstein (1905) to take quanta seriously, showing light itself comes in photons.
The Planck Function: Meeting a Real Equation
The complete blackbody spectrum is the Planck function. It looks intimidating — don’t panic; we read it piece by piece.
is the spectral radiance — power emitted per unit area, per unit solid angle, per unit wavelength. The factor would drive short wavelengths up, but the exponential term in the denominator suppresses them; the competition between the two creates the peak. You don’t need to compute it from scratch — you need to recognize its shape and know which term controls which regime.
Spectral radiance
The power a surface emits per unit area, per unit solid angle (“per direction”), per unit wavelength interval — what the Planck function gives. CGS units: .
The
Limiting Cases: Taming Complex Equations
The way to not be intimidated by a scary equation is to take its limiting cases — what happens when one term dominates.
Case 1 — long wavelengths (Rayleigh-Jeans). When , expand , so
Classical physics works here because quantum effects are negligible when .
Case 2 — short wavelengths (Wien tail). When , the is negligible and
The exponential cuts off short-wavelength emission — the quantum suppression that prevents the catastrophe. You can’t emit photons whose energy exceeds the available thermal energy.
| Regime | Condition | Behavior | Physical reason |
|---|---|---|---|
| Long | Classical limit; photons are “cheap” | ||
| Short | exponentially | Quantum suppression; photons are “expensive” |
Problem
Using : (1) if doubles (fixed ), intensity does what? (2) If doubles (fixed )? (3) Two blackbodies at the same , one at cm and one at cm — how do their Rayleigh-Jeans intensities compare?
- Doubles — intensity is linear in .
- Drops by — the dependence is steep.
- The shorter wavelength is brighter — exactly the runaway that gave the “ultraviolet catastrophe.”
Wien's Displacement Law
Part 5: Wien’s Displacement Law
The Peak Wavelength
The Planck function peaks at a wavelength that depends only on temperature:
Here is Wien’s displacement constant, and “peak wavelength” means the maximum of (per unit wavelength). The story: — hotter objects peak bluer, cooler objects redder. This is why color encodes temperature.
Problem
Using : (1) if doubles, does what? (2) If halves? (3) Star A at 6000 K versus Star B at 3000 K — how do their peaks compare?
- Halves — peak wavelength is inversely proportional to temperature.
- Doubles — cooler means a longer peak wavelength.
- Star B peaks at the wavelength of Star A. If A peaks at 500 nm (green), B peaks at 1000 nm (infrared) — why hot stars are blue and cool stars red.
Problem
The Sun’s spectrum peaks at approximately 500 nm (green-yellow). What is its surface temperature?
StepInvert Wien's law
Dimensional check
✓ (using nm·K / nm consistently).
Result
About 5800 K — determined from the color of sunlight alone, no thermometer and no spacecraft. This is astronomical inference in action.
Problem
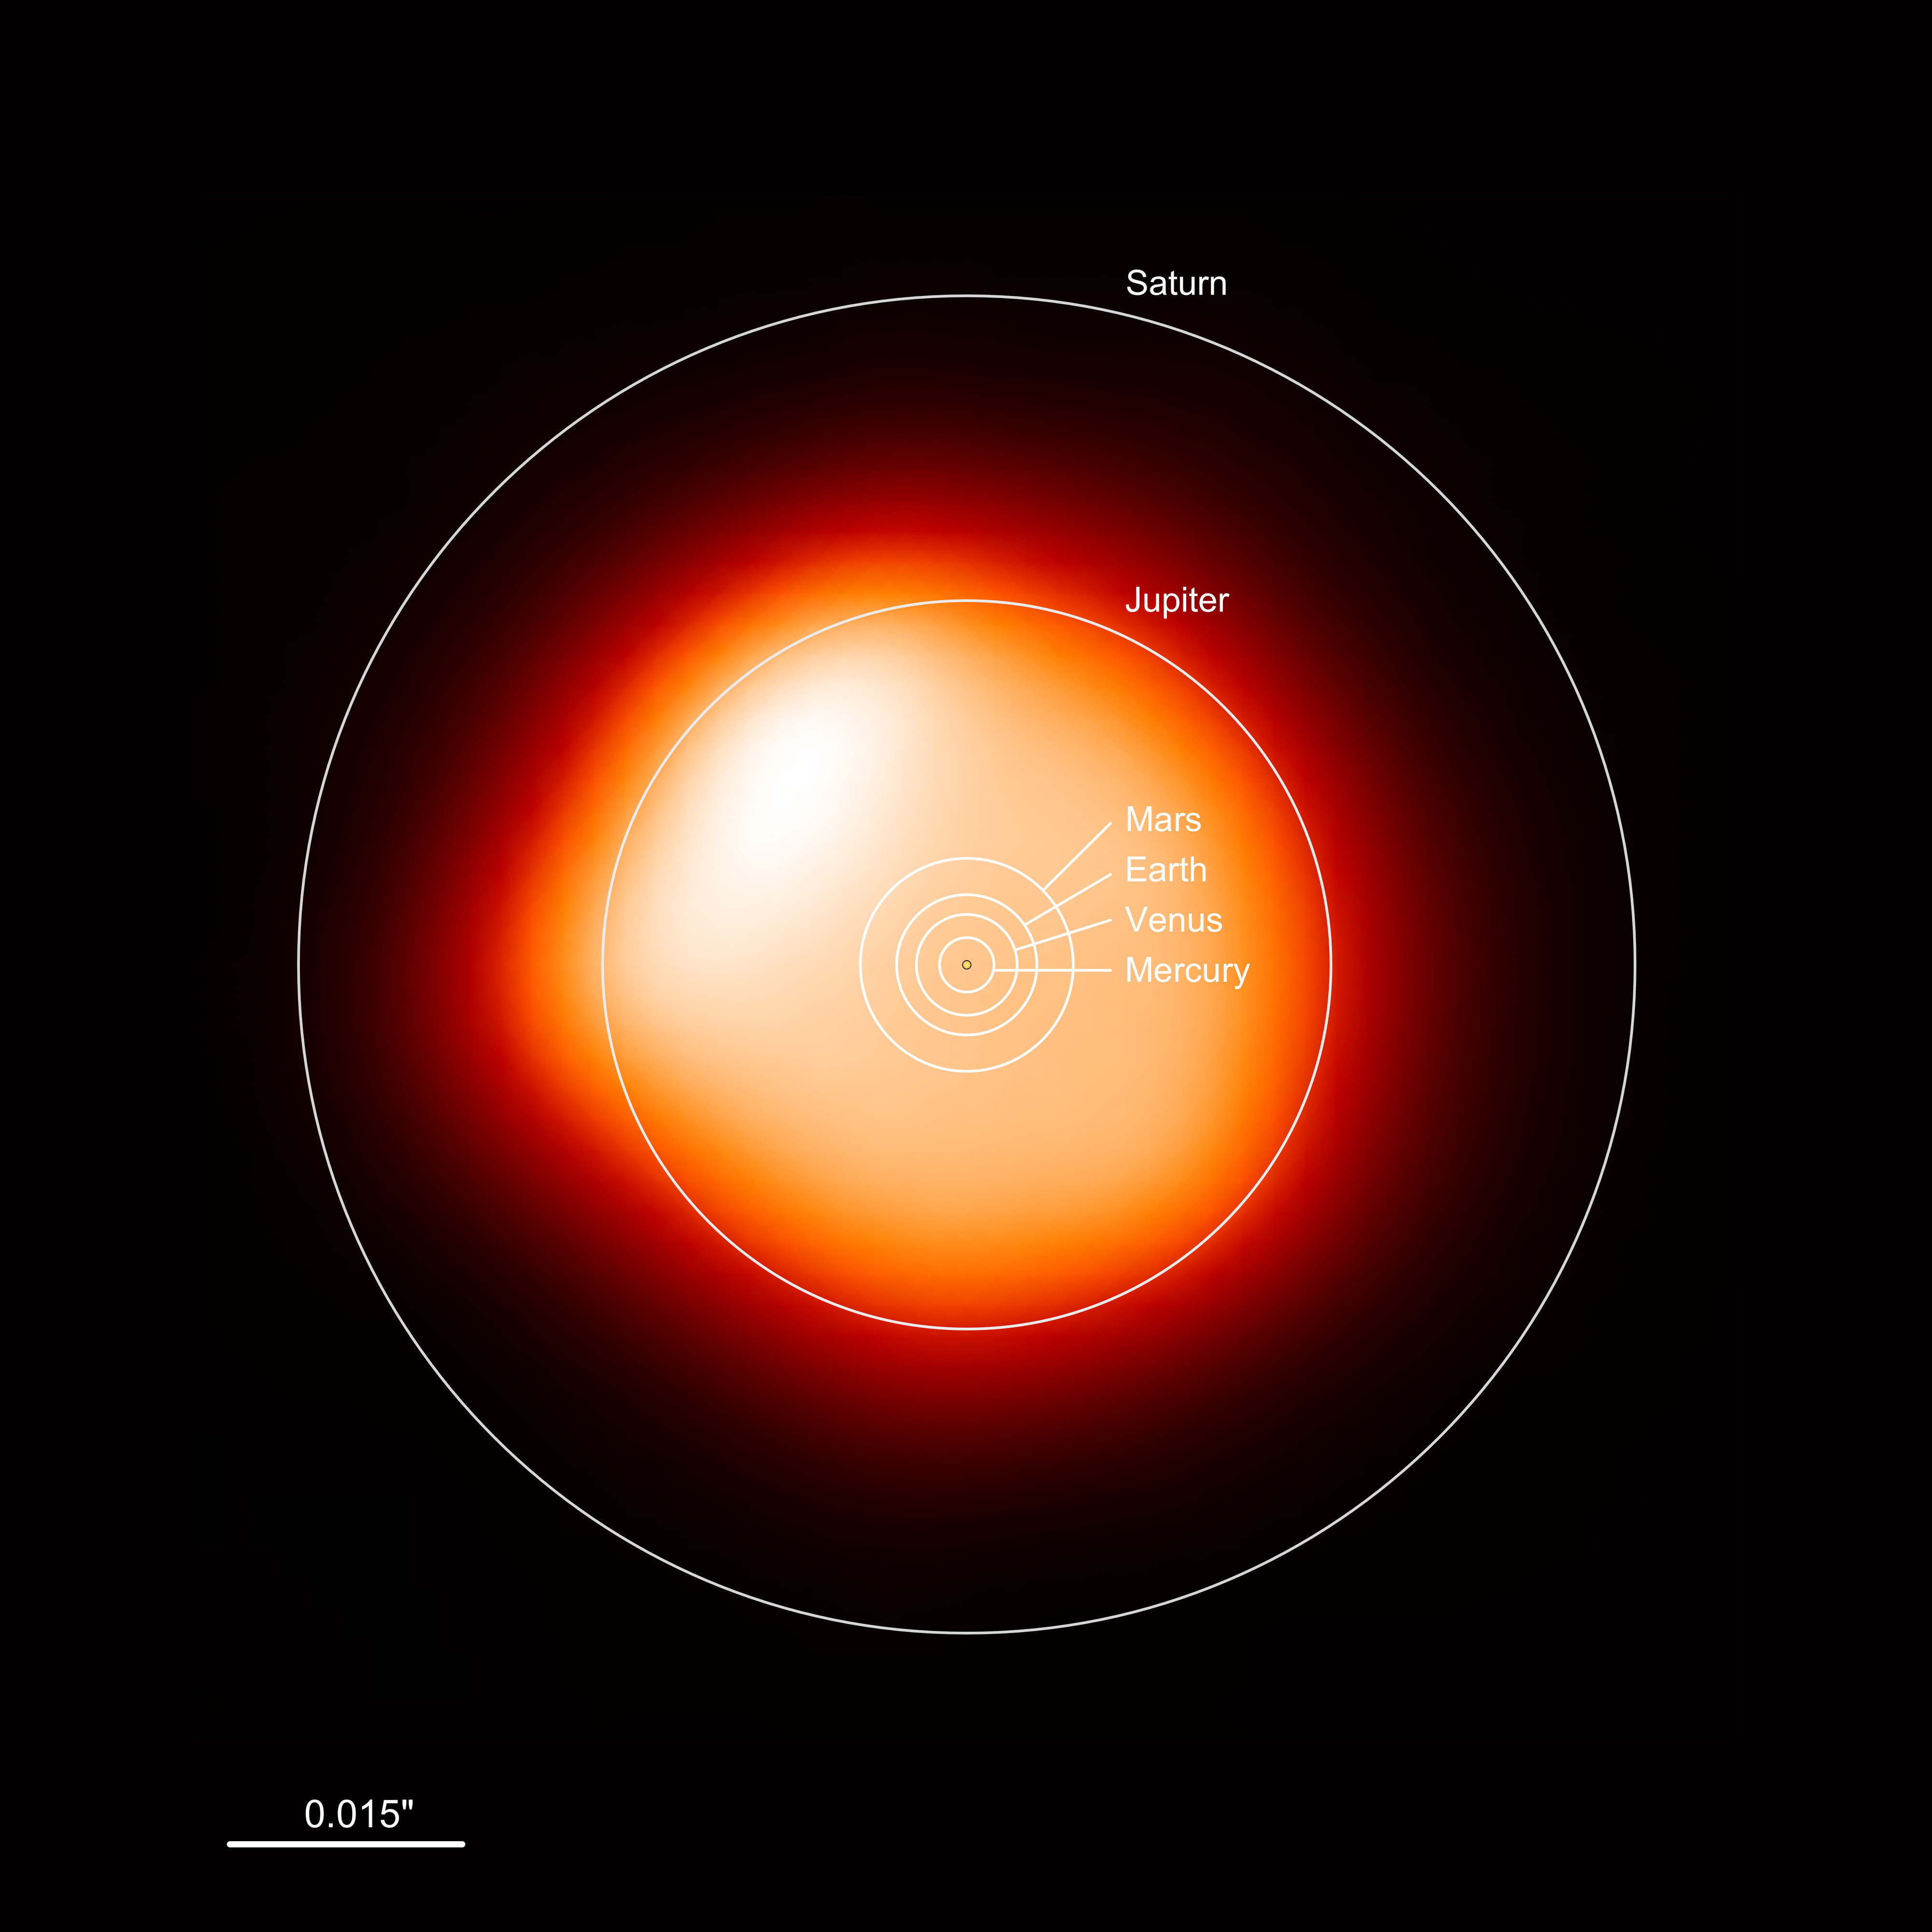
Betelgeuse (a red supergiant) peaks near 830 nm; Rigel (a blue supergiant) peaks near 240 nm. Find their surface temperatures.
StepApply Wien's law to each
Dimensional check
nm·K divided by nm leaves K ✓ — a temperature, as required.
Result
Rigel is about hotter than Betelgeuse. In Orion you’re literally seeing temperature as color: the red shoulder (Betelgeuse) is cool, the blue foot (Rigel) is hot.
Problem
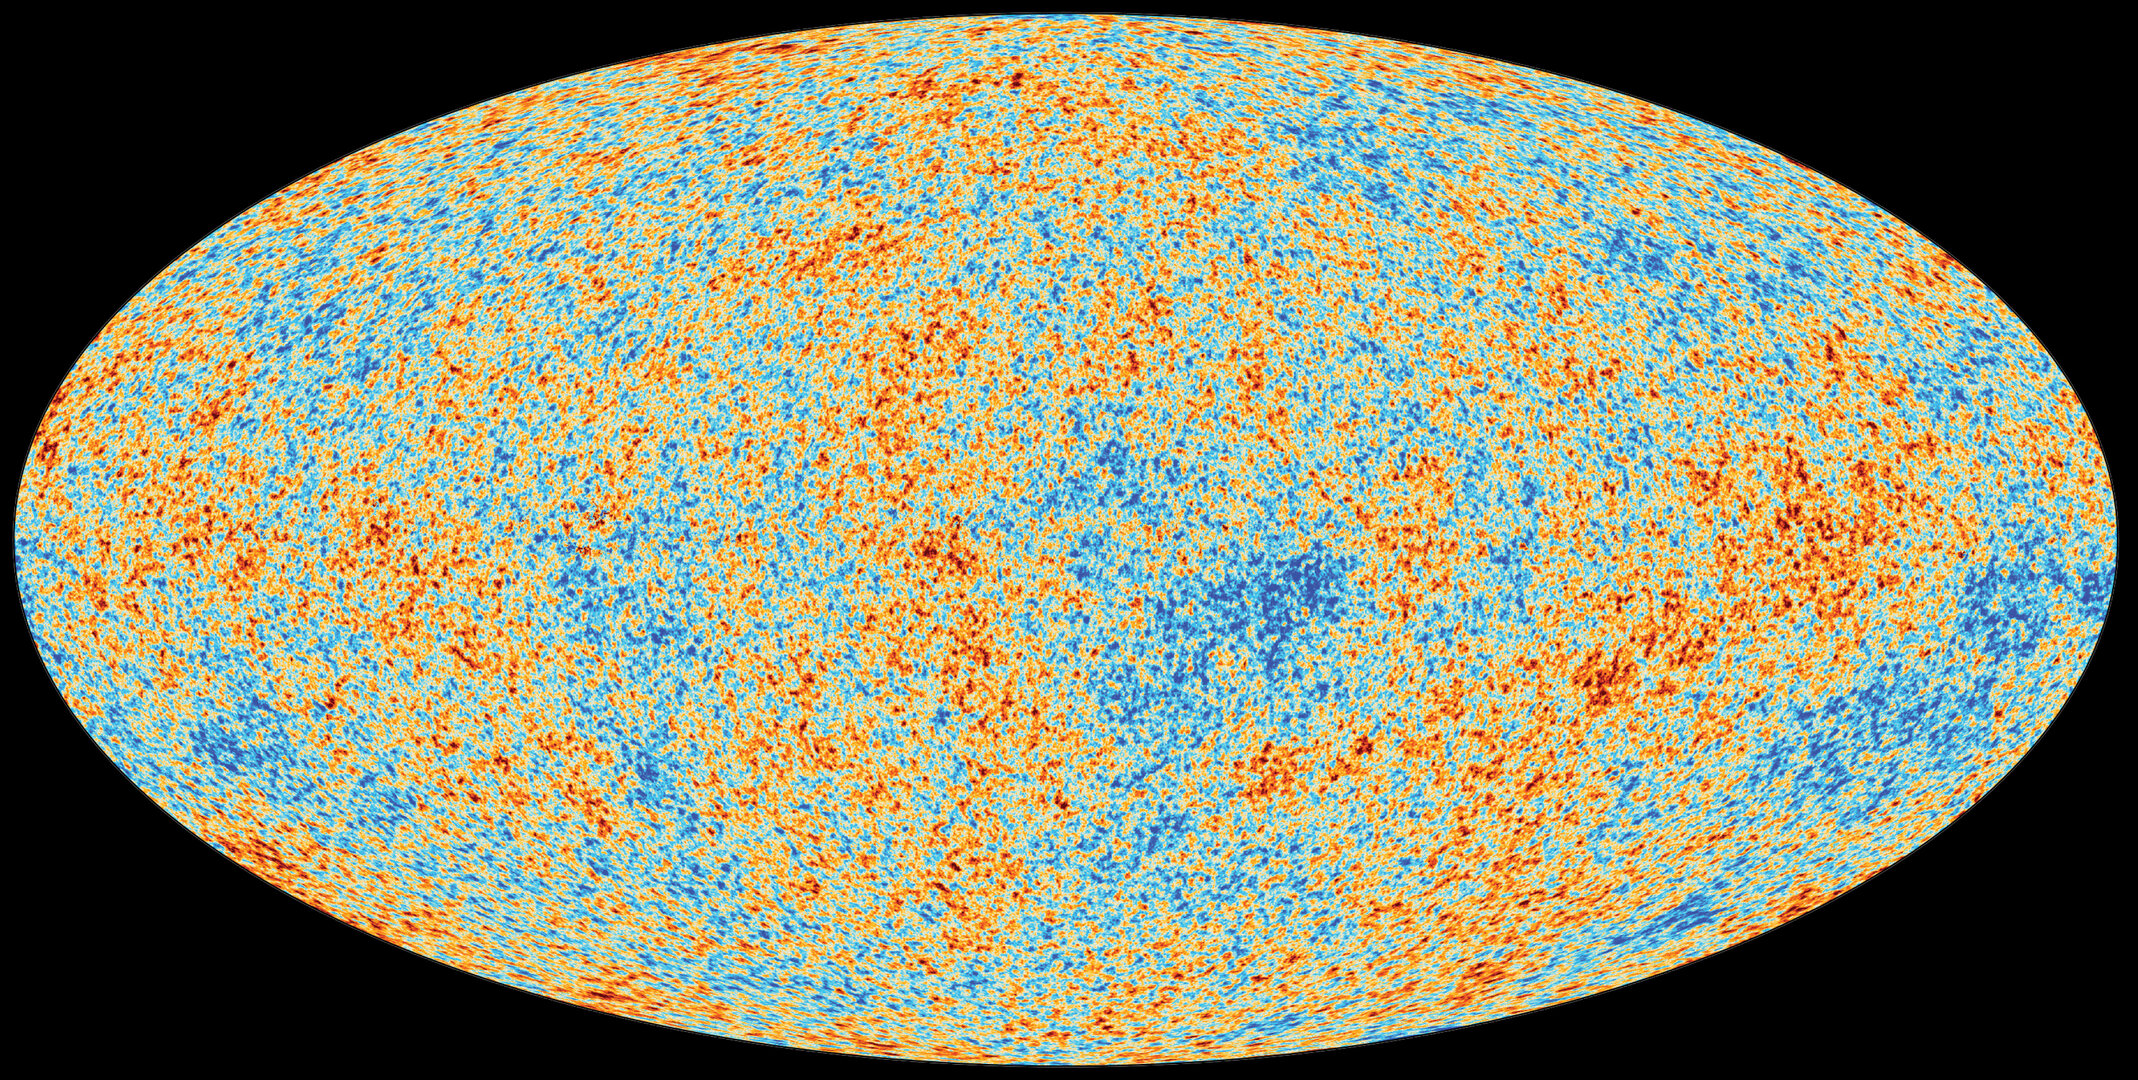
The CMB — the afterglow of the Big Bang — peaks at about cm. What is its temperature?
StepInvert Wien's law (CGS)
Dimensional check
cm·K divided by cm leaves K ✓.
Result
About 2.7 K — the temperature of the universe itself, cooling for 13.8 billion years as space expands. The CMB is the most perfect blackbody ever measured (COBE confirmed deviations ppm); Planck mapped its K fluctuations, the seeds of all cosmic structure.
Pause & Predict
A nebula glows bright red at one specific wavelength (656.3 nm); a nearby star shows a smooth rainbow with dark lines. Think about what's needed to produce each spectrum type.
Part 6 develops Kirchhoff's laws to answer this.
Atoms and Spectral Lines
Part 6: Atoms and Spectral Lines
The Sun’s spectrum isn’t a smooth rainbow — it’s crossed by hundreds of dark absorption lines. They aren’t imperfections; they’re information. The key idea: atoms have quantized energy levels.
The Bohr Model
Modern quantum mechanics is deeper, but the
Bohr model
An early model of the atom in which an electron occupies discrete, quantized energy levels labeled by an integer . It correctly predicts hydrogen’s energy levels and spectral lines, and supplies the intuition behind quantum atomic structure.
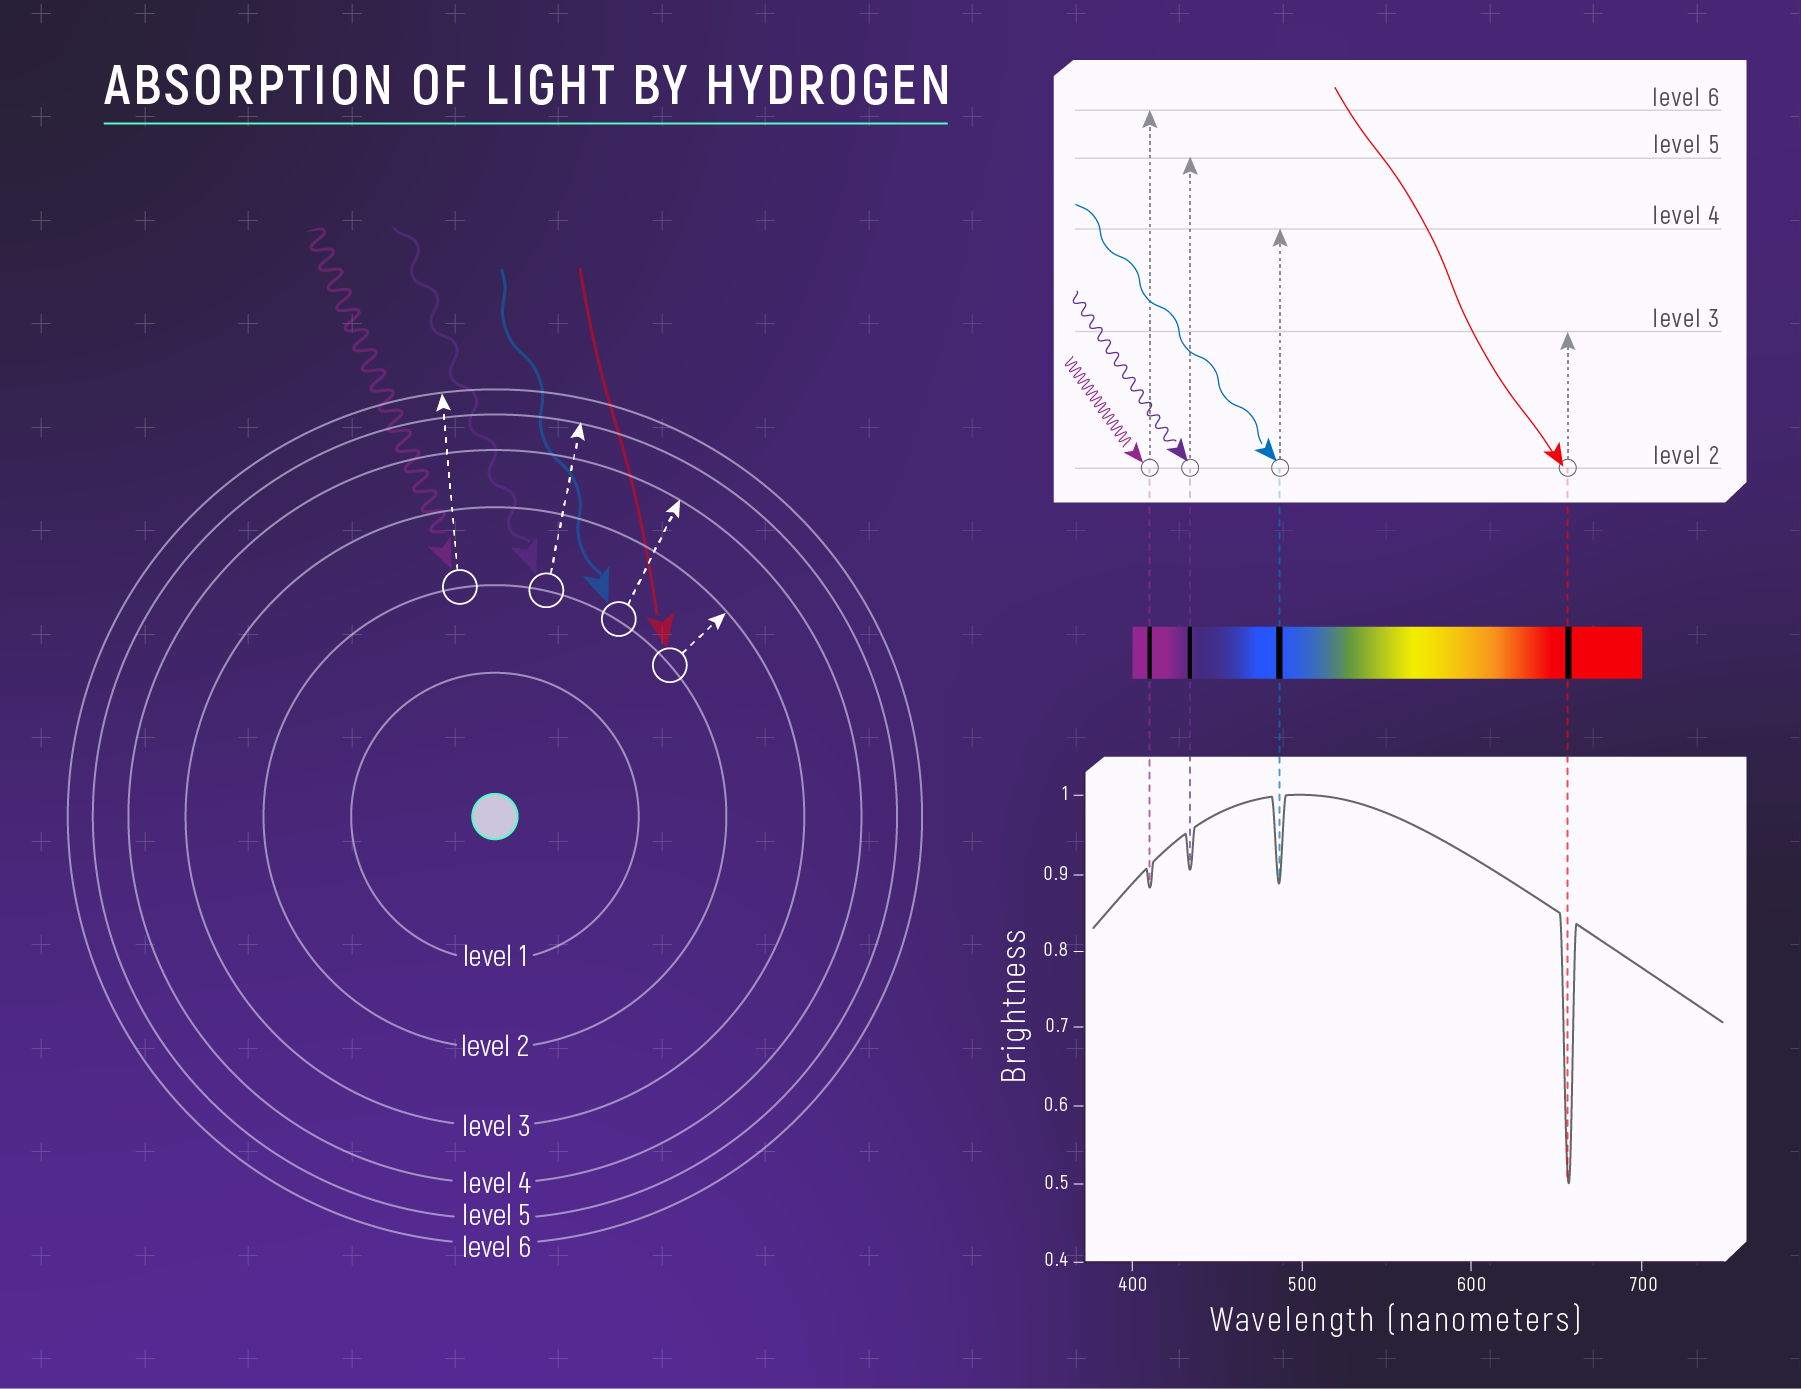
For hydrogen, the energy of level is:
The ground state () is the most tightly bound; higher levels have energies closer to zero (less bound, easier to ionize).
Photon Absorption and Emission
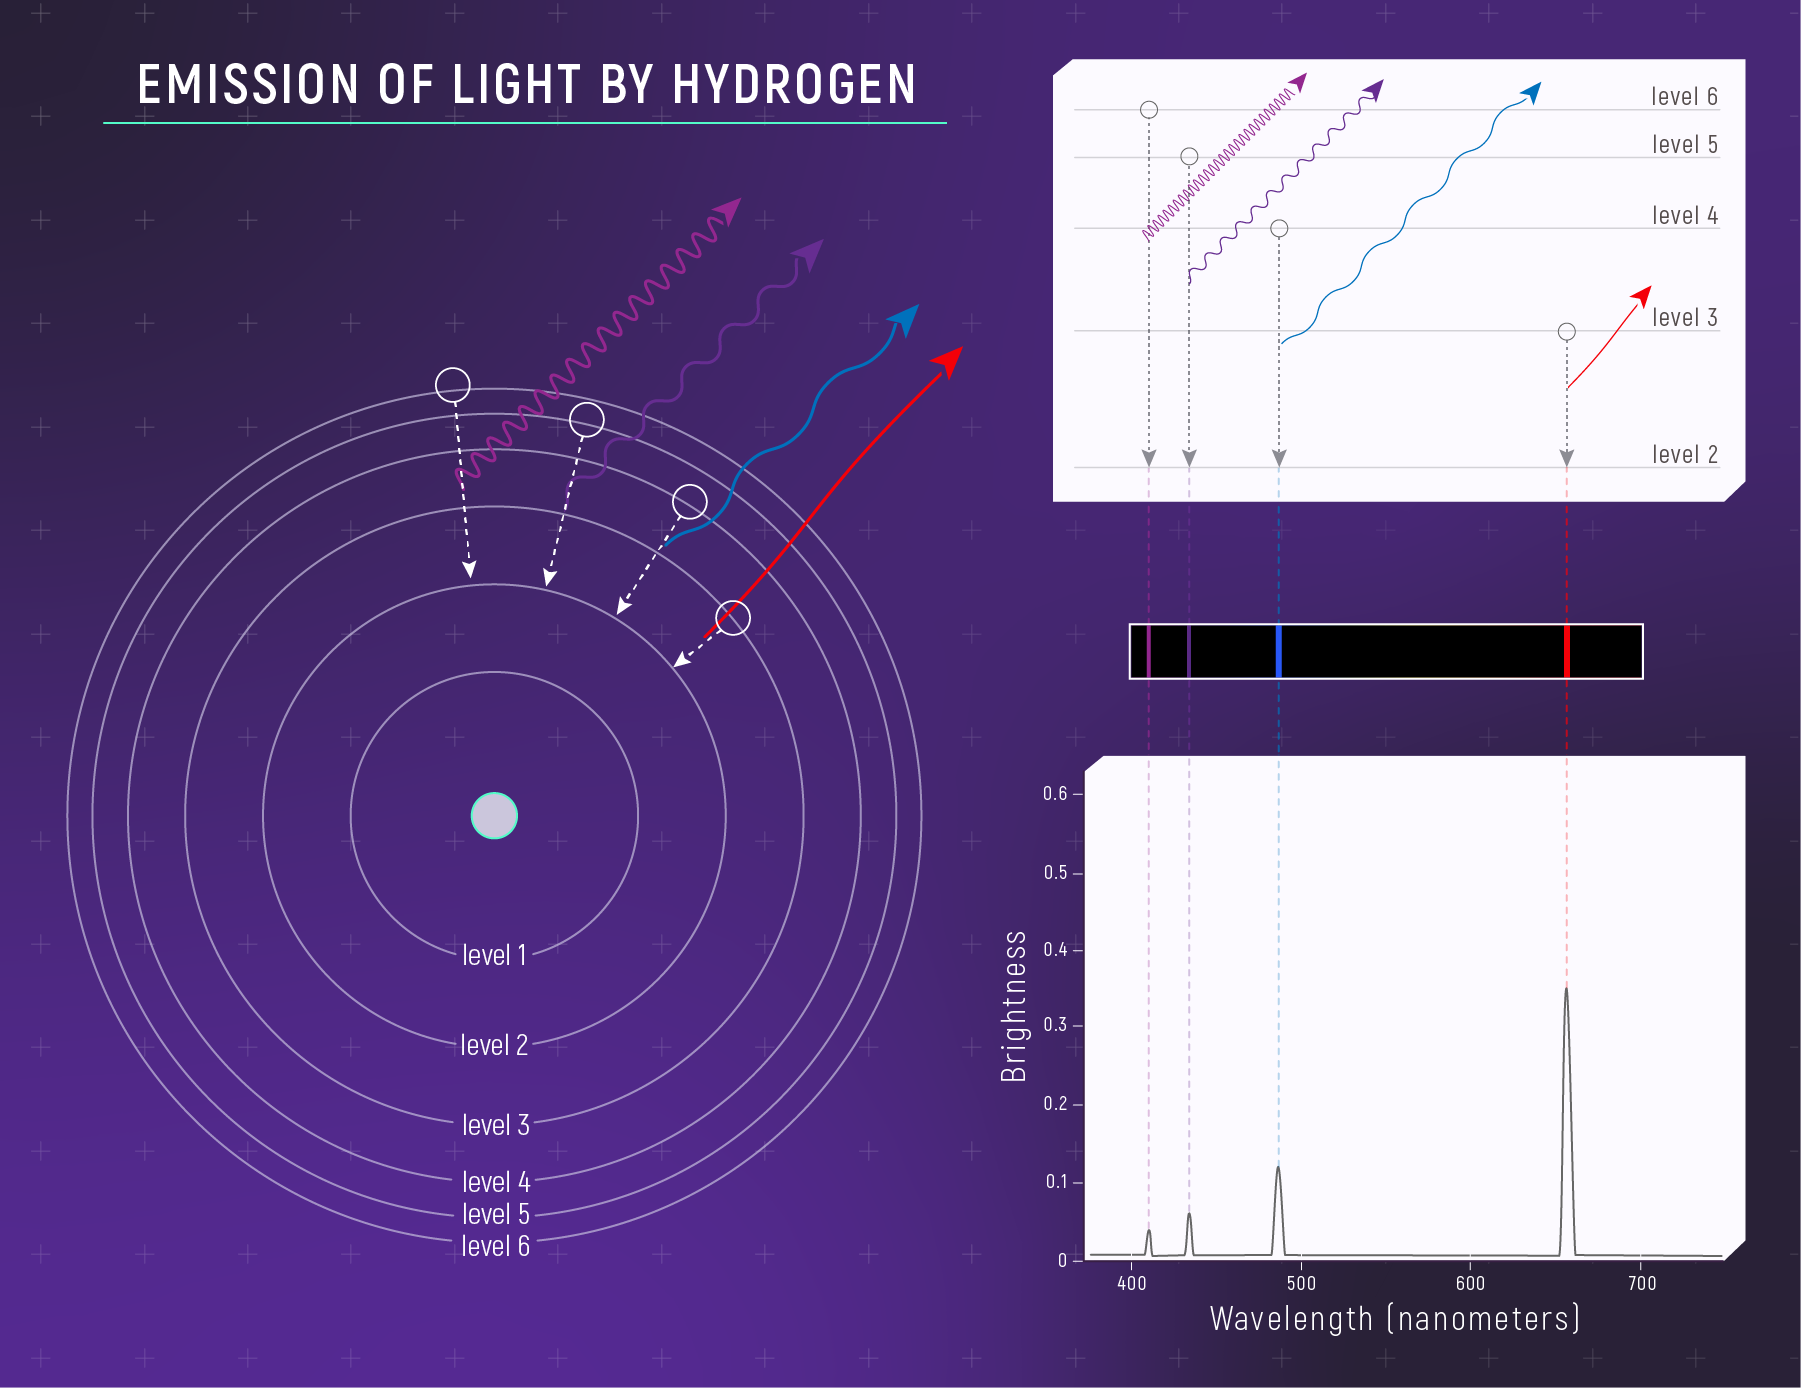
When an electron changes levels, the atom absorbs or emits a photon whose energy matches the difference:
An absorption line appears when photons of a particular energy are removed because electrons jump up; an emission line appears when a thin gas produces photons as electrons fall down.
Kirchhoff’s Laws: Three Types of Spectra
Kirchhoff's laws
Three rules linking a spectrum’s appearance to its source: (1) a hot dense object gives a continuous spectrum; (2) a hot thin gas gives an emission-line spectrum; (3) cool gas in front of a hot continuous source gives an absorption-line spectrum.
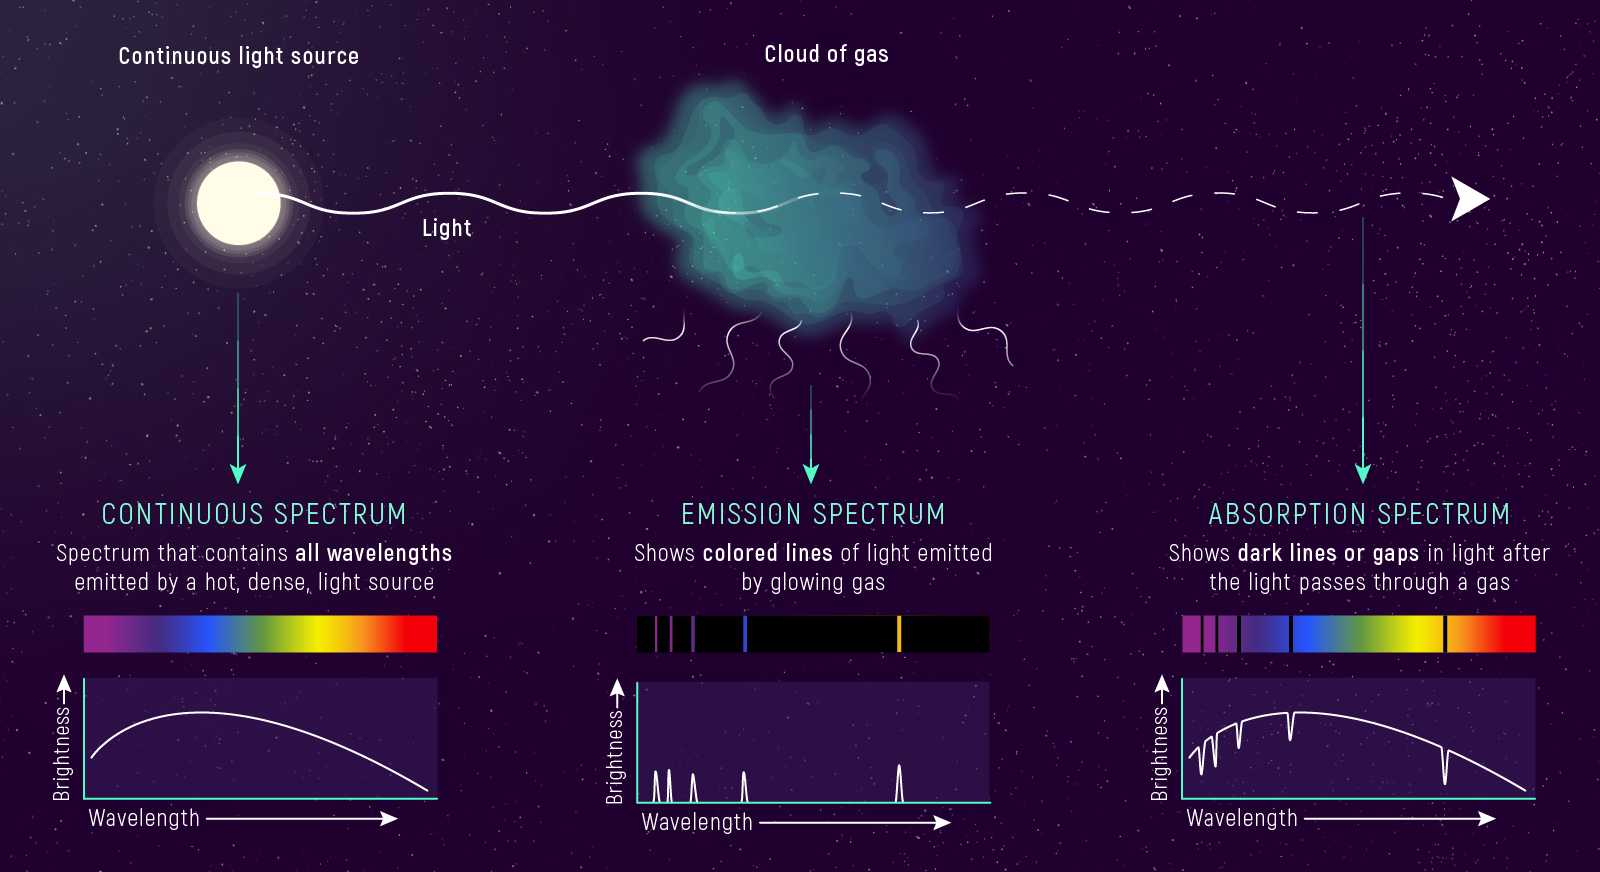
A
Continuous spectrum
A smooth spectrum spanning all wavelengths, with no lines — emitted by a hot, dense (blackbody-like) source such as a stellar interior.
Absorption spectrum
A continuous spectrum crossed by dark lines, produced when cooler gas in front of a hot continuous source removes photons at its characteristic wavelengths. Stellar spectra are absorption spectra.
Emission spectrum
Bright lines on a dark background, produced by a hot, thin gas with no bright continuum behind it — for example, an emission nebula.
Spectral lines reveal more than composition: which transitions are populated gives temperature; Doppler shifts give velocity; line widths give density/pressure — all developed in Module 2.
In an absorption spectrum, where must the absorbing gas be located relative to the bright source — and why does it produce dark lines rather than bright ones?
The cooler gas must lie in front of the hot continuous source along the line of sight. It removes photons at its characteristic wavelengths (electrons jumping up), leaving dark notches in the otherwise-continuous spectrum.
Real Stellar Spectra
Part 7: Real Stellar Spectra
Beyond the Ideal Blackbody
Stars are approximately blackbodies. Real spectra show two features: the overall shape follows a Planck curve (temperature, via Wien’s law), and absorption lines appear as dark notches (composition, via spectroscopy).
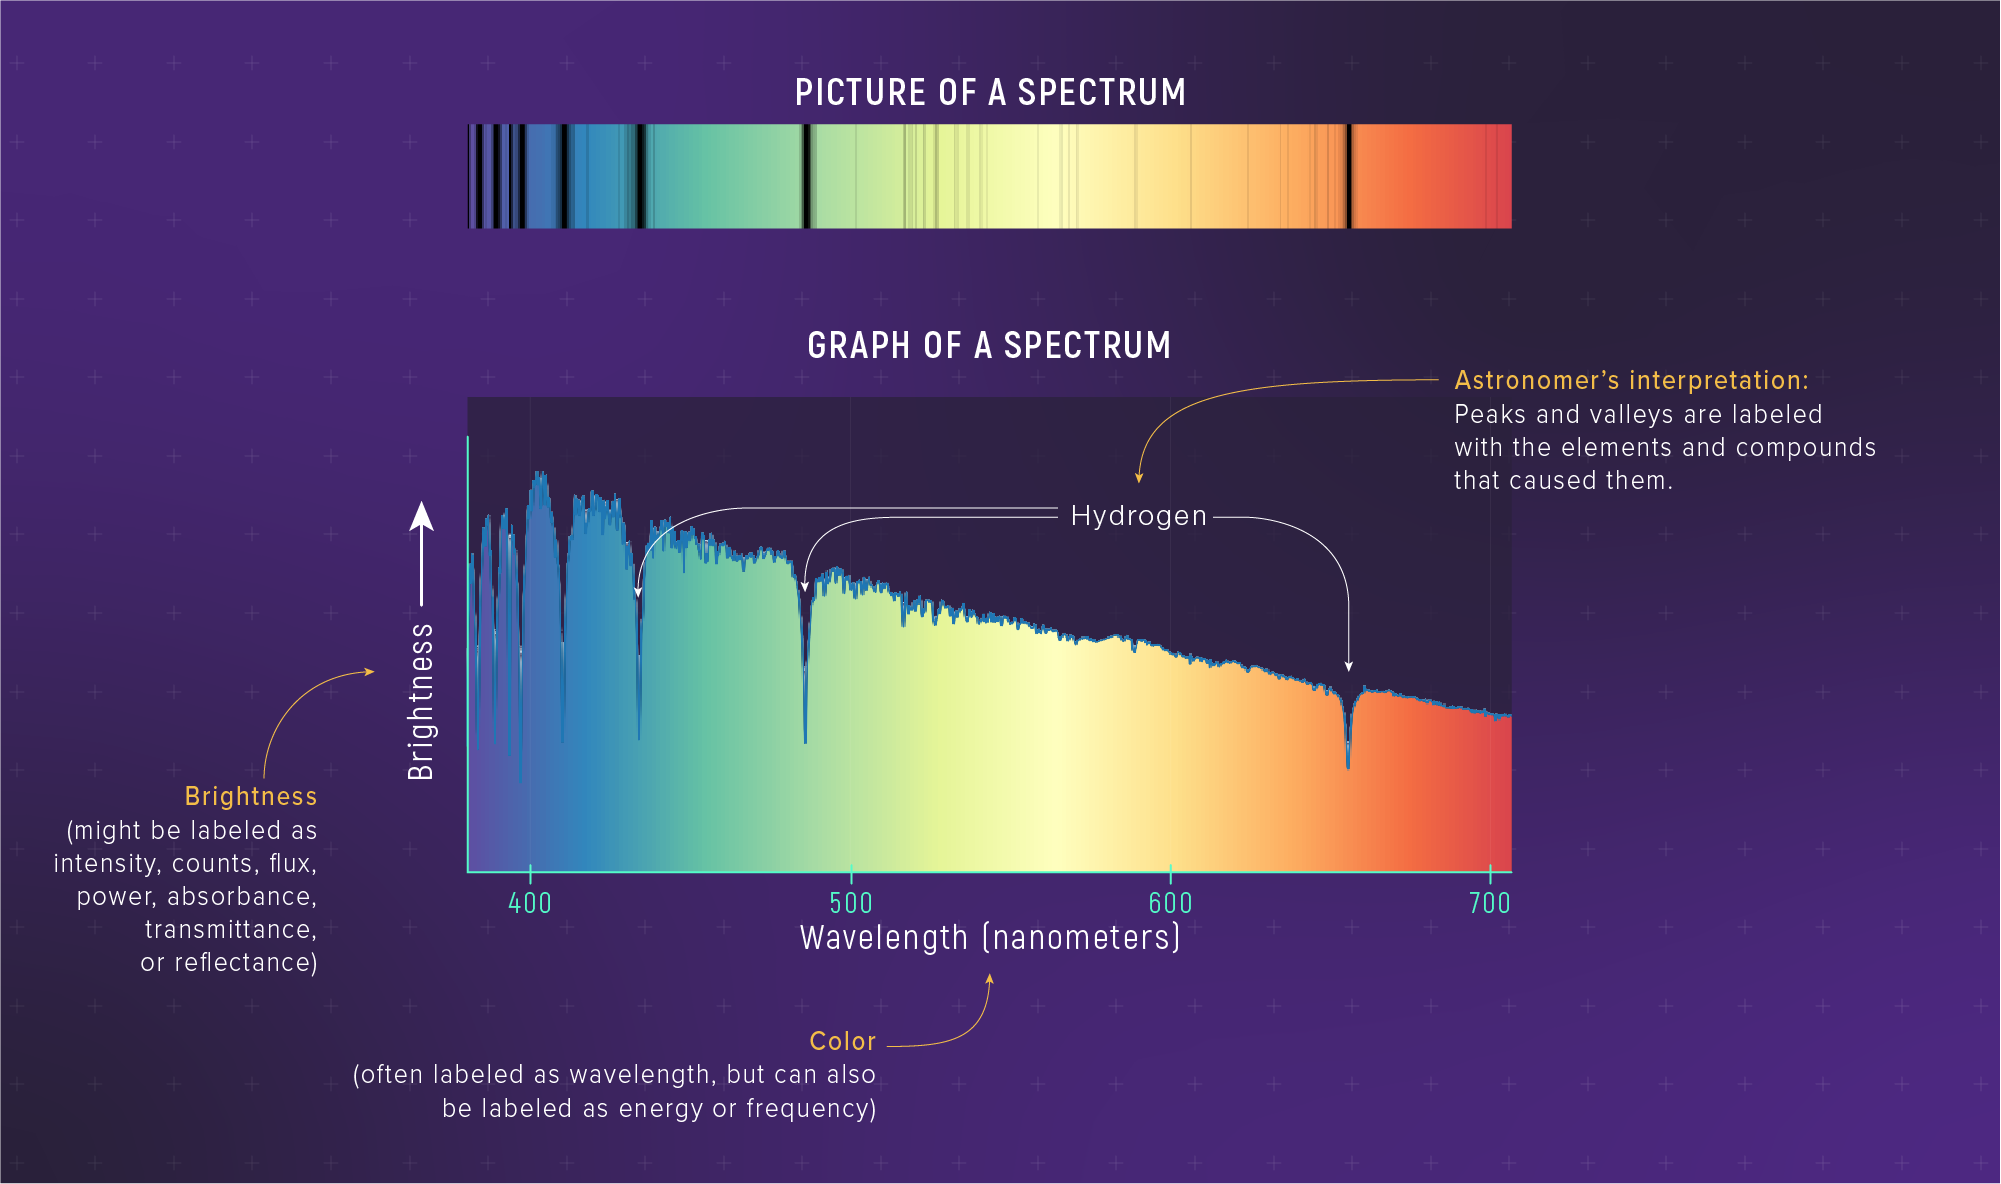
The spectrum of Altair (an A-type star) shows the smooth blackbody shape plus sharp absorption dips from hydrogen and other elements — two inference tools in one observation: the curve shape gives temperature, the line positions give composition.
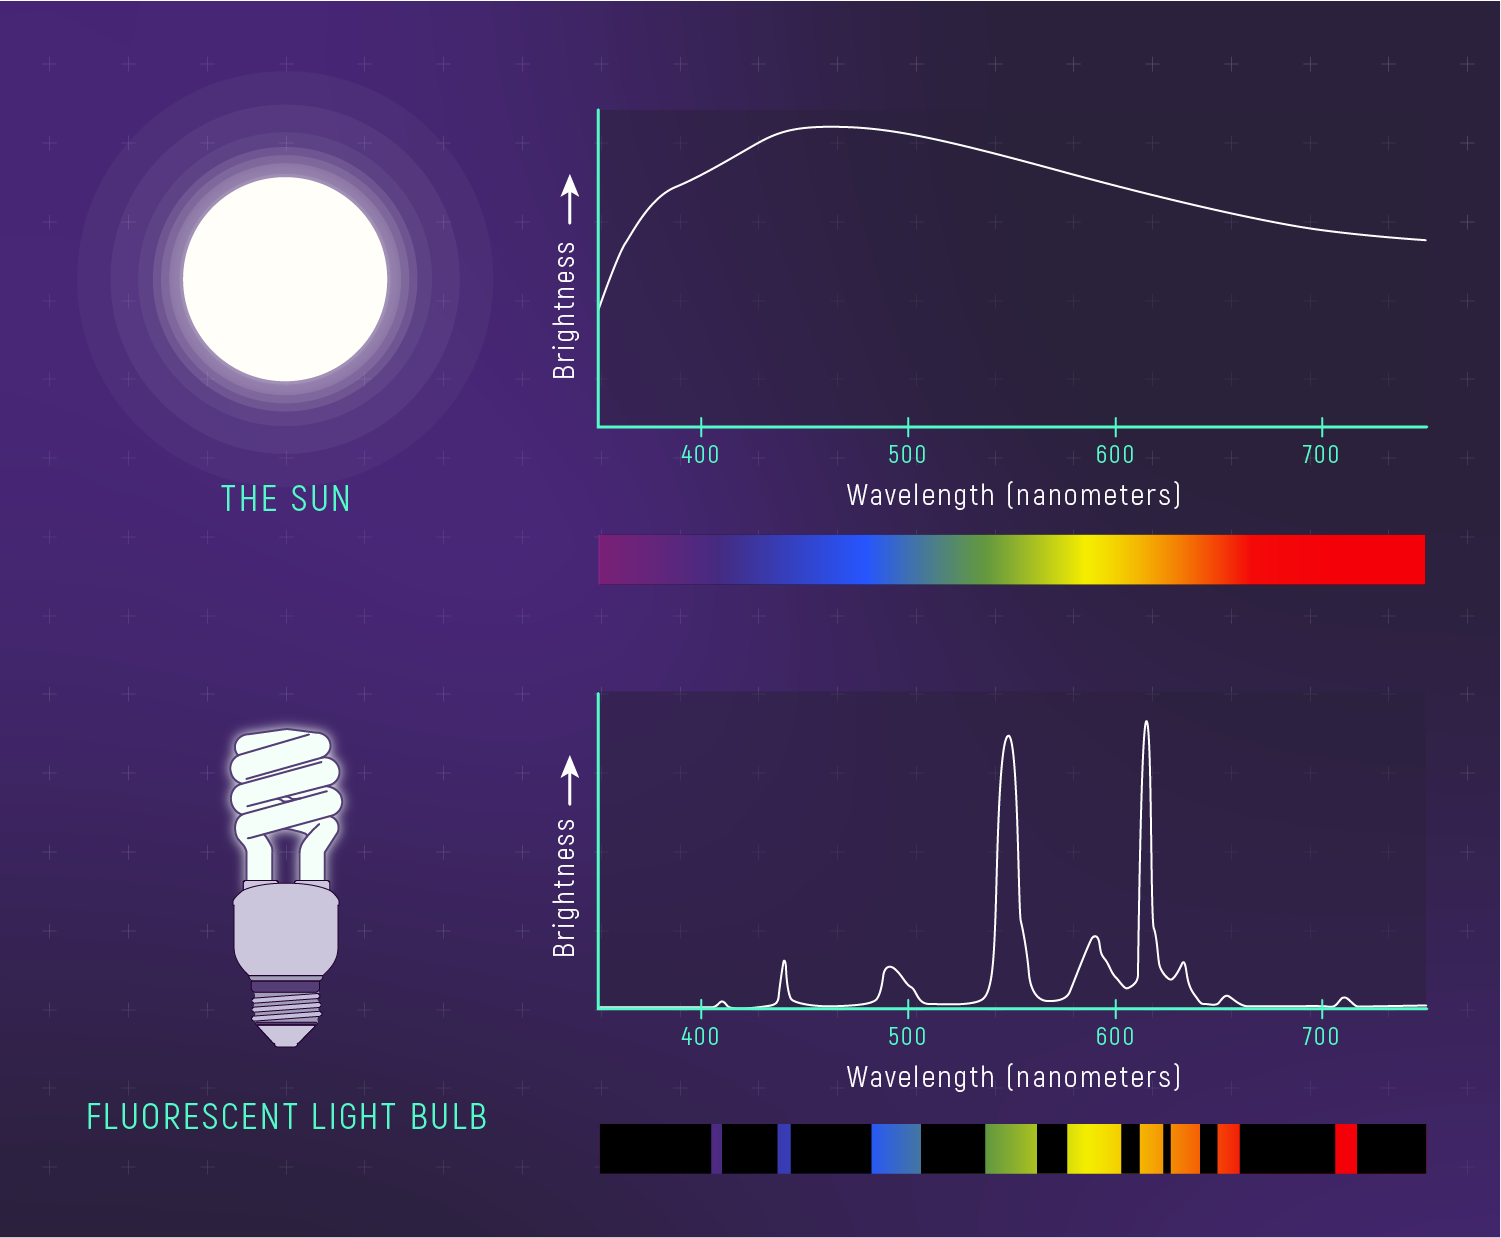
Compare the Sun’s spectrum (approximately continuous, like a blackbody) with a fluorescent bulb (discrete emission lines): the shape tells you the emission mechanism — thermal versus non-thermal.
Doppler Shift: Motion in Spectral Lines
Spectral lines are also speedometers. If a source moves toward or away from us, its lines shift slightly, encoding the line-of-sight velocity — we measure motion using nothing but light.
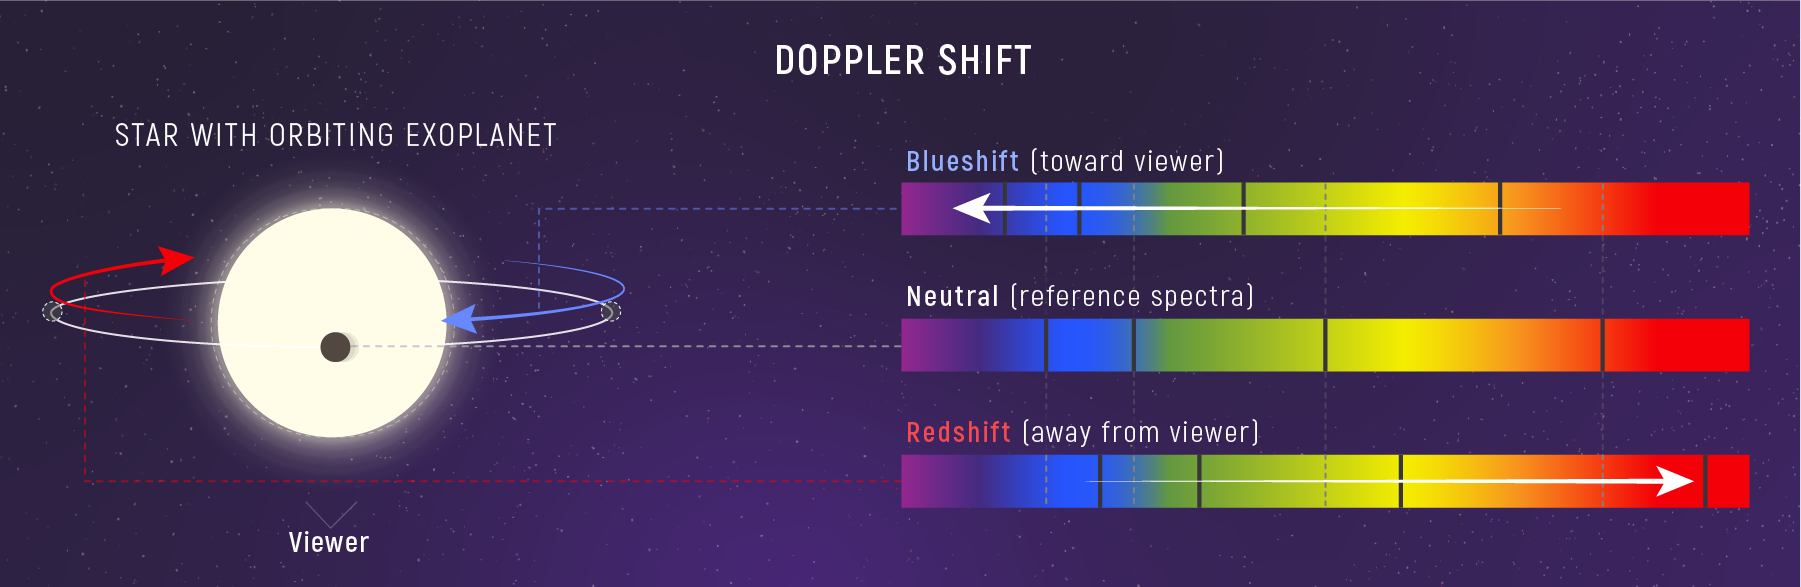
For speeds much smaller than , the non-relativistic Doppler shift is:
Here , is the rest wavelength, and is the radial (line-of-sight) velocity. If the lines redshift (longer ); if is negative they blueshift. Accurate when ; very large cosmological redshifts need a relativistic treatment.
This tiny shift unlocks some of the biggest stories in astronomy: a star’s wobble reveals exoplanets; binary Doppler shifts give orbital speeds and masses; line shifts across a galaxy map its rotation (and point to dark matter); and overall redshift shows the universe is expanding.
A spectral line is observed at a slightly longer wavelength than its lab value. Is the source approaching or receding?
Receding — a shift to longer wavelength is a redshift, meaning positive radial velocity (motion away from us).
Pause & Predict
JWST has a 6.5 m mirror; Hubble has a 2.4 m mirror. Think about how area and resolution scale with diameter.
Part 8 makes both quantitative.
Telescopes as Light Buckets
Part 8: Telescopes as Light Buckets
Telescopes extend our reach two ways: they collect more photons and resolve finer detail.
Collecting Area: Why Bigger Is Better
For a circular aperture, the
Collecting area
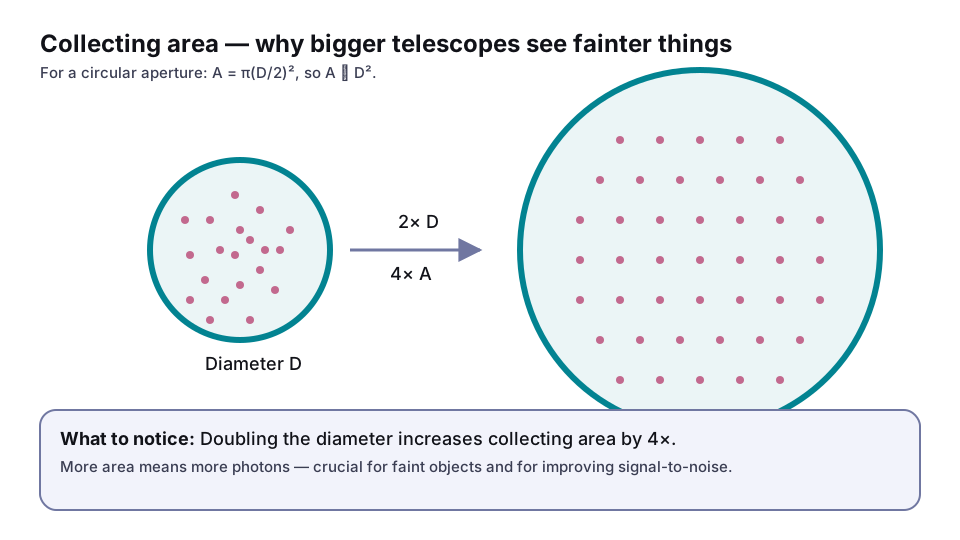
The light-gathering area of a telescope’s aperture, . The photon rate from a source scales with , so aperture — not magnification — sets how faint an object a telescope can detect.
The photon rate scales with area, so the faintest detectable source scales as : a mirror twice as wide gathers four times the light.
Problem
Using : (1) if diameter doubles, area does what? (2) Triples? (3) JWST ( m) versus Hubble ( m)?
- Quadruples ().
- — same scaling.
- JWST has Hubble’s collecting area — much fainter objects in the same exposure.
Angular Resolution: Why Bigger Is Sharper
Even with lots of light, you can’t see detail finer than your
Angular resolution
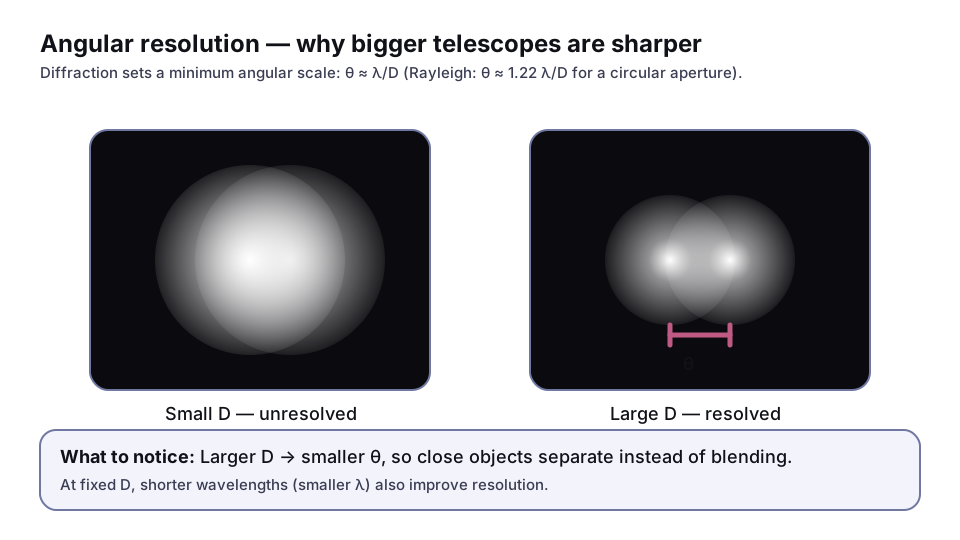
The smallest angular separation a telescope can distinguish, set by diffraction: (the circular-aperture form is ). Larger apertures and shorter wavelengths give finer resolution.
For a circular aperture the precise form is ; for scaling arguments we use . Bigger and shorter both sharpen the image.
Problem
Using : (1) if diameter doubles (fixed ), resolution does what? (2) If wavelength doubles (fixed )? (3) Observing at m instead of m with the same telescope?
- Improves by (the angle halves) — bigger mirrors resolve finer detail.
- Worsens by — longer wavelengths give blurrier images.
- Worsens by — you resolve less detail in the infrared, which is why IR astronomy often needs larger mirrors.
Ground-based optical telescopes often miss the diffraction limit because atmospheric turbulence blurs images —
Seeing
The blurring of astronomical images by turbulence in Earth’s atmosphere, which makes ground-based resolution (typically arcsec) far worse than the diffraction limit. Adaptive optics or space telescopes overcome it.
The Observable–Model–Inference Chain
Part 9: Synthesis — The Observable → Model → Inference Chain
We’ve followed the photon’s story end to end: how it’s produced, how it interacts, what it tells us, and how we catch it. The chapter’s whole method is the inference chain — measure something, apply a physical model, infer what you couldn’t measure directly. Two of these chains are clean enough to render explicitly:
A star's peak wavelength (its color)
The wavelength at which a star’s continuous spectrum is brightest — measured from its spectrum or a color index.
Wien's displacement law
A blackbody’s peak wavelength is fixed by temperature alone, .
The star's surface temperature
Inverting Wien’s law turns the observed color directly into a temperature — no thermometer, no spacecraft.
The pattern of spectral lines
Dark absorption lines (or bright emission lines) at specific, repeatable wavelengths in a spectrum.
Kirchhoff's laws + quantized atomic energy levels
Each element has a unique set of energy-level gaps, so it absorbs and emits at a unique fingerprint of wavelengths.
The composition (and conditions) of the gas
Matching the line pattern to known elements reveals what the star or nebula is made of, and the geometry reveals whether we see absorption or emission.
The same pattern runs through the rest of the chapter:
| We measure | We use | We infer |
|---|---|---|
| Peak wavelength (color) | Wien’s law: | Surface temperature |
| Spectrum shape | Planck function | Thermal emission mechanism |
| Scattering behavior | Rayleigh: | When/why reddening matters |
| Line pattern and type | Kirchhoff’s laws + atomic transitions | Composition and physical conditions |
| Aperture diameter | , | Faintness reach and sharpness |
What’s coming: next we’ll measure distance (parallax, standard candles, the inverse-square relation); combined with apparent brightness, that gives luminosity. Then we return to blackbody physics to connect temperature, luminosity, and radius (Stefan-Boltzmann), and deepen spectroscopy. Each week the inference chain grows longer — by the end of Module 2 you’ll characterize a star’s temperature, luminosity, radius, and mass entirely from its light.
Proportional Reasoning Practice
The equations here are all proportional relationships; internalizing them — without a calculator — is a crucial skill.
| Equation | Key Scaling | In Words |
|---|---|---|
| Wave relation | Frequency and wavelength are inversely related | |
| Photon energy | Shorter wavelength = higher energy | |
| Rayleigh scattering | Scattering is very sensitive to wavelength | |
| Wien’s law | Hotter objects peak at shorter | |
| Rayleigh-Jeans limit | Classical limit: linear in , steep in | |
| Collecting area | Area scales as diameter squared | |
| Angular resolution | Finer with larger , coarser with longer |
Problem
Two telescopes observe the same star — Telescope A: m at nm; Telescope B: m at nm. (1) Which collects more light, and by what factor? (2) Which has better angular resolution? (3) For a K blackbody, which observes closer to the peak?
- B collects more (: ).
- A resolves finer. : A gives , B gives (arbitrary units); smaller is sharper. B’s larger mirror () doesn’t compensate for its longer wavelength (), so A resolves finer.
- A is closer to the peak. Wien: nm. A (500 nm) is near the peak; B (2000 nm) is on the red tail. Larger helps both light-gathering and resolution, but longer hurts resolution — real telescope design is full of these trade-offs.
Quick Practice
Four no-calculator warm-ups — each answer is a single clean factor.
Numeric answer
If a wave’s wavelength decreases by a factor of 3, by what factor does its frequency change?
Frequency increases by a factor of 3. Since , frequency is inversely proportional to wavelength — shorter wavelength means proportionally higher frequency.
Numeric answer
Two photons have wavelengths 500 nm and 1000 nm. By what factor is the 500 nm photon’s energy greater than the 1000 nm photon’s?
The 500 nm photon has 2× higher energy. Since , halving the wavelength doubles the energy: .
Numeric answer
Rayleigh scattering scales as . By what factor is scattering stronger at 400 nm than at 800 nm?
Scattering at 400 nm is 16× stronger. The dependence gives .
Numeric answer
If a blackbody’s peak wavelength is cut in half, by what factor does its temperature change?
Temperature doubles. Since , halving the peak wavelength requires doubling the temperature.
The 14 graded practice problems for this lecture live in the companion practice set.
Reference Tables
Key Equations
| Quantity | Equation | What It Tells You |
|---|---|---|
| Wave relation | Wavelength and frequency are inversely related | |
| Photon energy | Short wavelength = high energy | |
| Rayleigh scattering | Short wavelengths scatter much more strongly | |
| Wien’s law | Peak wavelength encodes temperature | |
| Bohr levels (H) | Atomic energies are quantized; line energies are differences | |
| Collecting area | Light-gathering power scales as | |
| Diffraction limit | Resolution improves with larger , shorter |
Physical Constants
| Constant | Symbol | Value |
|---|---|---|
| Speed of light | cm/s | |
| Planck’s constant | erg·s | |
| Boltzmann’s constant | erg/K | |
| Wien’s constant | cm·K |
Temperature and Color
| Object | Temperature | Peak Wavelength | Band |
|---|---|---|---|
| CMB | 2.7 K | cm | Microwave |
| Cool dust | 30 K | cm | Far-IR |
| Brown dwarf | 1000 K | cm | Near-IR |
| M dwarf (Proxima Cen) | 3000 K | nm | Near-IR |
| K dwarf | 4500 K | nm | Visible (orange) |
| Sun (G dwarf) | 5800 K | nm | Visible (green-yellow) |
| A star (Sirius) | 10000 K | nm | Near-UV |
| O star | 40000 K | nm | Far-UV |
Glossary
- Absorption spectrum
A continuous spectrum crossed by dark lines, produced when cooler gas in front of a hot continuous source removes photons at its characteristic wavelengths. Stellar spectra are absorption spectra.
- Albedo
The fraction of incident light a surface reflects. A bright icy moon has high albedo; dark rock has low albedo. It encodes information about surface composition and texture.
- Angular resolution
The smallest angular separation a telescope can distinguish, set by diffraction: (the circular-aperture form is ). Larger apertures and shorter wavelengths give finer resolution.
- Blackbody
An idealized perfect absorber and emitter: it absorbs all incident radiation and, when heated, emits a spectrum (the Planck curve) that depends only on its temperature . Stars are approximate blackbodies.
- Bohr model
An early model of the atom in which an electron occupies discrete, quantized energy levels labeled by an integer . It correctly predicts hydrogen’s energy levels and spectral lines, and supplies the intuition behind quantum atomic structure.
- Collecting area
The light-gathering area of a telescope’s aperture, . The photon rate from a source scales with , so aperture — not magnification — sets how faint an object a telescope can detect.
- Continuous spectrum
A smooth spectrum spanning all wavelengths, with no lines — emitted by a hot, dense (blackbody-like) source such as a stellar interior.
- Emission spectrum
Bright lines on a dark background, produced by a hot, thin gas with no bright continuum behind it — for example, an emission nebula.
- Kirchhoff's laws
Three rules linking a spectrum’s appearance to its source: (1) a hot dense object gives a continuous spectrum; (2) a hot thin gas gives an emission-line spectrum; (3) cool gas in front of a hot continuous source gives an absorption-line spectrum.
- Nanometer
A unit of length, — roughly ten hydrogen-atom diameters, and the natural unit for optical and UV light. Visible light spans about 400-700 nm.
- Opacity
A measure of how strongly matter absorbs or scatters light at a given wavelength. High opacity means light is blocked over a short distance. It is strongly wavelength-dependent — a cloud can be transparent in the optical but opaque in the UV.
- Rayleigh scattering
Scattering of light by particles much smaller than its wavelength, with a steep dependence. It makes the daytime sky blue, sunsets red, and reddens starlight passing through interstellar dust.
- Seeing
The blurring of astronomical images by turbulence in Earth’s atmosphere, which makes ground-based resolution (typically arcsec) far worse than the diffraction limit. Adaptive optics or space telescopes overcome it.
- Spectral radiance
The power a surface emits per unit area, per unit solid angle (“per direction”), per unit wavelength interval — what the Planck function gives. CGS units: .