Spoiler Alerts — The Universe Is Weird
How Do We Know What We Know?
Astronomical images are data. We decode them using physics to infer what we cannot directly measure.
This page is both (1) the assigned reading and (2) your reference manual for the course. You should expect to come back to it multiple times — before lecture, after lecture, and while doing practice problems and studying.
Default expectation (best): Read the whole page before class (including Check Yourself). Then return to it later when you work the Practice Problems.
If you’re short on time before class (~15 min): Do the Musts for today so you can participate now — then come back and finish the rest.
- Musts for today: The Big Idea • The Four Observables • Spoiler 1 + Spoiler 2 • Light: The Cosmic Messenger • Recognition, Not Retention
- Non-negotiable: Stop and answer every Check Yourself question you encounter in these sections (don’t just read past them).
Skim now, read carefully later: The rest of the Spoiler Reel (especially figures + captions). Skimming is a preview — you’ll get much more from it after lecture.
Deep Dives (important, not urgent): Equation-heavy expansions that deepen understanding. You don’t need them for first contact, but you will want them when you’re doing calculations and practice problems — plan to revisit them.
Reference mode (always): Use this page like a guide while you work: jump to figures, definitions, and the Glossary whenever you get stuck.
Reassurance: This is a preview, not a mastery test. Your goal is recognition now — understanding grows through revisiting and practice.
You Are Starstuff
“The cosmos is within us. We are made of star-stuff. We are a way for the universe to know itself.”
— Carl Sagan
The iron in your blood was forged inside a star that exploded before our Sun existed. The calcium in your bones came from a different dying star. The oxygen you breathe was manufactured in the core of a massive star and scattered into space when that star died.
You are, quite literally, made of stellar debris.
This course is about how we know that — and what else we can learn by carefully decoding the light that reaches us from across the cosmos.
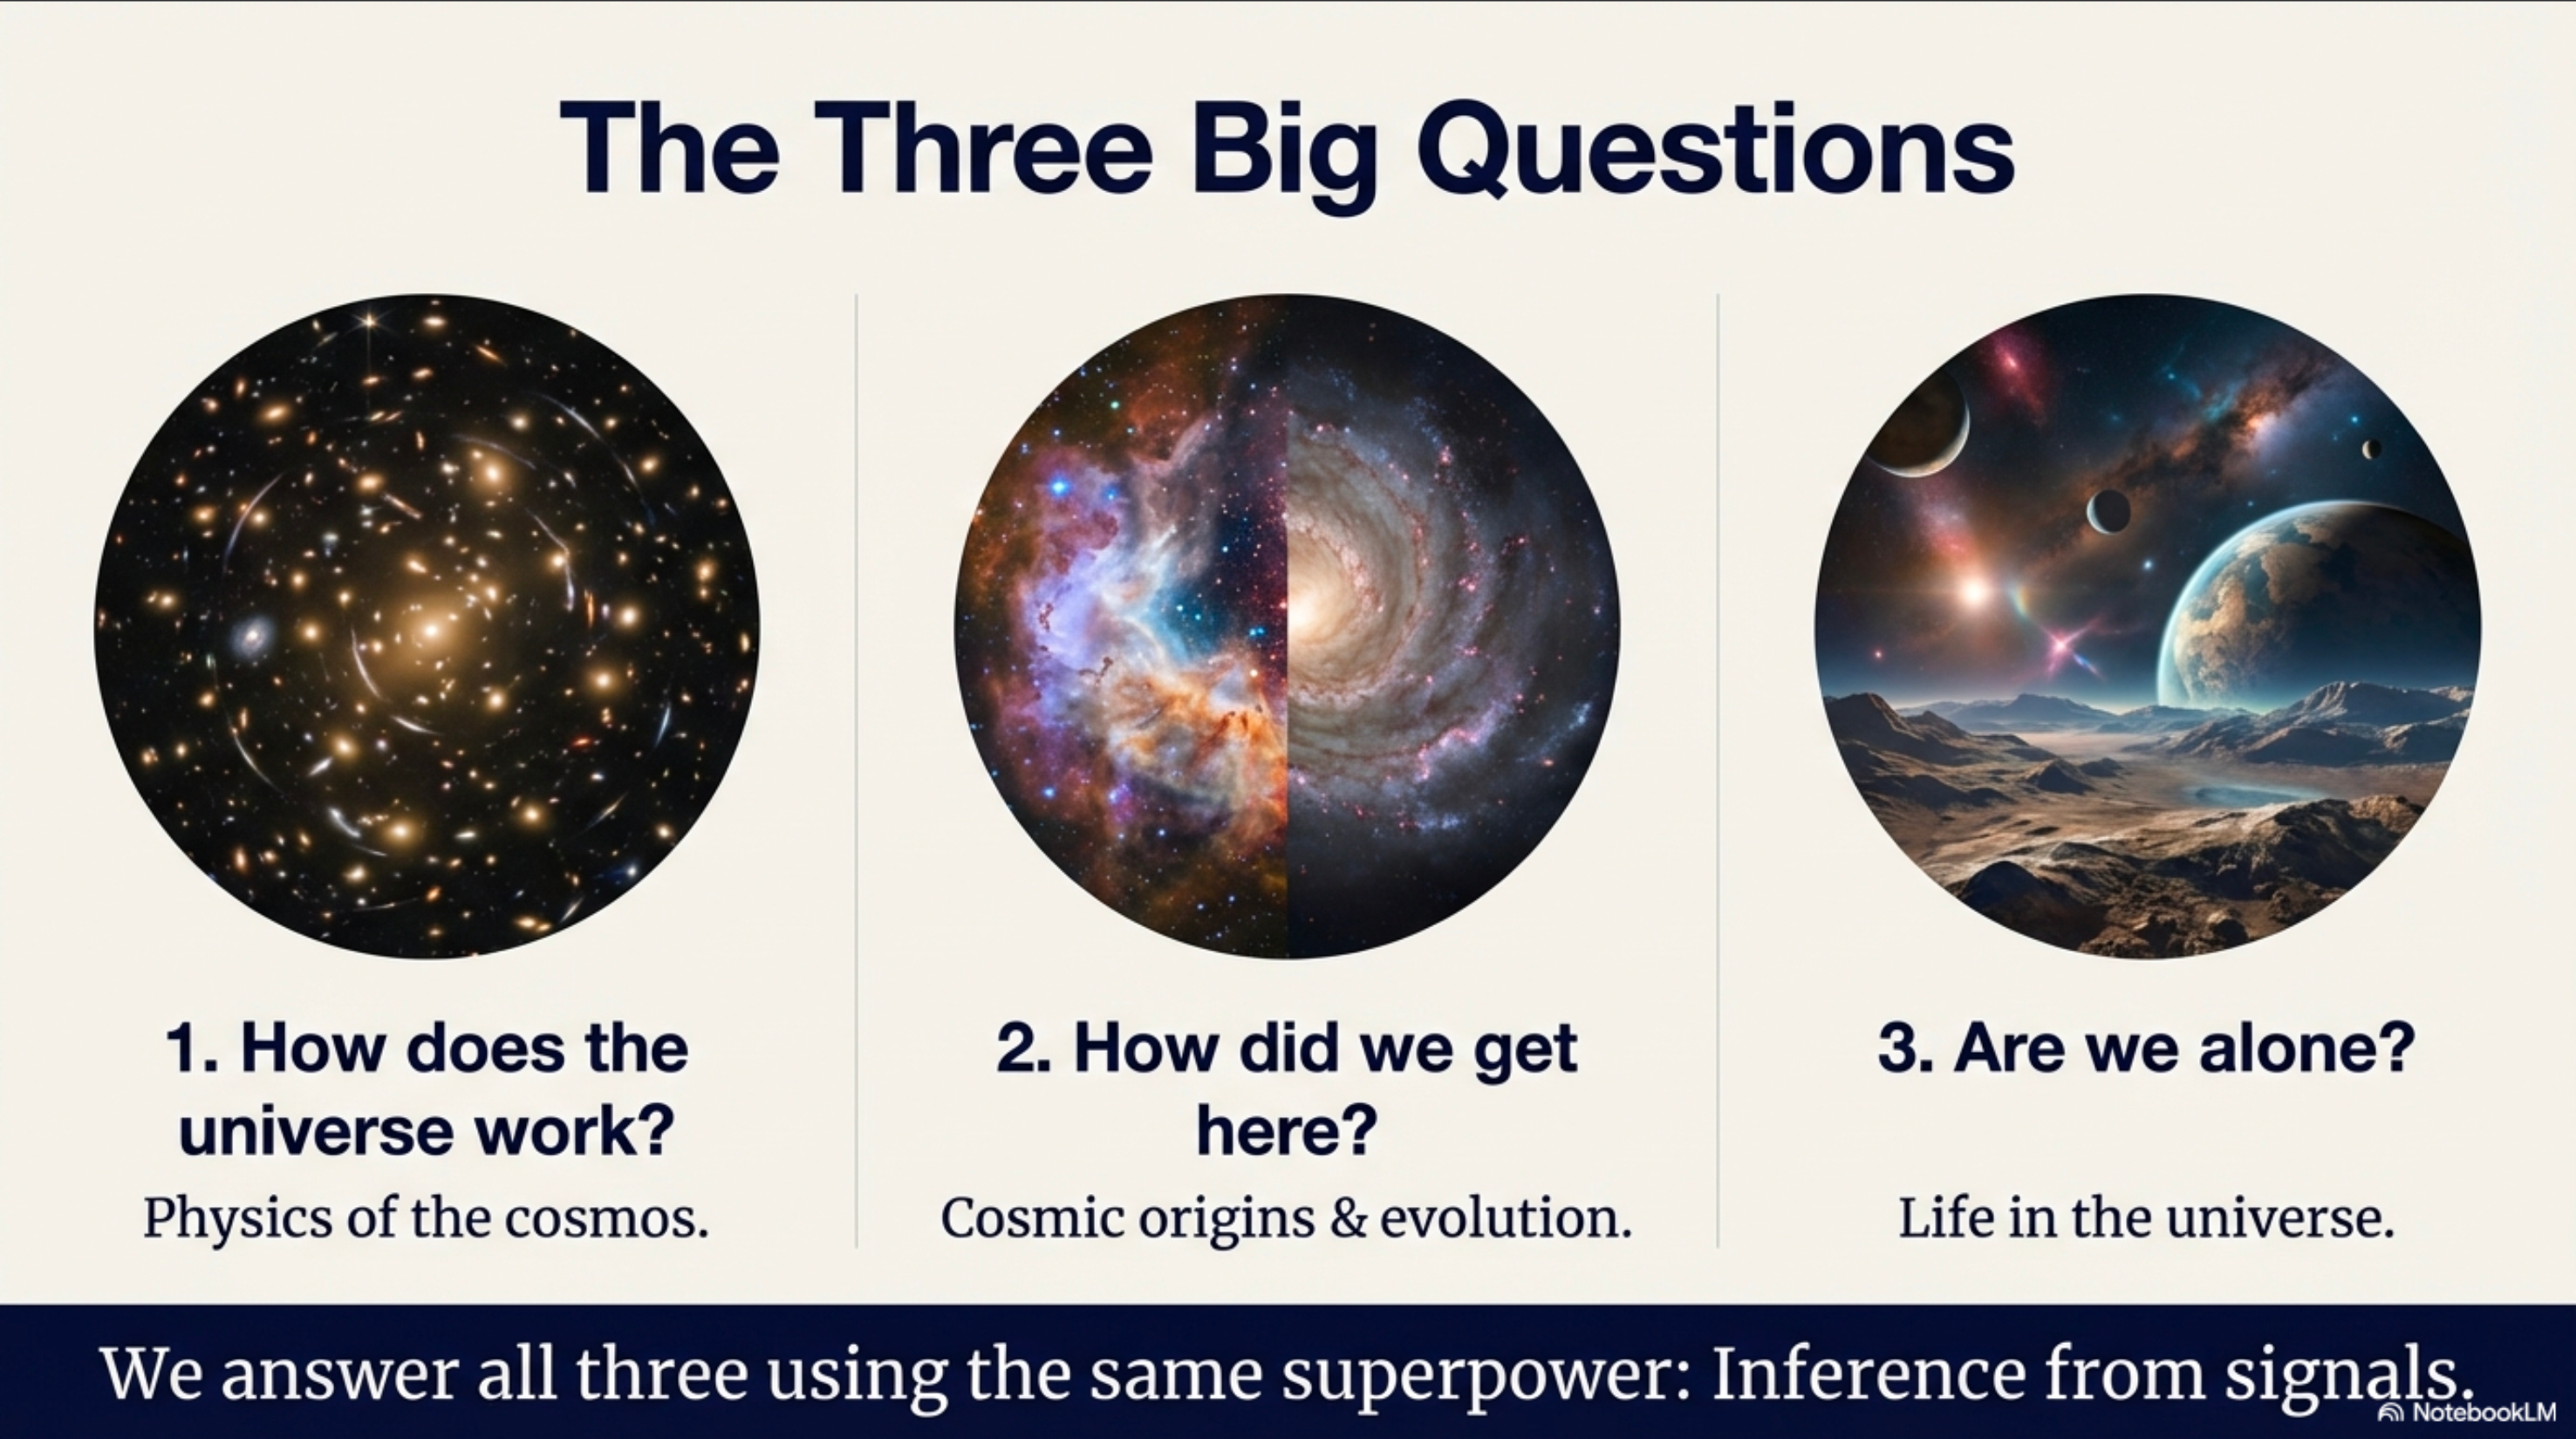
What to notice: Three questions drive modern astronomy—and we answer all of them using the same method: inference from signals. (Credit: (A. Rosen/NotebookLM))
The Central Question
Think about this: every piece of information you’ve ever heard about the cosmos — the Sun’s temperature, the age of the universe, the composition of a distant star — none of it came from collecting samples. We can’t scoop up a piece of a star. We can’t fly to the edge of the universe with a tape measure. We’re stuck here on Earth, looking up at points of light.
And yet, somehow, we know that:
- The Sun’s surface temperature is about 5,800 K
- The nearest star is 4.2 light-years away
- Stars are mostly hydrogen and helium
- The universe is about 13.8 billion years old and expanding
How is any of that possible?
The answer is the thesis of this course:
Pretty pictures \(\rightarrow\) measurements \(\rightarrow\) models \(\rightarrow\) inferences
Every gorgeous astronomical image you’ve ever seen is actually a dataset. The colors, shapes, bright spots and dark lanes — all of it encodes physical information. The job of an astronomer is to decode that information using physics and mathematics.
Inference: Drawing conclusions about quantities we cannot directly access (like a star’s temperature) from quantities we can measure (like its color).
What This Course Is NOT
Let me be direct about what this course is — and isn’t.
This course is NOT:
- Memorizing how many moons each planet has
- Identifying constellations
- Space trivia and fun facts
- Looking at pretty pictures and saying “wow, cool”
This course IS:
- How do we know what we claim to know?
- What can we actually measure from billions of kilometers away?
- How do physics and math turn limited measurements into profound understanding?
- Why should we believe any of these cosmic claims?
This is astronomy as a quantitative science. There will be equations. There will be calculations. There will be moments when your intuition fails and the math reveals something surprising. That’s not a bug — that’s the feature.
The Four Observables
Here’s the humbling truth that makes astronomy both challenging and beautiful: from our cosmic vantage point, staring at points of light billions of kilometers away, we can directly measure only four types of things.
| What We Measure | What It Means | What It Tells Us |
|---|---|---|
| Brightness | How much light energy arrives at our detector | How luminous is this, combined with how far away? |
| Position | Where the object appears on the sky (and how that changes) | Geometry, motion, orbits |
| Wavelength | Which “colors” of light are present, and in what amounts | Temperature, composition, motion toward/away from us |
| Timing | When things happen and how the above change over time | Variability, periods, dynamical timescales |
That’s it. Four types of measurements. Everything else is inferred.
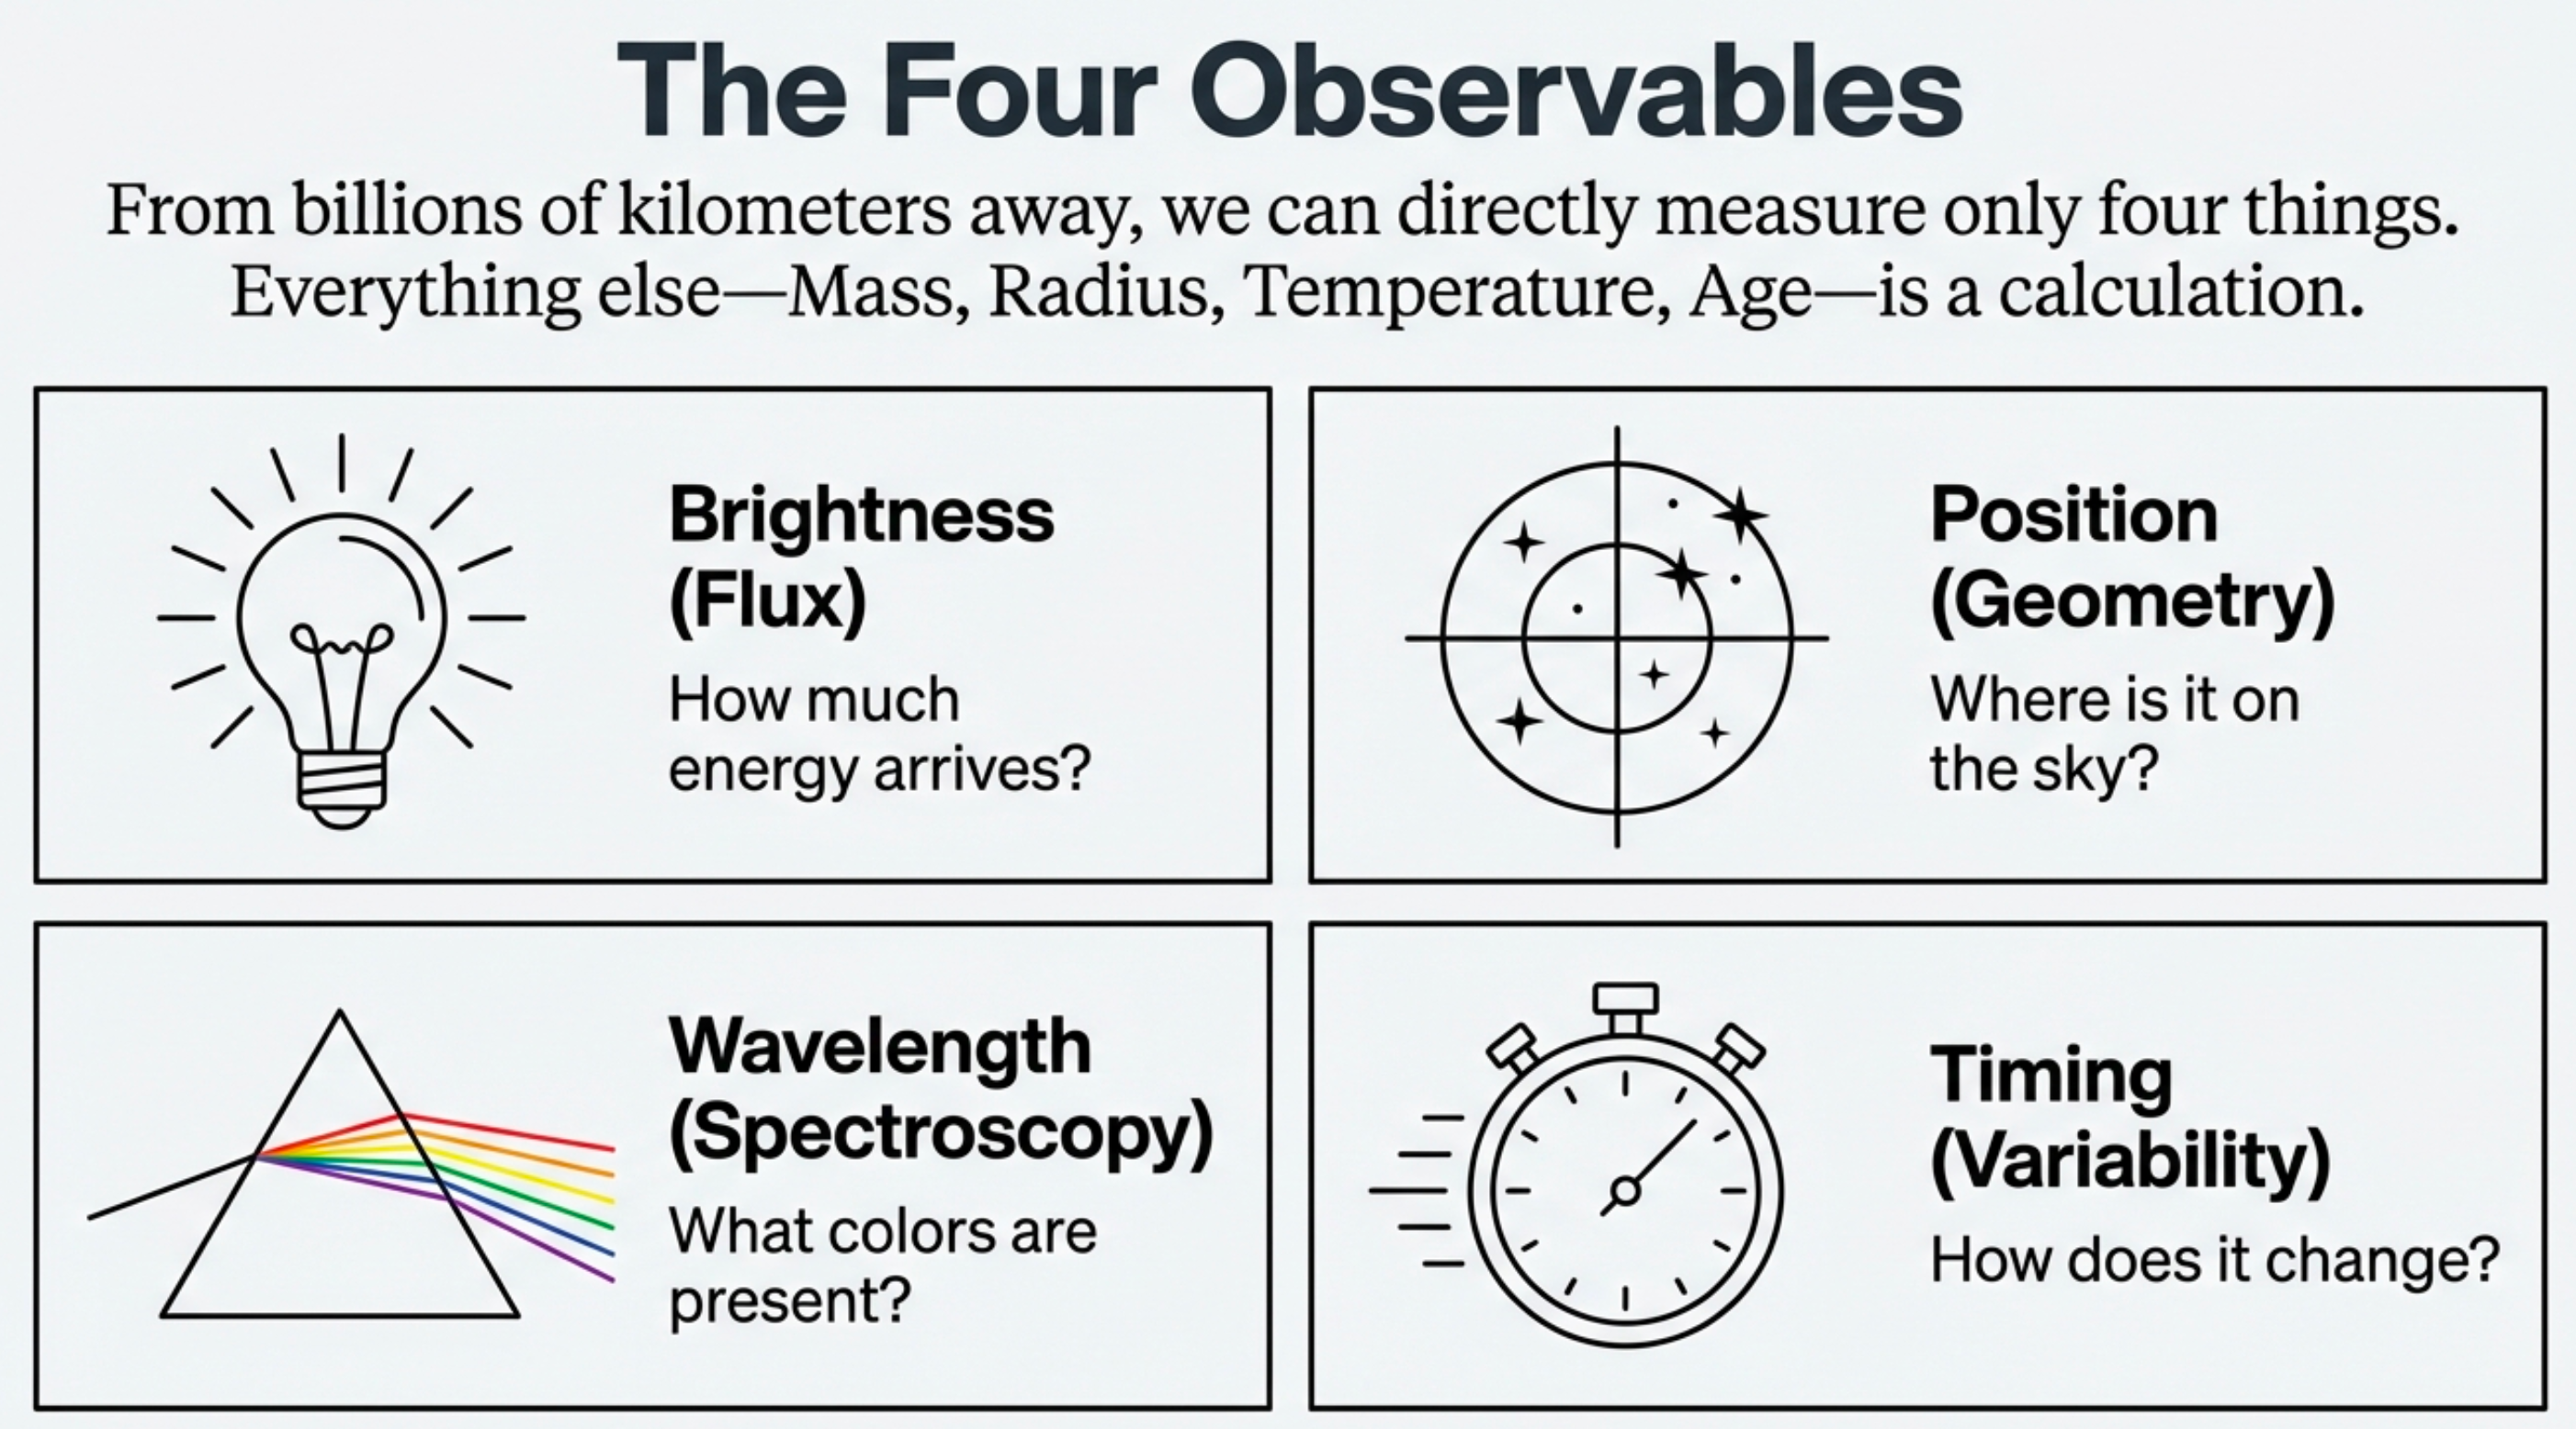
What to notice: From billions of kilometers away, we can directly measure only four things. Everything else—mass, radius, temperature, age—is a calculation. (Credit: (A. Rosen/NotebookLM))
An astronomer reports that a star’s light dims by 1% every 3.5 days like clockwork. Which of the four observables is being measured?
- Position
- Brightness
- Wavelength
- Mass
(b) Brightness. The star’s light “dims” — that’s a change in brightness. The “every 3.5 days” tells us about timing, but the quantity being measured is how much light arrives (brightness/flux). Mass is not directly measurable — it must be inferred.
Observable: A quantity that can be directly measured — brightness, position, wavelength. Astronomers have remarkably few types of observables; nearly everything else is inferred.
Brightness (also called flux) is the rate at which light energy arrives at your detector — photons per second per unit area. We count photons. This raw signal depends on two things we can’t disentangle from brightness alone: how luminous the source truly is, and how far away it is. A dim nearby candle and a brilliant distant lighthouse can appear equally bright.
Position is where an object appears on the sky, measured in angles. Position becomes powerful when we track changes: the annual wobble from Earth’s orbit (parallax), the slow drift across the sky (proper motion), or the periodic wobble caused by an unseen companion.
Wavelength is the key to spectroscopy. By spreading light into its component wavelengths, we transform a single brightness measurement into thousands of data points — brightness as a function of wavelength. This spectral information encodes temperature (through overall color), composition (through absorption and emission lines), and motion (through Doppler shifts).
Timing is both a measurement in its own right and a way to extract additional information from the other three. A star whose brightness varies periodically tells us something a constant star doesn’t. An object whose position shifts tells us about motion. Timing transforms static snapshots into dynamic movies.
What’s NOT on This List
Notice what you cannot directly measure:
| Property | How We Infer It |
|---|---|
| Temperature | From color/spectrum (hotter = bluer peak) |
| Composition | From spectral absorption/emission lines |
| Distance | From parallax, brightness + known luminosity, or other methods |
| Luminosity | From brightness + distance |
| Mass | From orbital motion (gravity reveals mass) |
| Size (radius) | From luminosity + temperature, or from eclipses |
| Age | From stellar evolution models |
Every single one of these fundamental properties must be inferred by combining measurements with physical models. The gap between “what we measure” and “what we want to know” is bridged by physics.
A star appears to wobble periodically in its position on the sky. Which observable is being measured?
- Brightness
- Position
- Wavelength
- Temperature
(b) Position. We measure where the star appears on the sky and track how that position changes over time. The “periodically” tells us timing is involved, but the observable itself is position. Temperature is not an observable — it’s inferred from wavelength measurements.
The Spoiler Reel
What follows is a tour through some of the most spectacular astronomical images humanity has captured. But we’re not just sightseeing. For each image, we’ll ask three questions:
- What do we measure?
- What do we infer?
- What physics makes that inference legal?
You are not expected to understand all the answers yet. That’s what the rest of the semester is for. Today, we’re giving you the spoilers — showing you where we’re headed. By the end of the course, you’ll have earned the right to say these things with confidence.
The pattern to watch for: Every spoiler follows the same structure: measurement \(\rightarrow\) model \(\rightarrow\) inference. By the end of this course, you’ll fill in the “what physics” part yourself.
Spoiler 1: Nebulae — Color as Encoded Physics
![Annotated nebula image showing three labeled features: (1) Hydrogen-Alpha at 656.3 nm in red regions indicating ionized gas, (2) Doubly-ionized Oxygen [OIII] at 500 nm in blue-green regions indicating extremely low density, (3) Dark Lanes showing silhouettes of interstellar dust blocking the light.](../../../assets/images/module-01/forensic-analysis-of-a-nebula-nblm.png)
What to notice: Colors aren’t decoration—they’re encoded physics. Red = hydrogen (656 nm), blue-green = oxygen (500 nm), dark lanes = dust blocking light. (Credit: (A. Rosen/NotebookLM))
What do we measure? Structured colors at specific wavelengths. Red light at 656 nm. Blue-green light at 496–501 nm. Dark regions where light is blocked.
What do we infer? The red regions contain hydrogen gas heated and ionized by nearby hot stars. The blue-green regions contain oxygen. The dark lanes contain dust — tiny solid particles that absorb and scatter starlight.
What physics makes this legal? Atoms emit light at specific wavelengths, not random colors. Each element has a unique “fingerprint” of wavelengths determined by its atomic structure. When we see red light at exactly 656 nm, we know hydrogen is present.
Key insight: Color isn’t decoration — it’s encoded physics. Specific wavelengths = specific atoms = specific conditions.
Spoiler 2: The Distance Ladder — How Far Is Far?
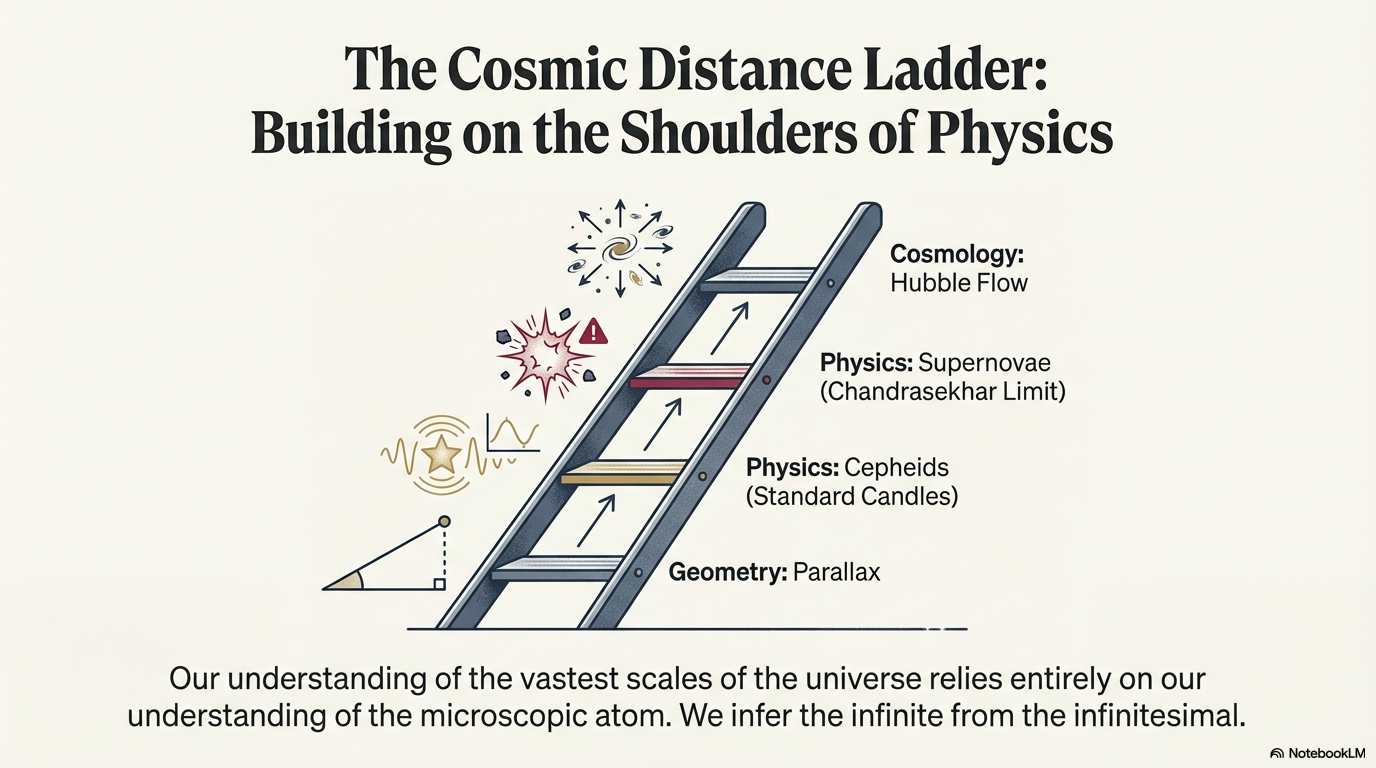
What to notice: Each rung calibrates the next. Parallax (geometry) → Cepheids (standard candles) → Supernovae (Chandrasekhar limit) → Hubble Flow (cosmology). We infer the infinite from the infinitesimal. (Credit: (A. Rosen/NotebookLM))
What do we measure? Apparent brightnesses of certain “milepost” objects — stars that pulsate in predictable ways, or stellar explosions that reach consistent peak brightness.
What do we infer? Distances far beyond what geometry alone can reach — out to billions of light-years.
What physics makes this legal? If you know how bright something truly is (its luminosity) and measure how bright it appears (its flux), the inverse-square law lets you calculate distance.
Standard candle: An object whose intrinsic luminosity can be determined independently (from pulsation period, spectral type, or explosion physics), allowing distance to be calculated from observed brightness.
Light spreads out as it travels. At distance \(d\), light from a source spreads over a sphere with surface area \(4\pi d^2\). The same total light now covers a larger area, so the flux (light per unit area) decreases:
\[ F = \frac{L}{4\pi d^2} \]
where:
- \(F\) = flux, what we measure \((W/m^{2})\)
- \(L\) = luminosity, what the star emits (W)
- \(d\) = distance (m)
The key insight: Flux falls off as \(1/d^2\). Double the distance \(\rightarrow\) quarter the brightness. If you know \(L\) (from a “standard candle”) and measure \(F\), you can solve for \(d\).
Quick example: If Star B appears \(4\times\) fainter than identical Star A, Star B must be \(2\times\) farther away (because \(2^2 = 4\)).
Spoiler 3: Spectroscopy — The Master Key
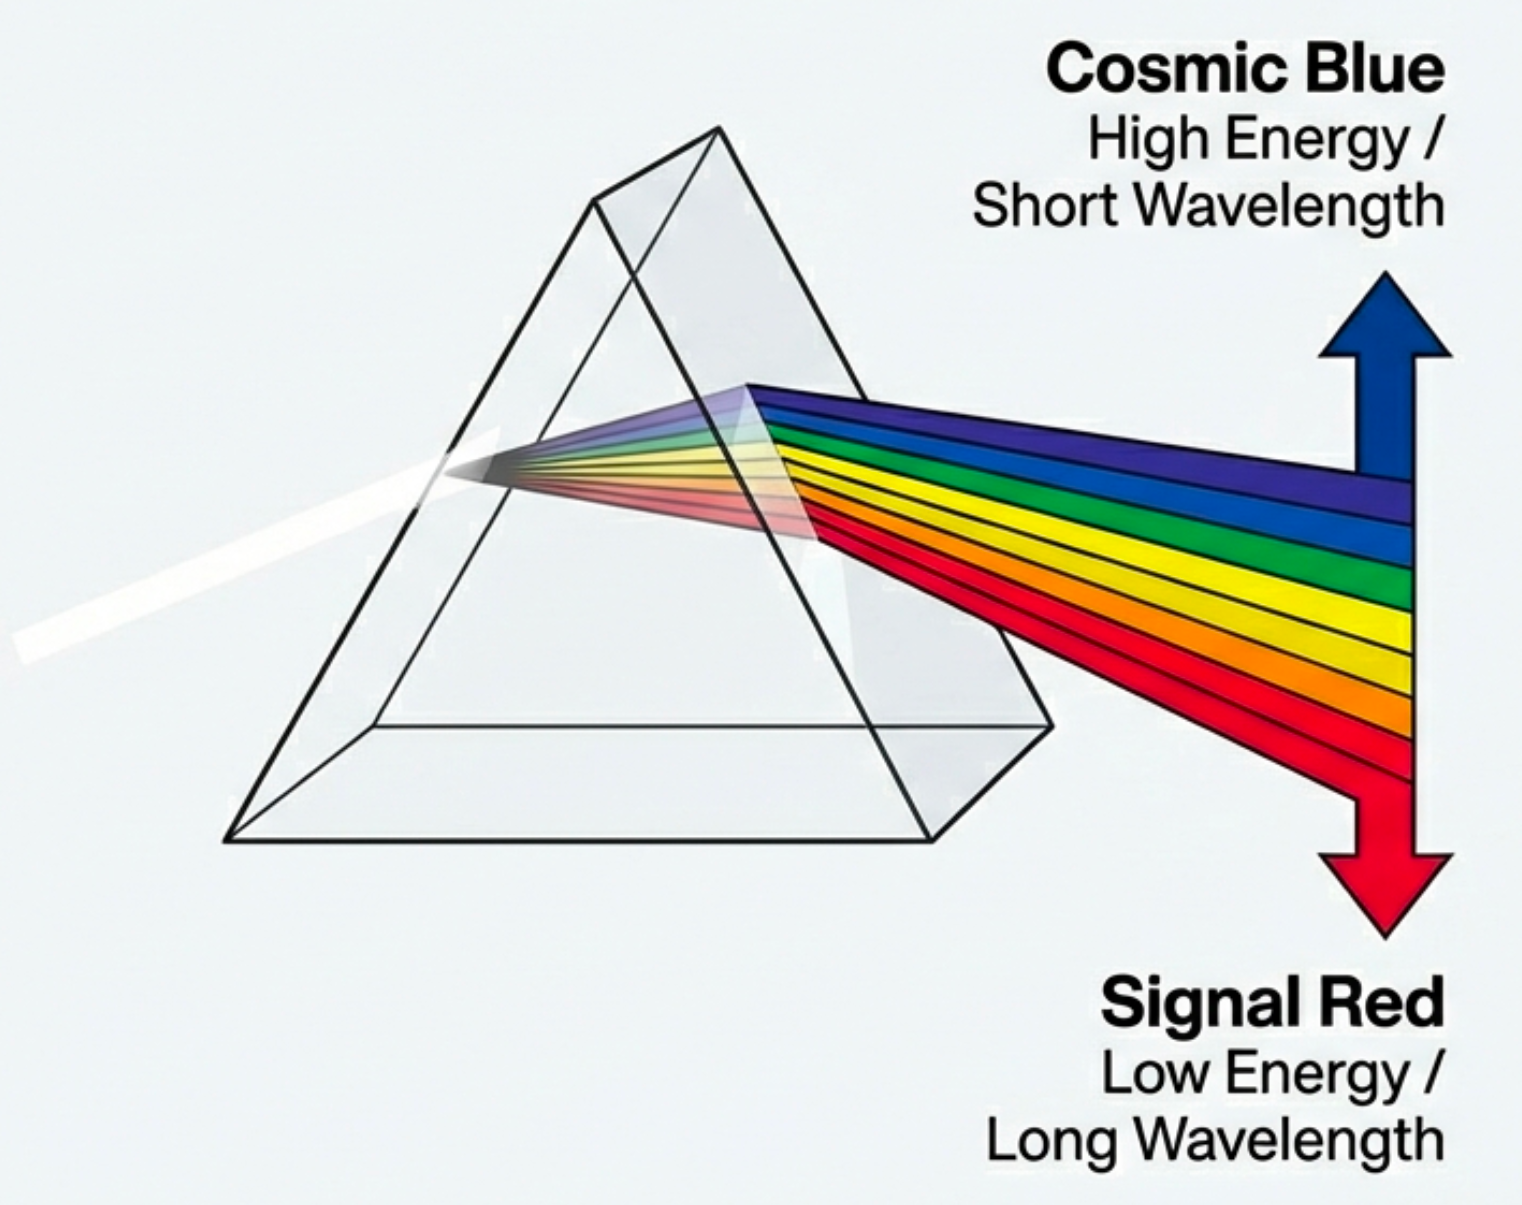
What to notice: A prism reveals that ‘white’ light contains many wavelengths. Blue bends more (shorter λ, higher energy); red bends less (longer λ, lower energy). (Credit: (A. Rosen/NotebookLM))
What do we measure? When “white” light passes through a prism, it spreads into a rainbow — each color corresponding to a different wavelength.
What do we infer? Light contains many wavelengths simultaneously. “White” is a mixture.
What physics makes this legal? Different wavelengths travel at different speeds through glass, causing them to bend by different amounts and separate spatially.
Why this matters: A prism doesn’t just make rainbows — it gives you the power to decode what’s hidden inside light. This is spectroscopy, and it’s the most powerful tool in the astronomer’s toolkit.
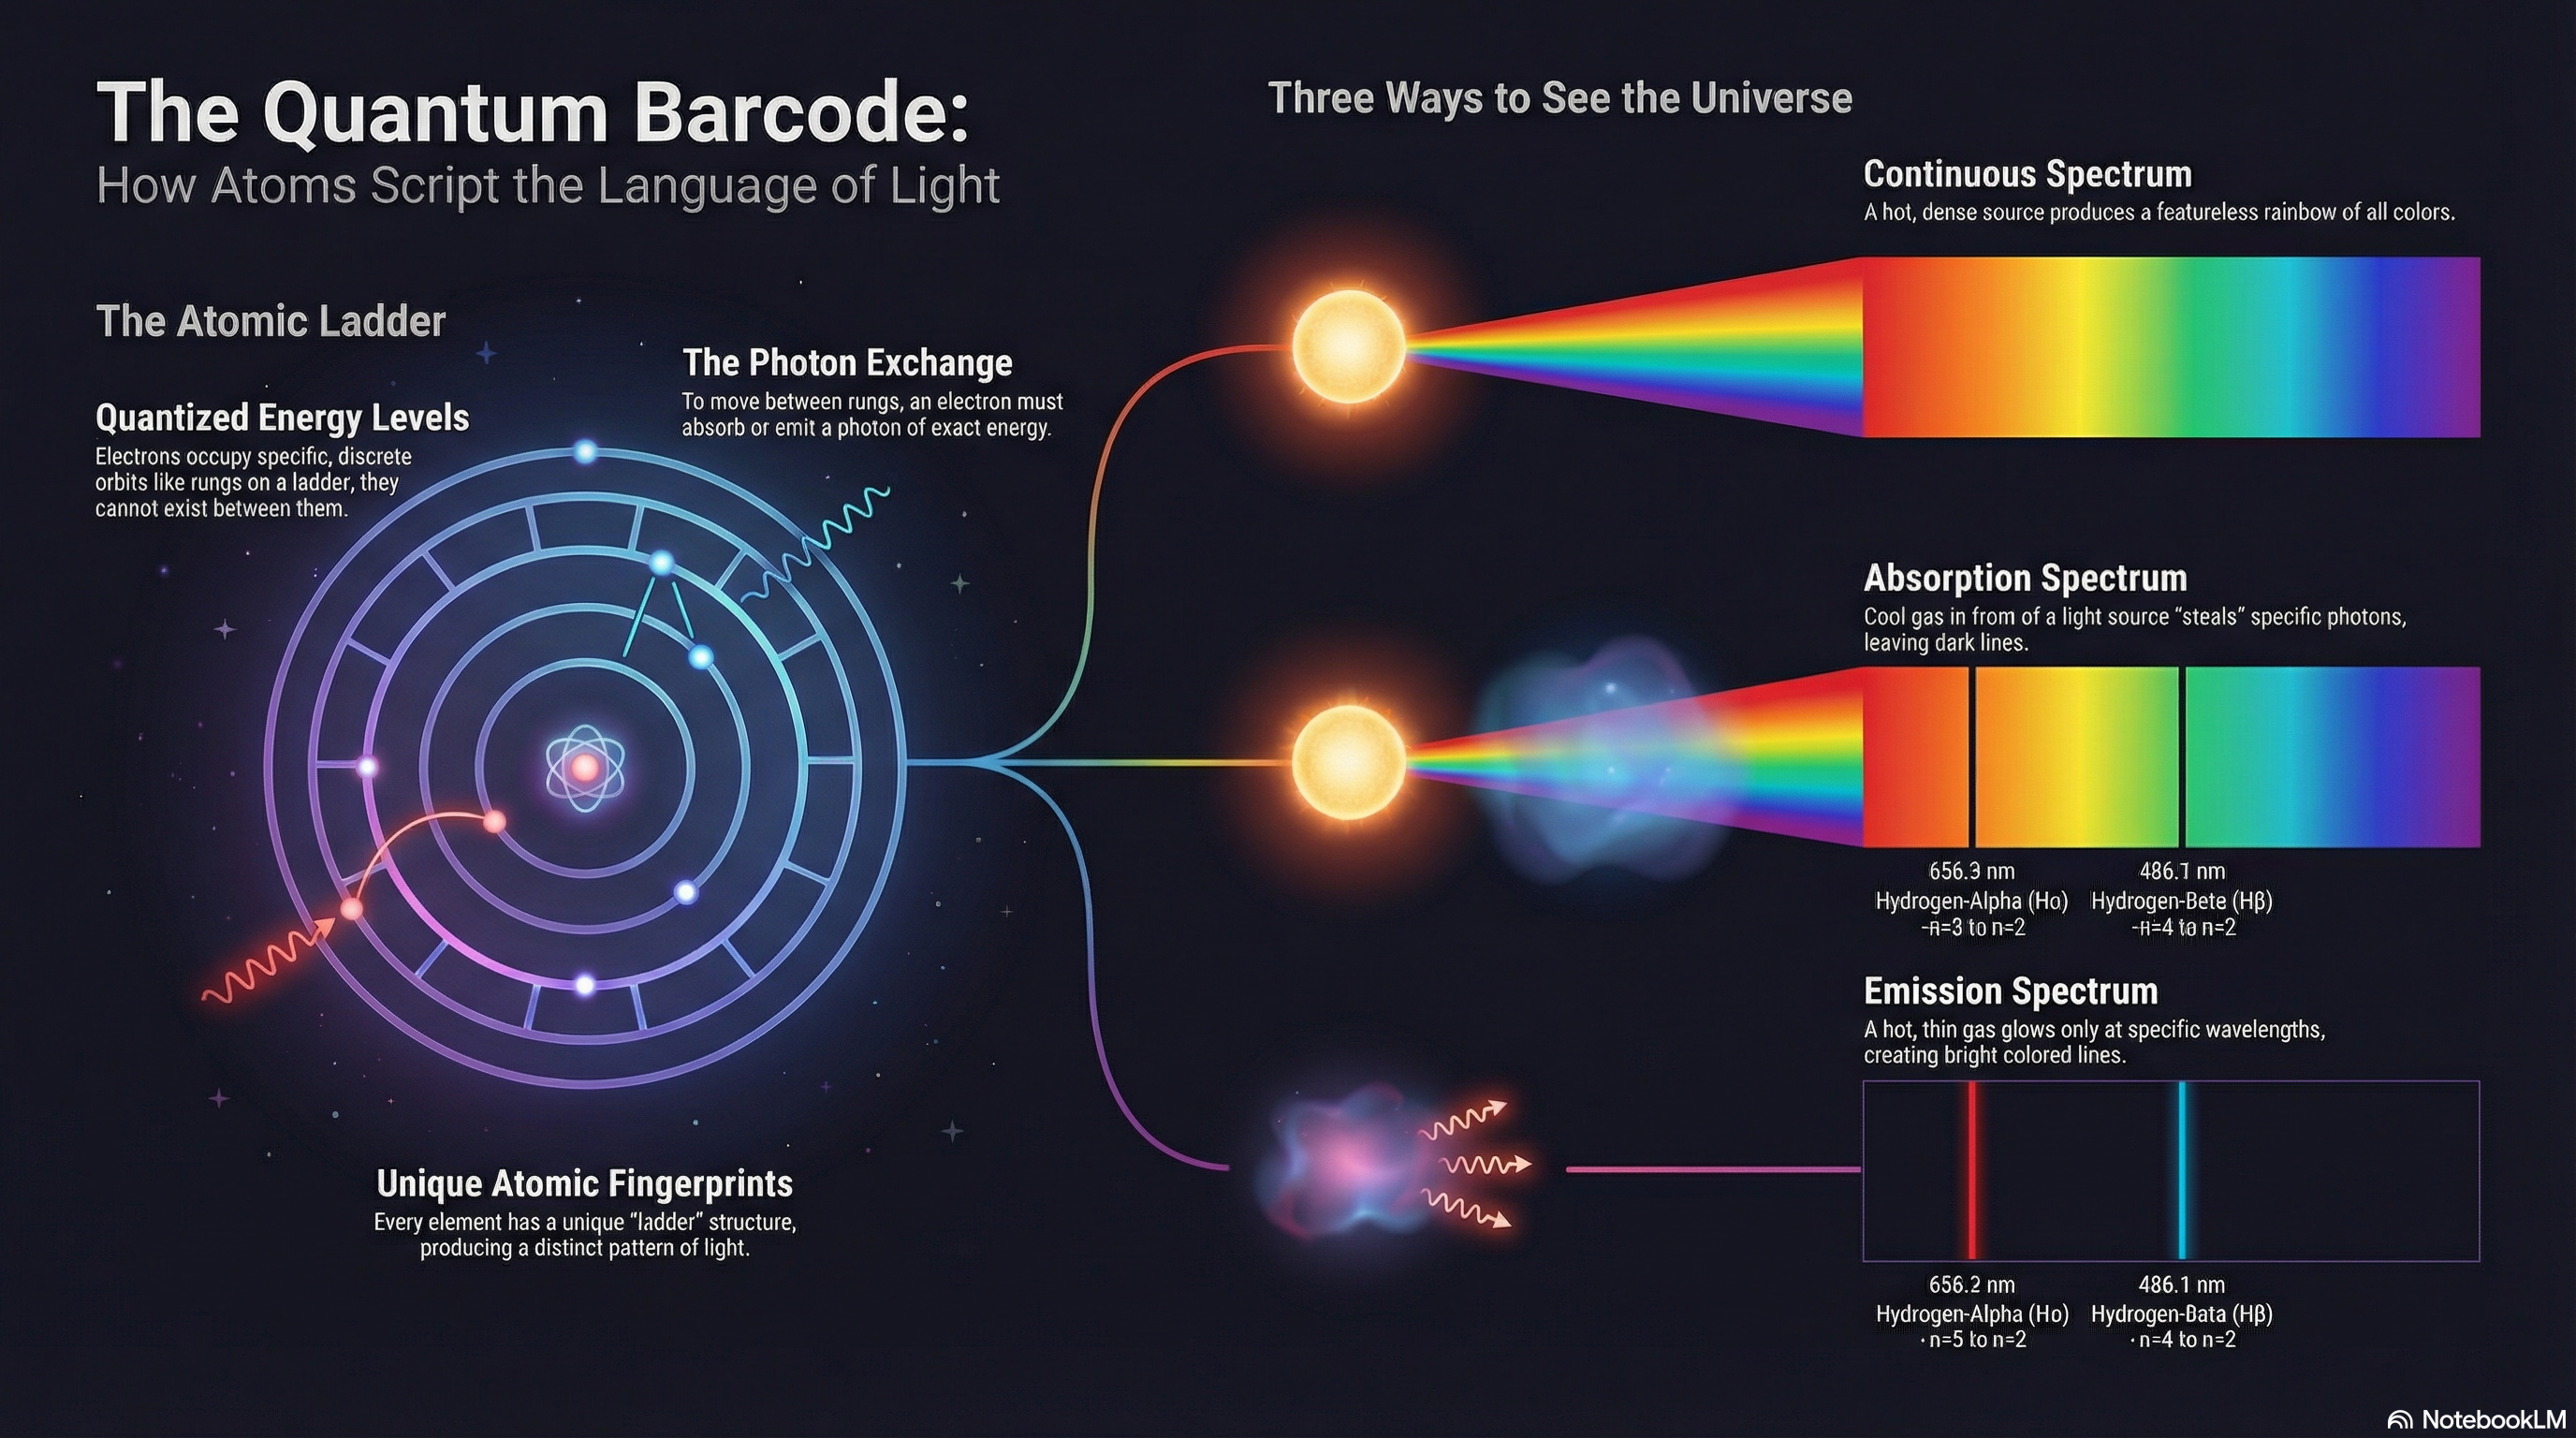
What to notice: Atoms have quantized energy levels like rungs on a ladder. Electrons jumping between rungs absorb or emit photons of exact energies—creating unique spectral fingerprints. Hot dense sources produce continuous spectra; cool gas in front absorbs specific wavelengths; hot thin gas emits specific wavelengths. (Credit: (A. Rosen/NotebookLM))
Why do atoms produce light at specific wavelengths rather than a continuous rainbow? The answer is quantum mechanics: electrons in atoms can only occupy certain discrete energy levels. When an electron jumps between levels, it absorbs or emits a photon of exactly the right energy — and energy determines wavelength. Each element’s unique ladder of energy levels creates its unique spectral fingerprint.
Why is spectroscopy more powerful than just measuring total brightness?
Total brightness gives you one number. Spectroscopy spreads light into its component wavelengths, giving you thousands of data points — brightness as a function of wavelength. This reveals:
- Temperature (from the overall color/peak wavelength)
- Composition (from absorption and emission lines at specific wavelengths)
- Motion (from Doppler shifts of spectral lines)
One measurement vs. a wealth of encoded physics.
Spoiler 4: Same Galaxy, Different Physics
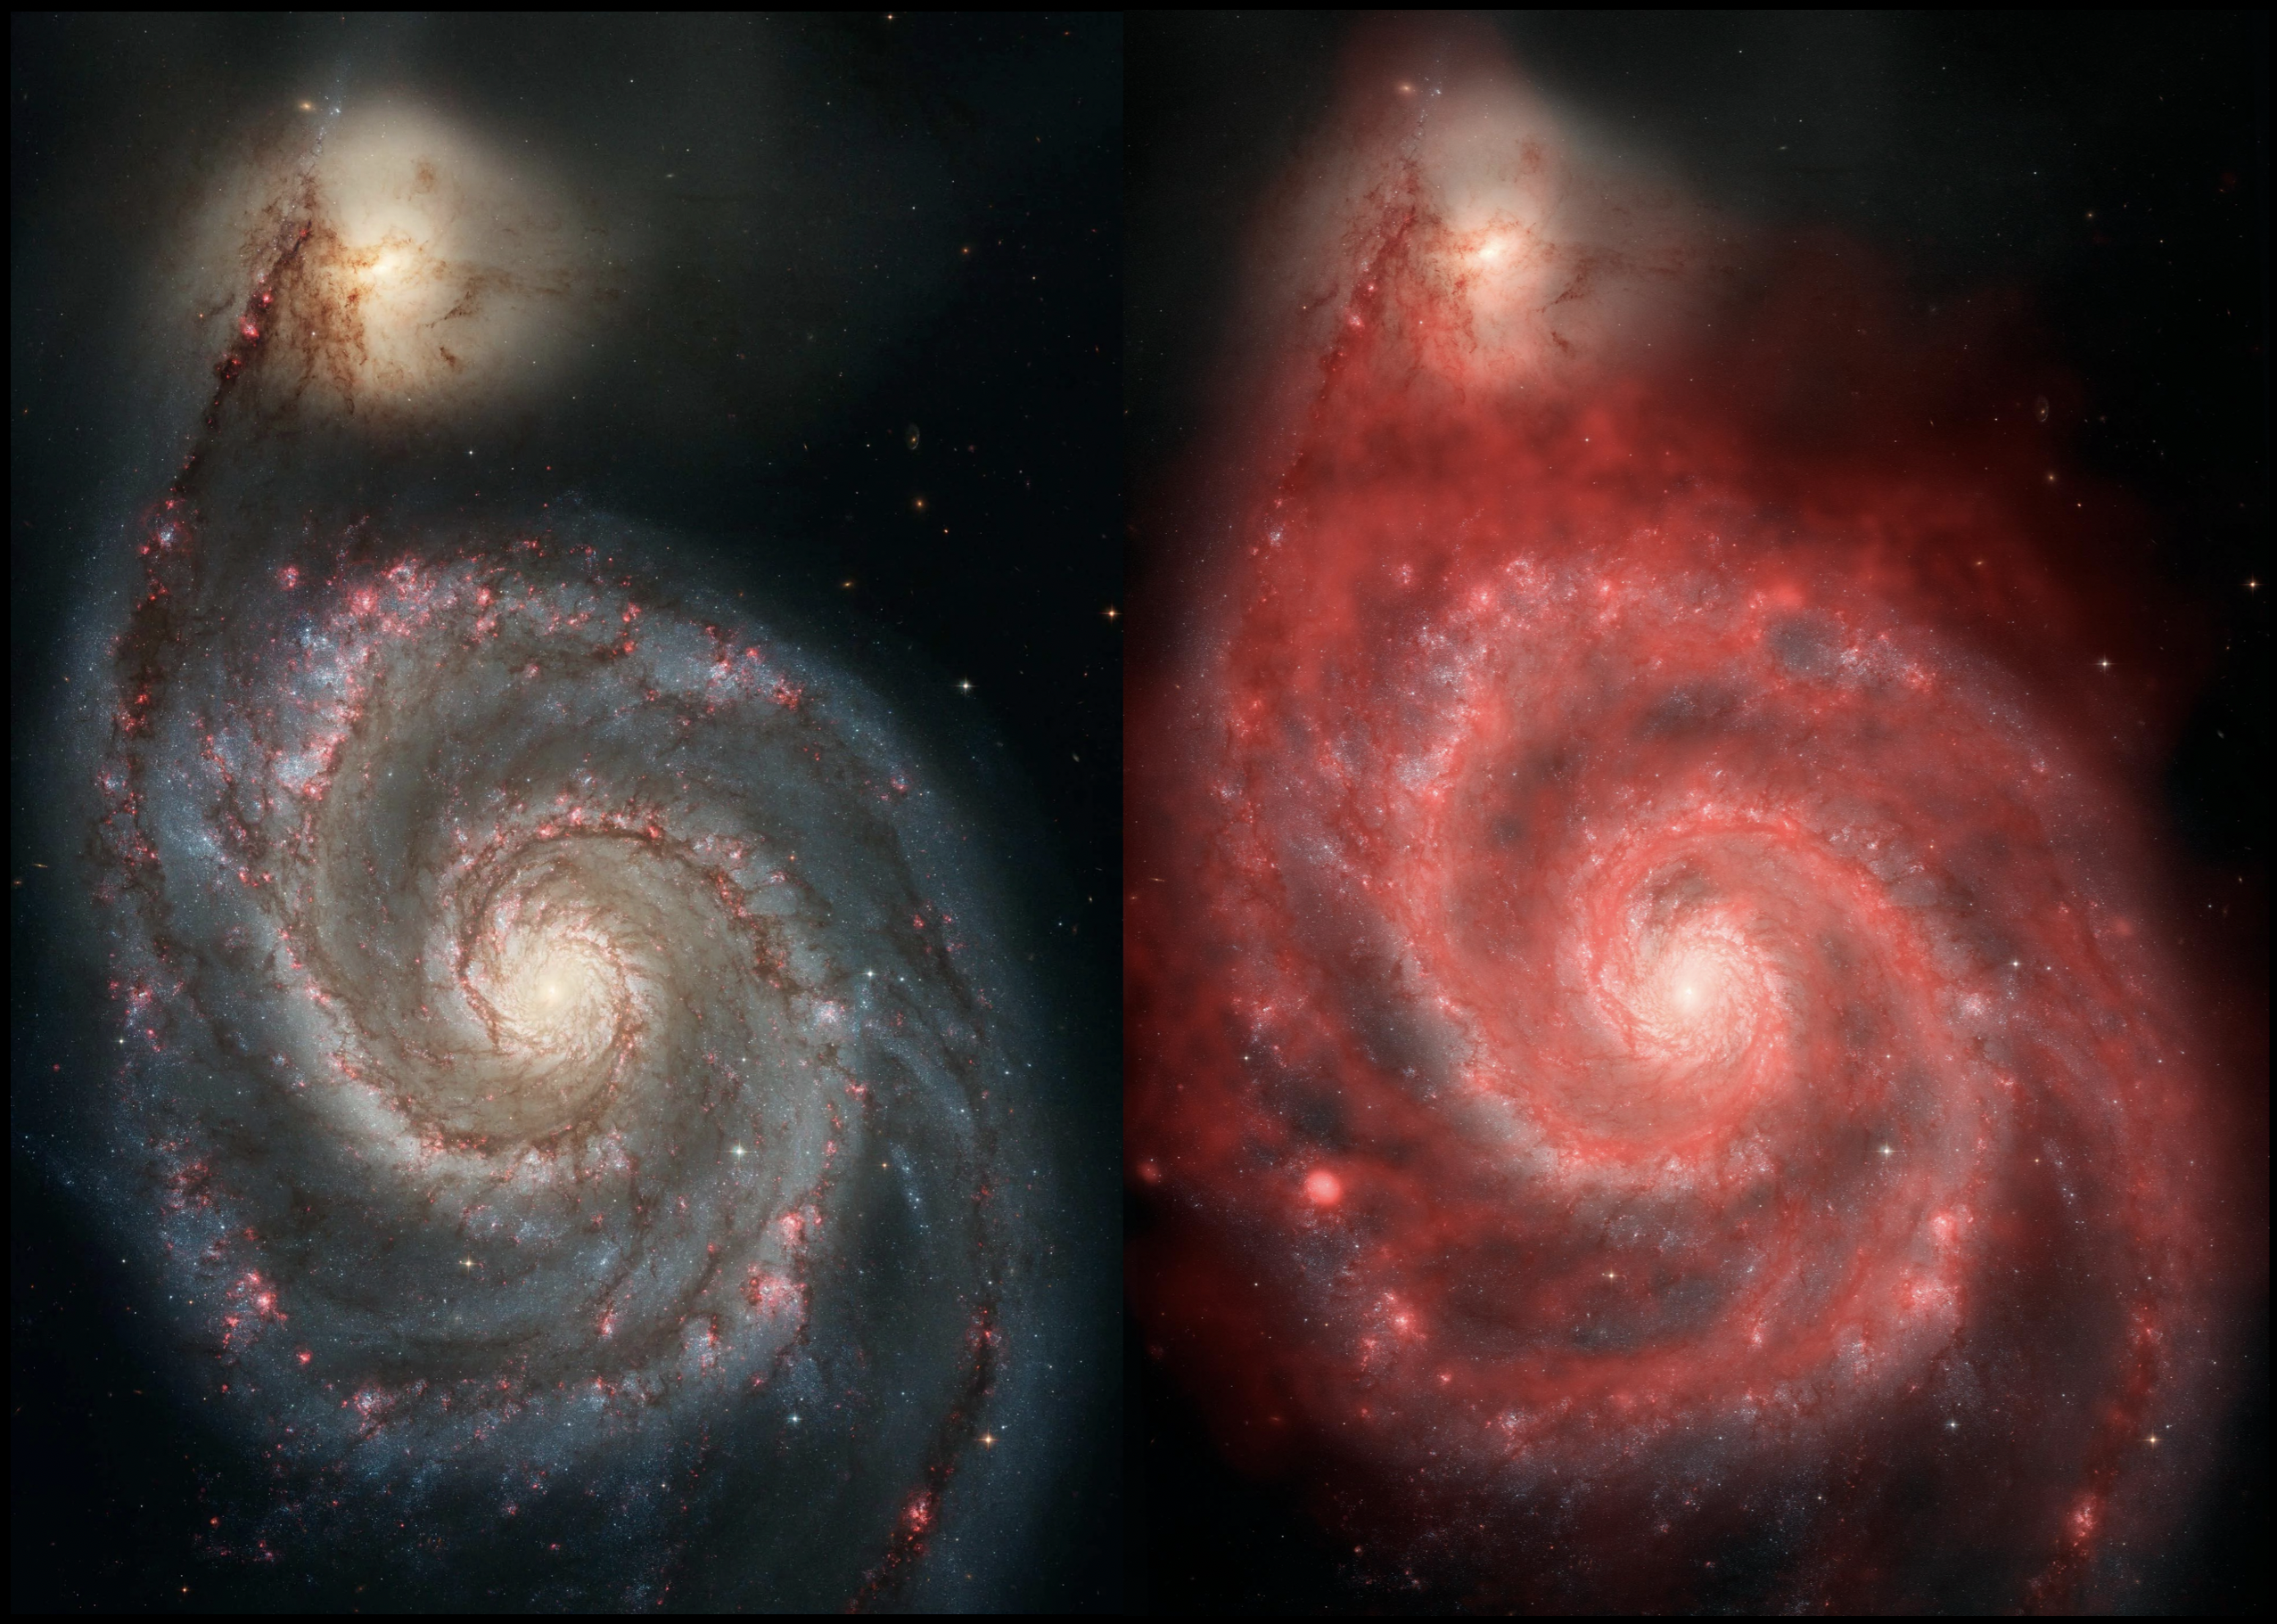
What to notice: Left (optical) shows stars and dust lanes. Right (radio/21-cm) shows cold neutral hydrogen gas. The distributions don’t perfectly overlap—different wavelengths reveal different physical components. (Credit: NASA/ESA/STScI/AURA (Optical); NRAO/AUI (Radio))
What do we measure? Optical starlight (~500 nm) from one observation; radio emission at 21 cm from another.
What do we infer? The optical image shows where the stars are. The radio image shows where cold hydrogen gas lives. They don’t perfectly overlap.
What physics makes this legal? Stars emit thermal radiation from their hot surfaces (peaks in visible). Neutral hydrogen emits at exactly 21 cm due to a quantum mechanical transition in cold atomic gas.
Key insight: Same object + different wavelength = different physical component revealed.
Spoiler 5: Pillars of Creation — Infrared Beats Dust
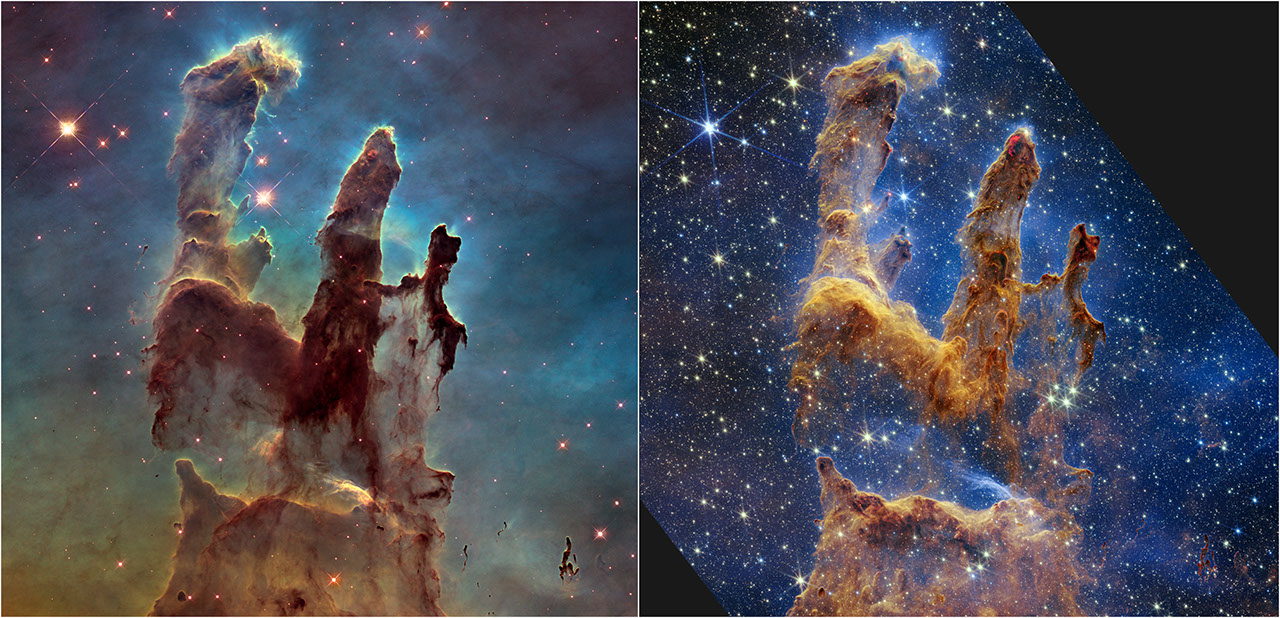
What to notice: Left (Hubble optical)—dark, opaque columns block visible light. Right (JWST infrared)—thousands of embedded newborn stars revealed. Infrared penetrates the dust that blocks optical light. (Credit: Illustration: NASA, ESA, CSA)
What do we measure? Optical: dark pillars. Infrared: thousands of previously hidden stars.
What do we infer? Dust strongly blocks visible light but is transparent at infrared wavelengths. The “empty” dark regions are teeming with newborn stars.
What physics makes this legal? Dust grains (~0.01–\(1 \mu\mathrm{m}\)) efficiently absorb and scatter light with comparable wavelengths. Longer wavelengths (infrared) pass through.
JWST’s superpower: At ~\(2 \mu\mathrm{m}\) wavelength, dust absorbs roughly \(10\times\) less light than at visible wavelengths. JWST peers through cosmic dust that blocks Hubble.
Key insight: What you can’t see at one wavelength might be brilliantly visible at another.
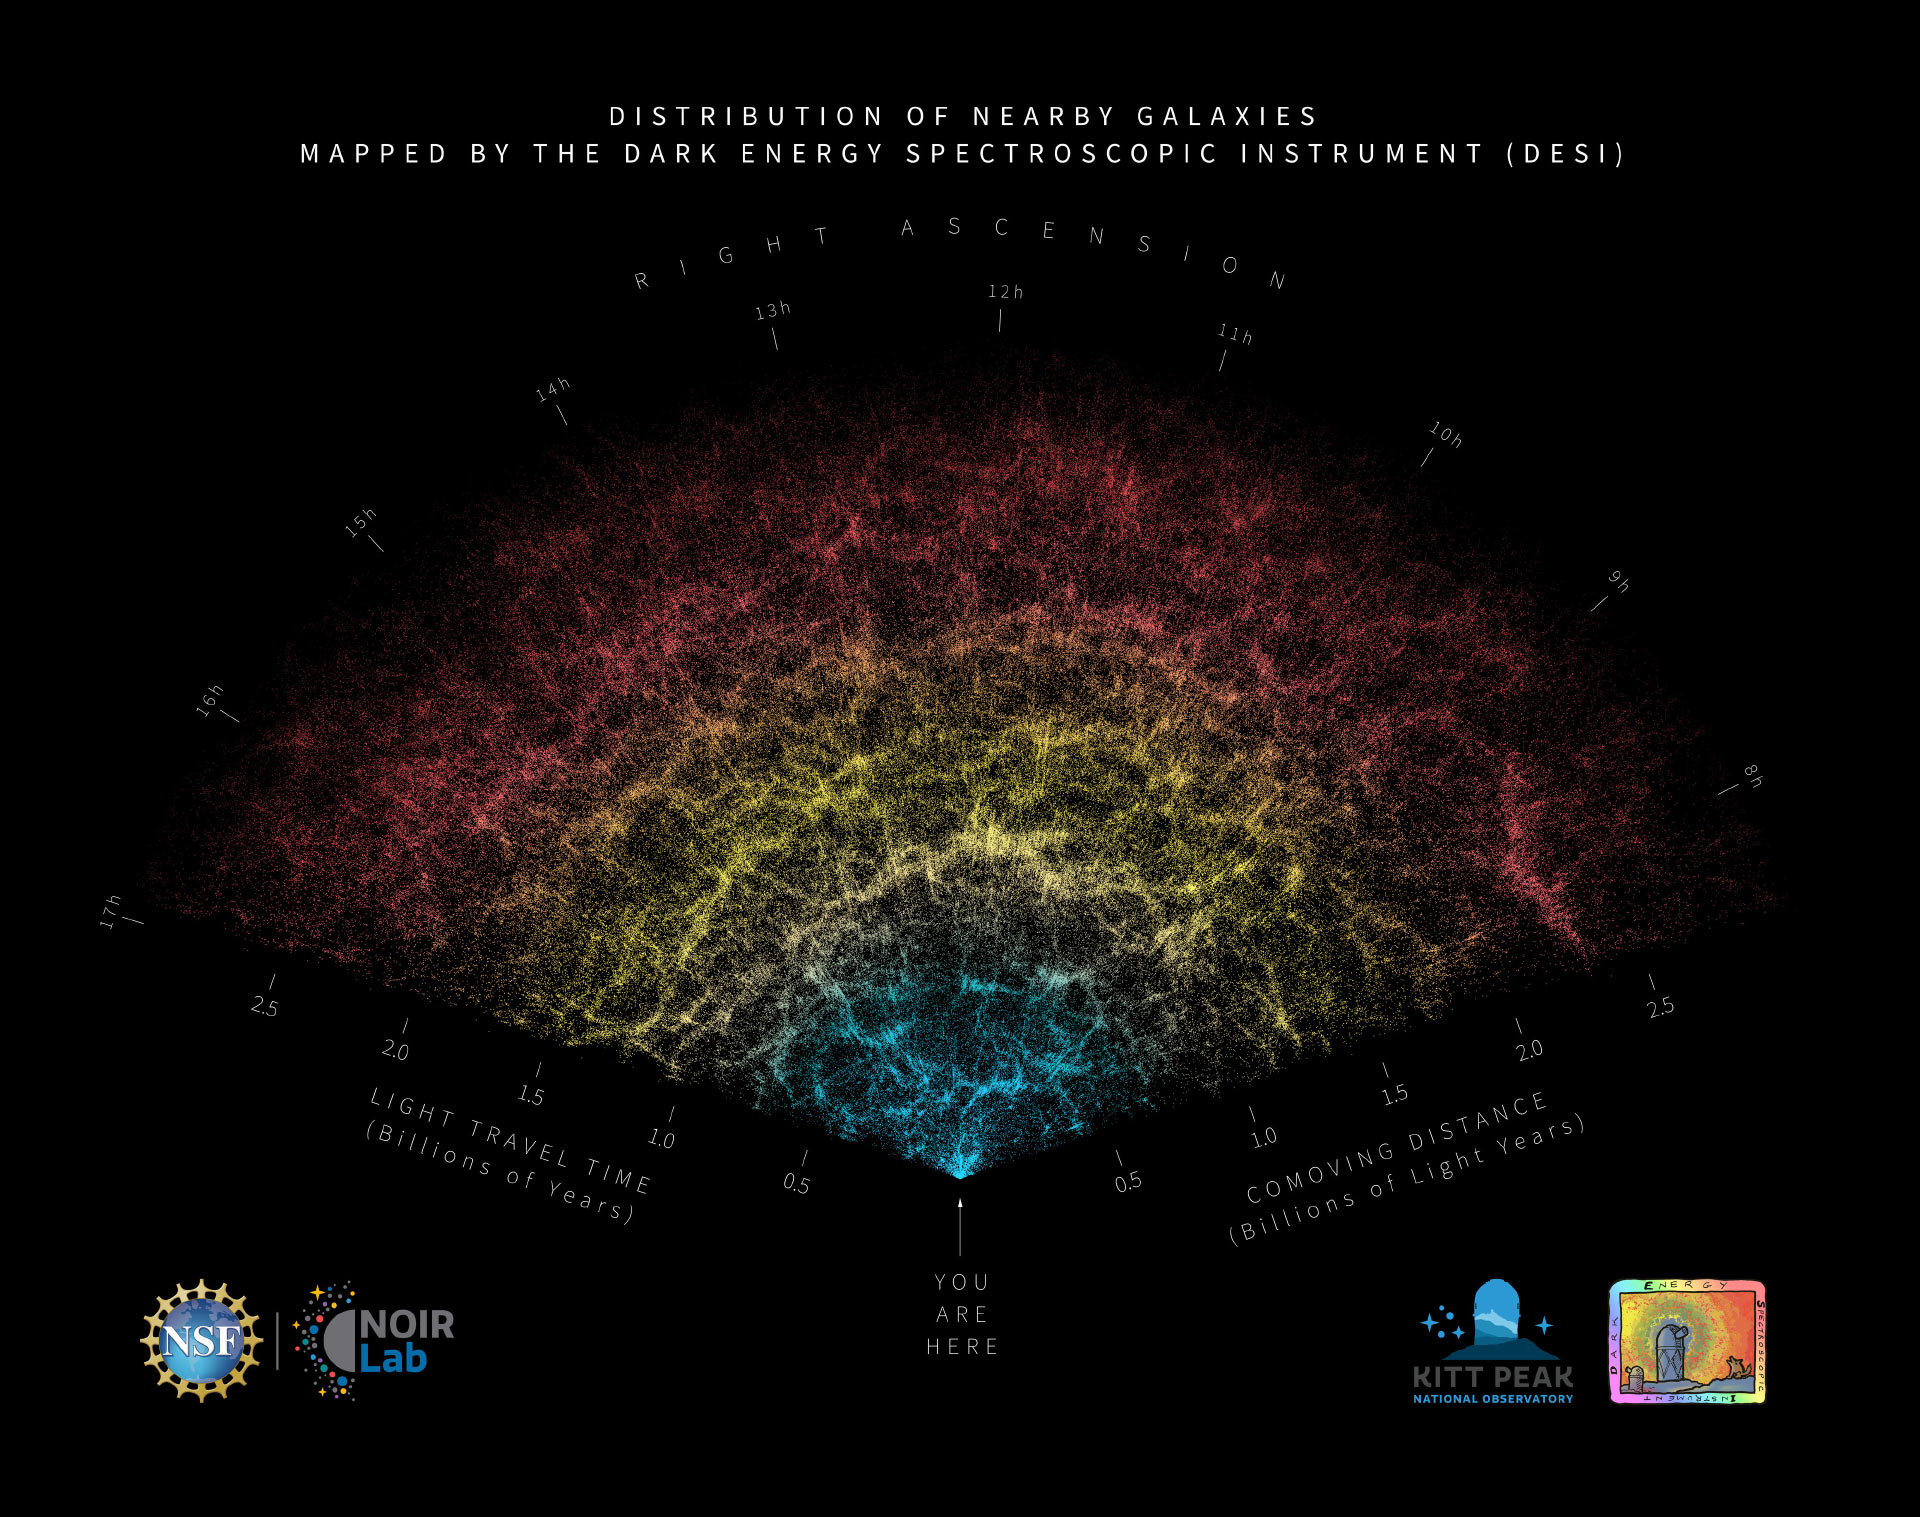
Spoiler 7: Cosmic History — 13.8 Billion Years and Accelerating
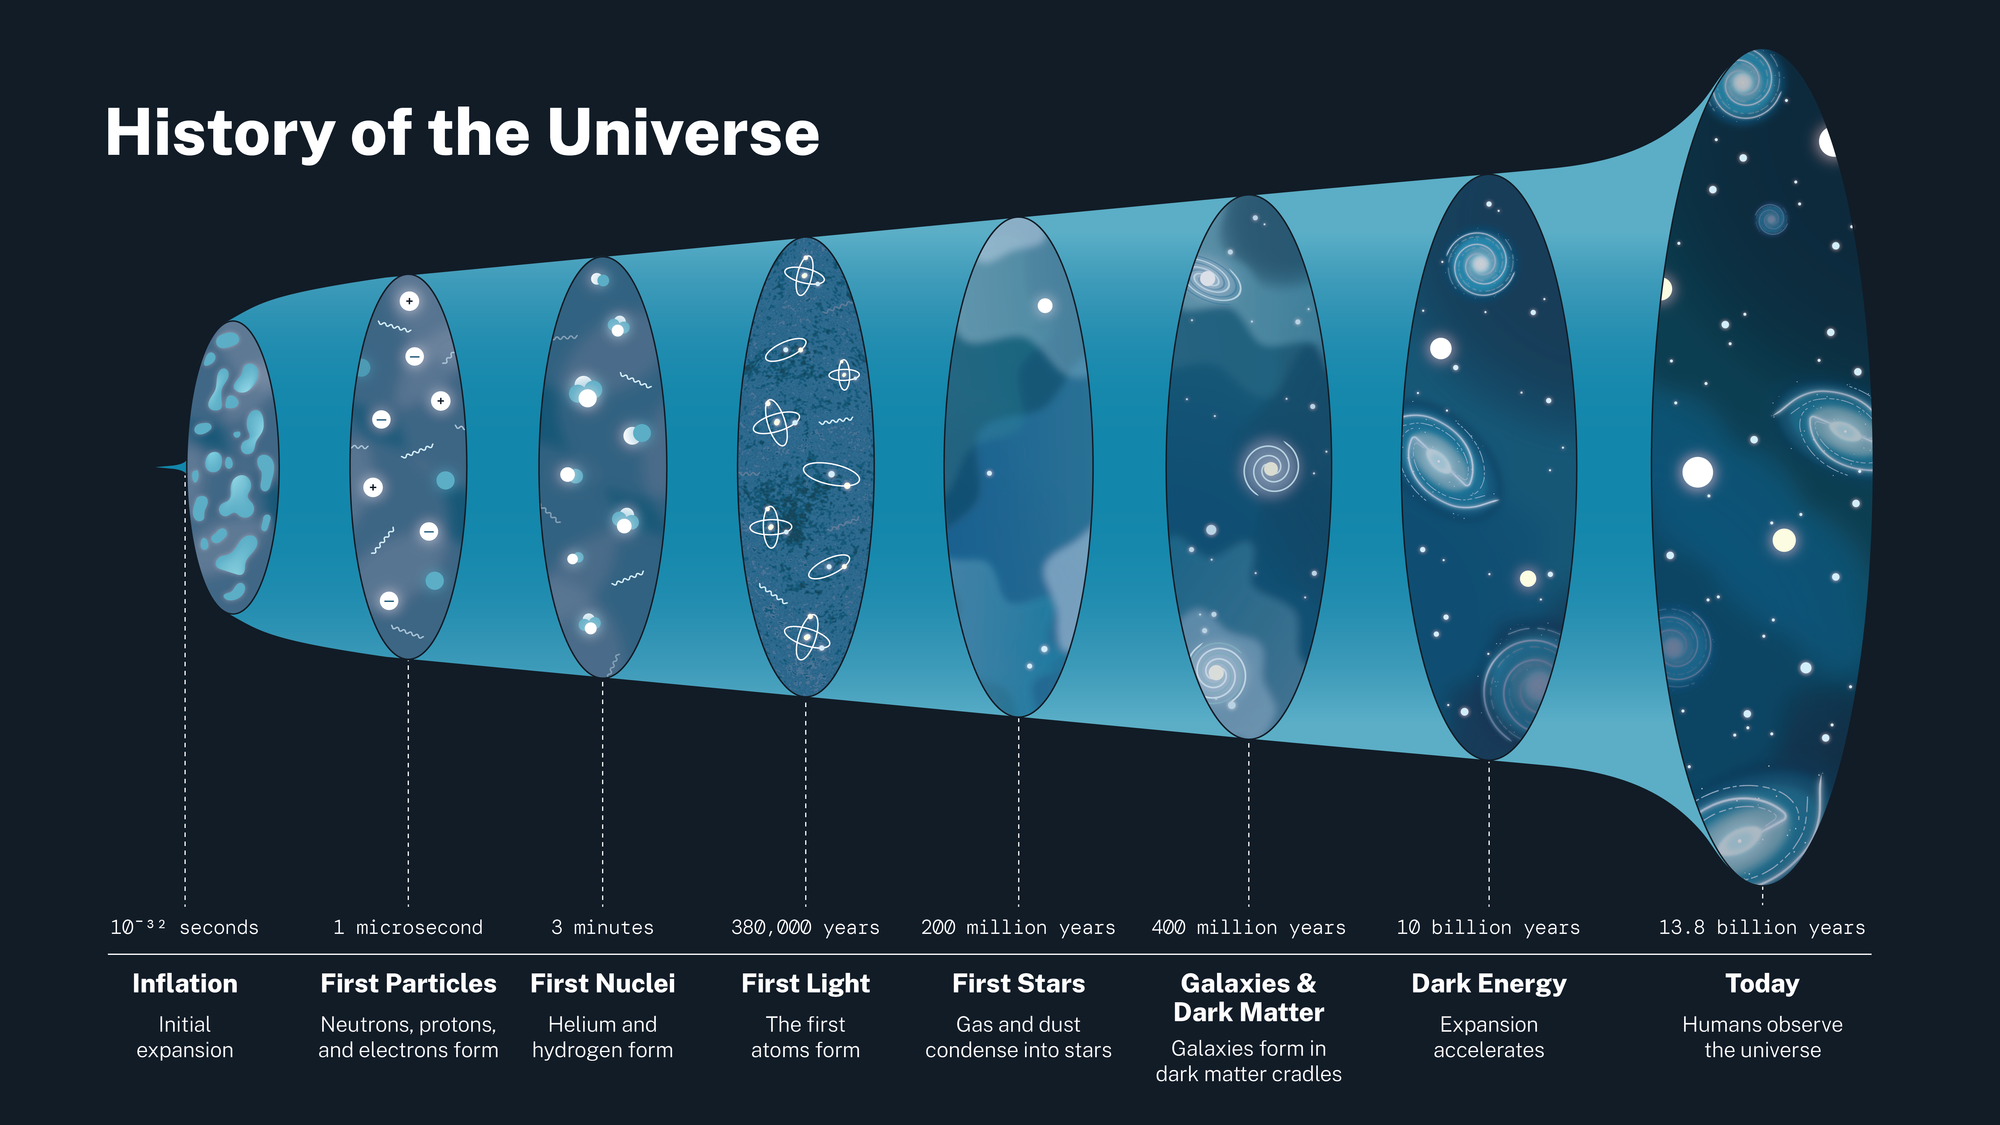
What to notice: The universe has a history. Inflation (10⁻³² s) → First Particles (1 μs) → First Nuclei (3 min) → First Light (380,000 yr) → First Stars (200 Myr) → Galaxies (400 Myr) → Dark Energy (10 Gyr) → Today (13.8 Gyr). (Credit: NASA)
What do we measure? Distances to objects across cosmic history (using the distance ladder) and their recession speeds (through redshift — the Doppler shift of their spectral lines).
What do we infer?
- The universe is 13.8 billion years old — traced back from the observed expansion rate.
- The expansion was initially slowing down (gravity pulling matter together), but about 5 billion years ago, it started speeding up.
- Something is pushing the universe apart faster and faster. We call it dark energy.
What physics makes this legal? If you know how fast galaxies are receding and how far away they are, you can “run the movie backward” to find when everything was in the same place — the Big Bang.
The acceleration was discovered in 1998 by measuring Type Ia supernovae at large distances. These standard candles appeared fainter than expected — meaning farther away than a decelerating universe would predict. The universe’s expansion is speeding up, not slowing down.
The cosmic distance ladder works in steps, each rung calibrating the next:
Radar (Solar System): Bounce radio waves off planets; measure round-trip time \(\rightarrow\) distance directly
Parallax (nearby stars): Measure apparent shift as Earth orbits Sun \(\rightarrow\) geometry gives distance (works to ~100 parsecs)
Cepheid variables (nearby galaxies): Pulsating stars whose period correlates with luminosity; measure period \(\rightarrow\) infer luminosity \(\rightarrow\) calculate distance
Type Ia supernovae (distant universe): Thermonuclear explosions of white dwarfs with consistent peak luminosity \(\rightarrow\) visible across billions of light-years
Each rung calibrates the next. Parallax calibrates Cepheids; Cepheids calibrate Type Ia supernovae. This is how we reach across the cosmos — one calibration at a time.
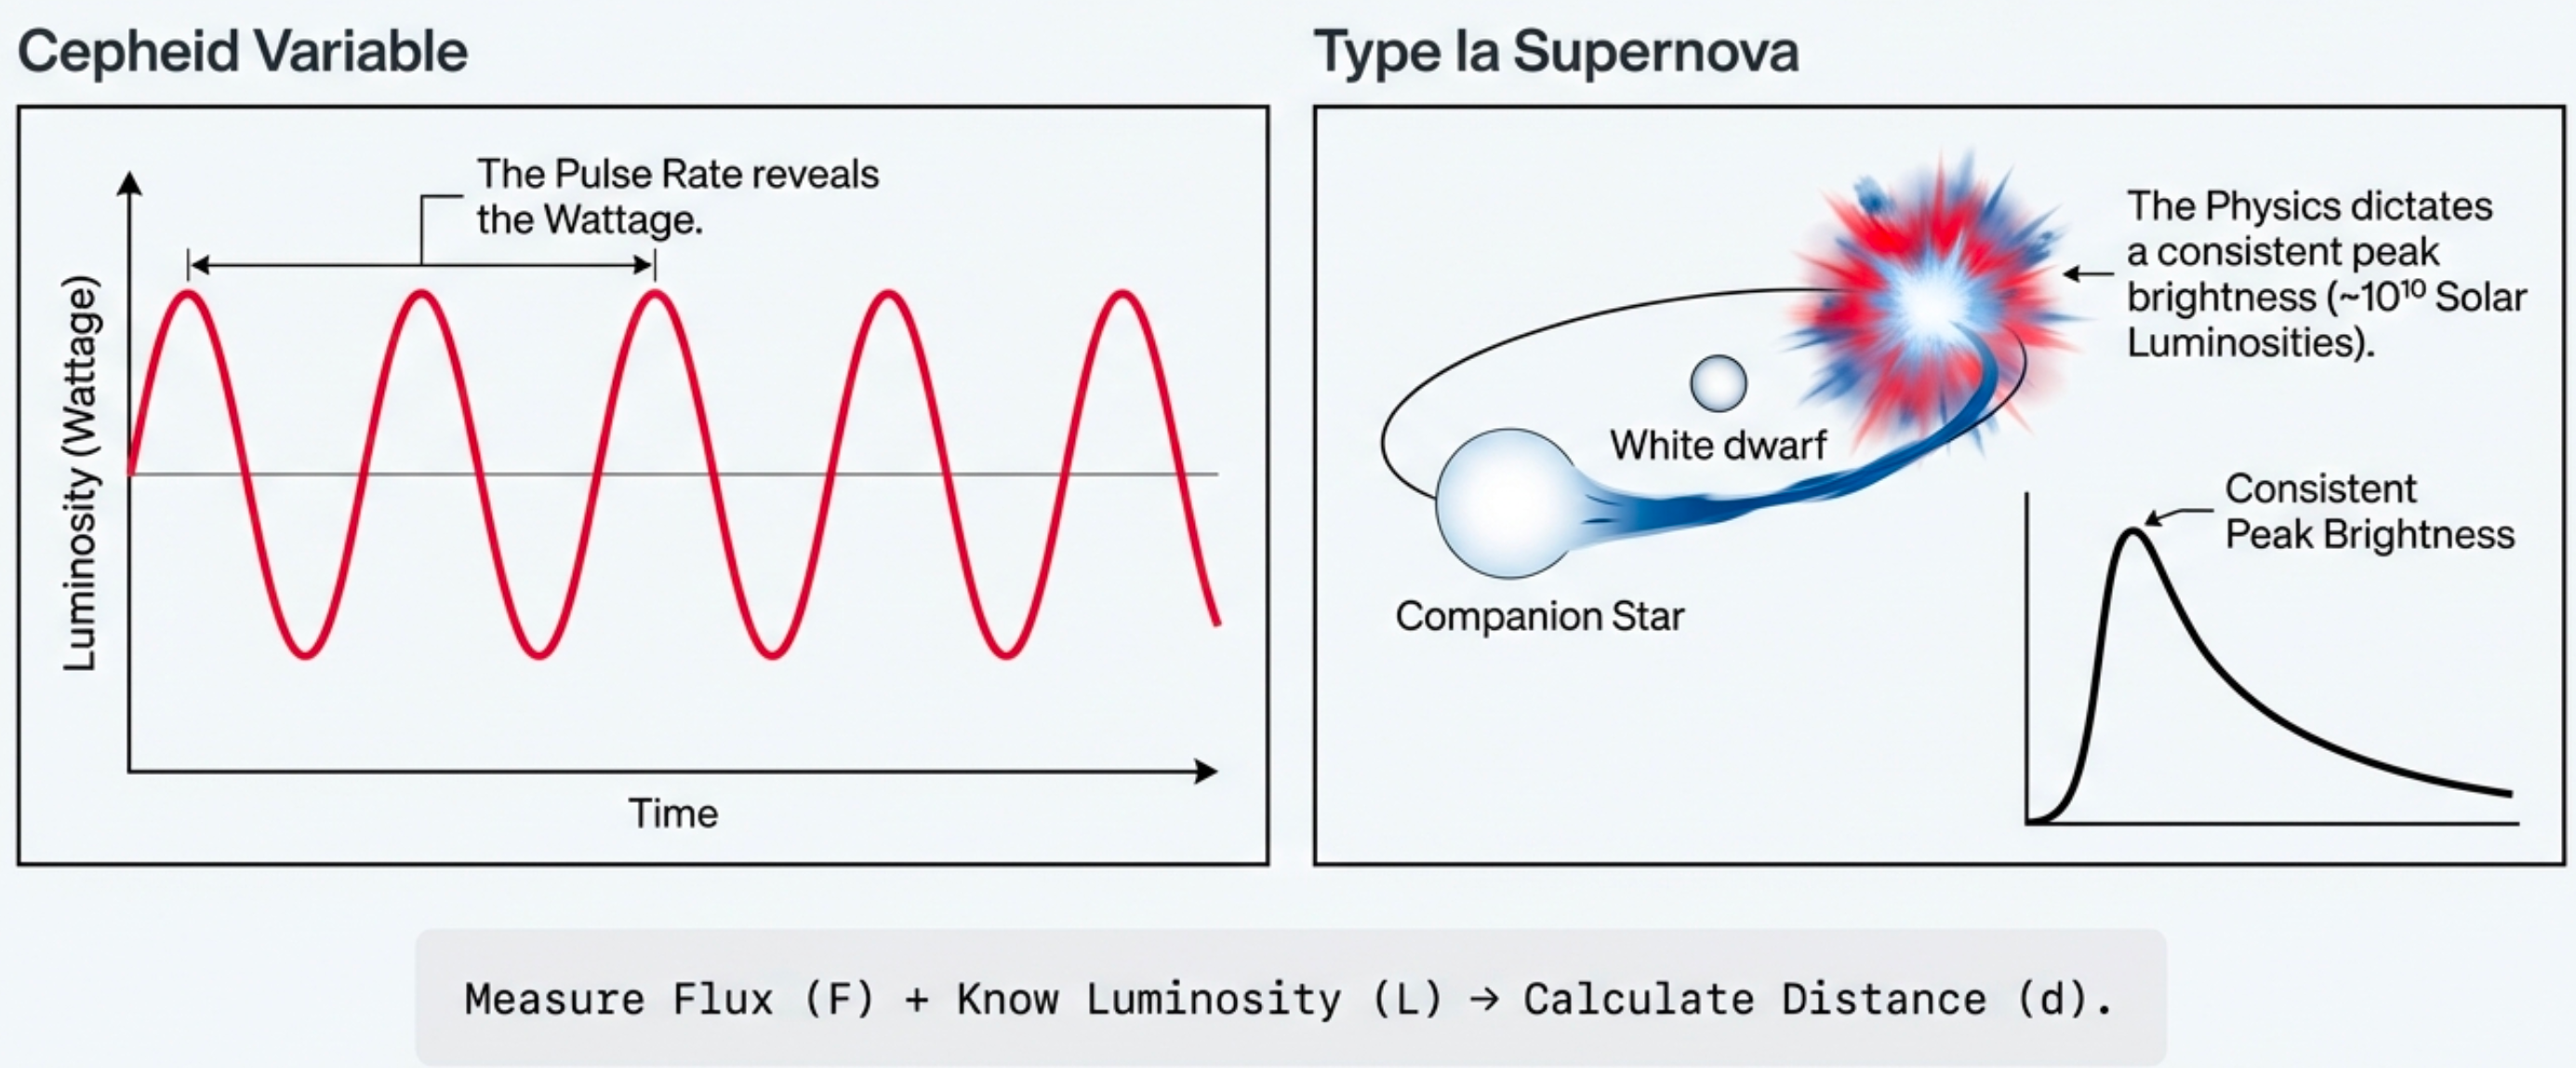
What to notice: Standard candles work because physics predicts their luminosity. Measure flux (F) + know luminosity (L) → calculate distance (d). (Credit: (A. Rosen/NotebookLM))
A student claims: “Astronomers measured the temperature of that star to be 5,800 K.” What did astronomers actually measure?
- Temperature directly, using a thermometer
- The star’s spectrum or color (wavelength distribution)
- The star’s mass and size
- The distance to the star
(b) The star’s spectrum or color (wavelength distribution). You can’t put a thermometer on a star. Astronomers measure which wavelengths of light the star emits and in what amounts. Temperature is then inferred using physics: hotter objects emit more blue light (shorter wavelengths), cooler objects emit more red light (longer wavelengths).
Light: The Cosmic Messenger
Everything we know about the universe beyond Earth comes from light — electromagnetic radiation traveling across the cosmos carrying information.
The Speed of Light
Light travels at a constant speed in vacuum:
\[ c = 300{,}000 \text{ km/s} = 3 \times 10^8 \text{ m/s} \]
This is fast enough to circle Earth 7.5 times in one second. But it’s also finite, and that finiteness has profound consequences.
To build intuition:
- Light crosses your room almost instantaneously
- Light from the Sun takes 8.3 minutes to reach Earth
- Light from the nearest star takes 4.2 years
- Light from the Andromeda Galaxy takes 2.5 million years
What’s a Light-Year?
A light-year is a unit of distance, not time — even though “year” is in the name.
A light-year is how far light travels in one year:
\[ 1 \text{ light-year} \approx 9.5 \times 10^{15} \text{ m} \]
That’s about 9.5 trillion kilometers.
When we say “Proxima Centauri is 4.2 light-years away,” we mean its light traveled for 4.2 years to reach us — and we’re seeing it as it was 4.2 years ago.
Proxima Centauri is 4.2 light-years away. If a powerful laser on Proxima Centauri is turned on today, how long until we could see it from Earth?
4.2 years. A light-year is the distance light travels in one year. If Proxima Centauri is 4.2 light-years away, light from there takes 4.2 years to reach us — no exceptions, no shortcuts. The speed of light is the cosmic speed limit.
Distance Is a Time Machine
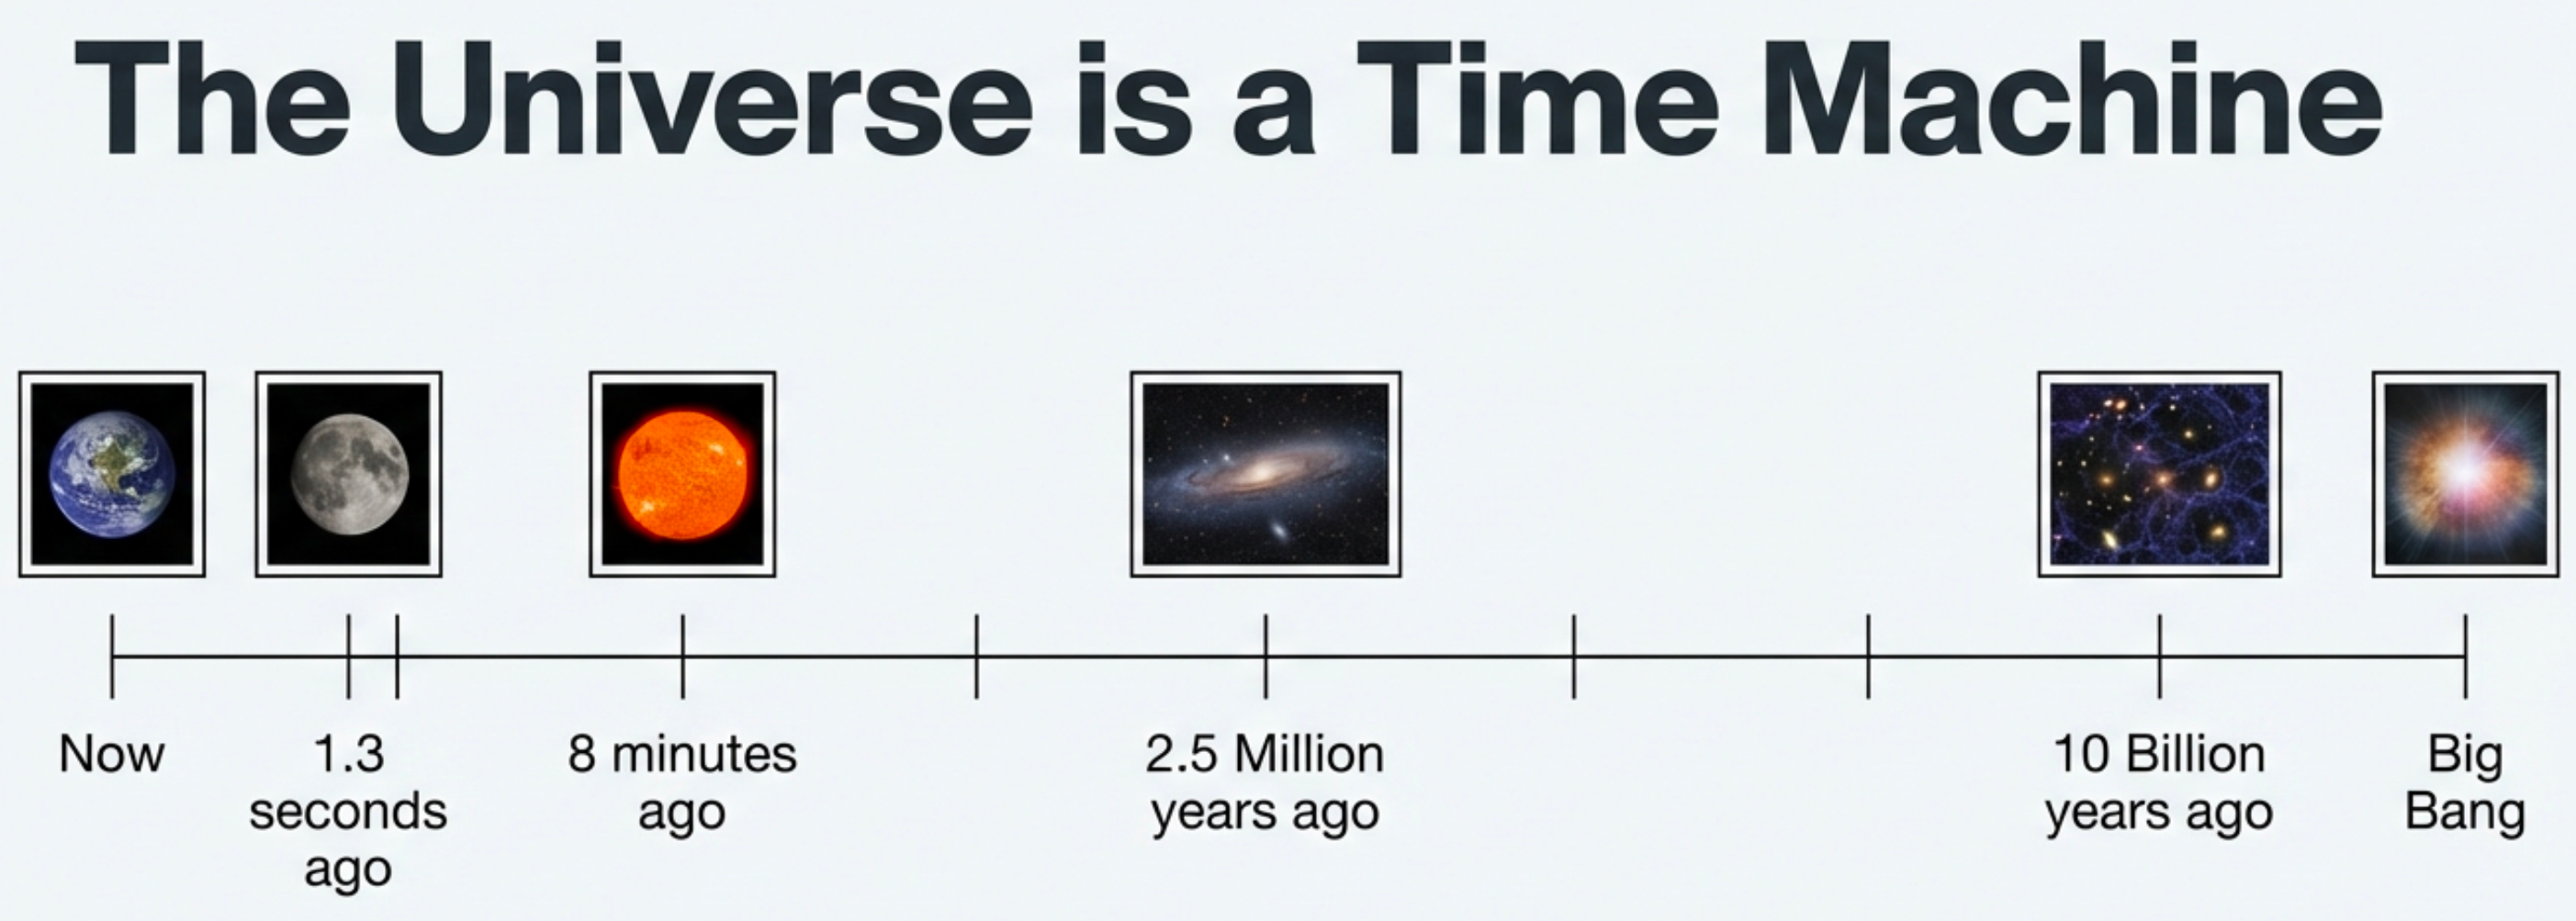
What to notice: Distance is a time dial. Looking at the Moon = 1.3 seconds ago; the Sun = 8 minutes ago; Andromeda = 2.5 million years ago; distant galaxies = 10 billion years ago. (Credit: (A. Rosen/NotebookLM))
Light’s finite speed has a profound consequence: looking far away = looking back in time.
| Object | Distance | You See It As It Was… |
|---|---|---|
| The Moon | 1.3 light-seconds | 1.3 seconds ago |
| The Sun | 8.3 light-minutes | 8.3 minutes ago |
| Proxima Centauri | 4.2 light-years | 4.2 years ago |
| Andromeda Galaxy | 2.5 million light-years | 2.5 million years ago |
| Distant galaxies | 10+ billion light-years | When the universe was young |
This isn’t a limitation — it’s a feature. We can directly observe cosmic history by looking at objects at different distances.
Lookback time: The time light takes to travel from an object to us. We see distant objects as they were in the past.
The Electromagnetic Spectrum
Light isn’t just what your eyes see. The electromagnetic spectrum spans from radio waves (wavelengths of meters) to gamma rays (wavelengths smaller than atoms).
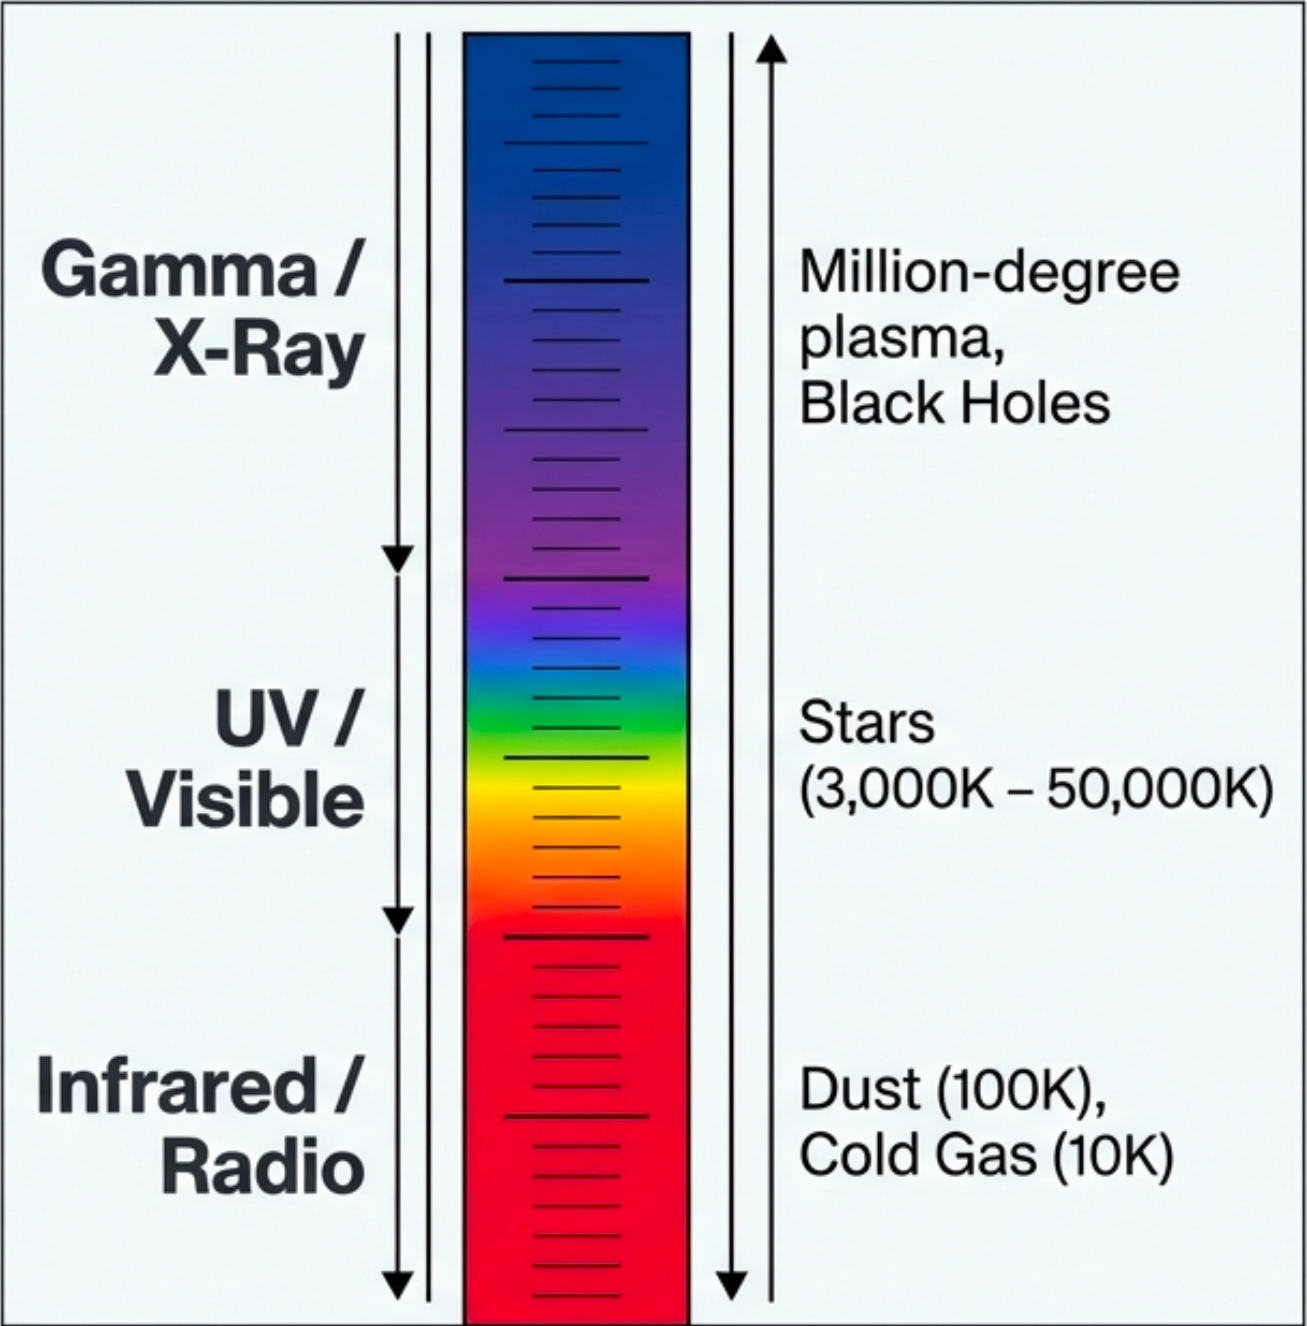
What to notice: The EM spectrum is a temperature ladder. Gamma/X-ray = million-degree plasma; UV/Visible = stellar surfaces (3,000–50,000 K); Infrared/Radio = dust and cold gas (10–100 K). (Credit: (A. Rosen/NotebookLM))
The key insight: wavelength tells you about temperature and energy.
| Wavelength Range | Typical Source |
|---|---|
| Radio (cm – m) | Cold gas, magnetic fields |
| Infrared (\(1 \mu\mathrm{m}\) – 1 mm) | Warm dust, cool stars |
| Visible (400 – 700 nm) | Stellar surfaces |
| Ultraviolet (10 – 400 nm) | Hot stars |
| X-ray (0.01 – 10 nm) | Hot plasma (millions of K) |
| Gamma-ray (< 0.01 nm) | Extreme events |
Shorter wavelength = higher energy = hotter or more violent source. This is why X-ray telescopes see different objects than optical telescopes — they’re sensitive to different physics.
Why do X-ray telescopes observe different objects than optical telescopes?
Different wavelengths reveal different temperatures and physical processes. X-rays are emitted by extremely hot material (millions of degrees) — like gas falling into black holes or the aftermath of stellar explosions. Optical light comes from cooler sources (thousands of degrees) — like stellar surfaces. Same sky, different physics made visible.
Recognition, Not Retention
Let’s recap what we’ve covered:
The thesis: Pretty pictures \(\rightarrow\) measurements \(\rightarrow\) models \(\rightarrow\) inferences
The method:
- We measure four types of things: brightness, position, wavelength, timing
- Everything else is inferred using physical models
- Physics provides relationships; math makes them precise and testable
The spoiler reel demonstrated:
- Colors encode atoms (nebulae)
- Brightness enables distance (ladder)
- Spectra reveal composition (spectroscopy)
- Wavelength choice reveals different components (M51, Pillars)
- Motion reveals hidden mass (dark matter)
- The universe is 13.8 billion years old and accelerating
The key physics of light:
- Speed: \(c = 3 \times 10^8\) m/s (finite, constant)
- Light-year is a distance, not a time
- Finite light speed \(\rightarrow\) lookback time
- Different wavelengths probe different temperatures/processes
Today was a trailer — like a movie preview. You’re not expected to master anything today. You’re expected to recognize these ideas when they return.
When these concepts come back — and they will — you’ll think “I’ve seen this before.” That’s the goal. Recognition comes first; understanding follows.
Next time: The Math Boot Camp — scientific notation, unit conversions, ratios, and rate problems. These are the tools that let us decode cosmic numbers without drowning in zeros.
Coming soon: Our first real inference problem: How do we measure distance to objects we can’t reach?
Today you saw the spoilers. Now we build the tools to understand them — one inference at a time.
Practice Problems
Conceptual Questions
1. Observable vs. Inferred. For each quantity, state whether it is directly measured or inferred:
| Quantity | Measured or Inferred? |
|---|---|
| (a) The brightness of a star | |
| (b) The temperature of a star | |
| (c) The position of a star on the sky | |
| (d) The distance to a star | |
| (e) The wavelength of light from a star |
2. The Inference Pipeline. A student claims: “We know the Sun is made of hydrogen because we can see it.” What’s wrong with this statement? Explain what we actually measure and how we infer composition.
3. Standard Candles. Why do astronomers need “standard candles” to measure distances? What problem do they solve?
4. Lookback Time. The Andromeda Galaxy is about 2.5 million light-years away. If an astronomer observes a supernova in Andromeda tonight, when did that explosion actually occur?
5. Four Observables. An astronomer reports: “We measured the star’s spectrum and found absorption lines shifted toward the red.” Which of the four observables (brightness, position, wavelength, timing) is being measured here? What might be inferred from this observation?
Calculations
6. Relative Brightness. Two identical stars are observed. Star A appears \(9\times\) brighter than Star B. Using the inverse-square law, how many times farther away is Star B compared to Star A?
7. Light Travel Time. Light travels at \(3 \times 10^8\) m/s. The Sun is about \(1.5 \times 10^{11}\) m away from Earth. How long does light take to travel from the Sun to Earth? Give your answer in seconds, then convert to minutes.
8. Building a Light-Year. Using the speed of light (\(c = 3 \times 10^8\) m/s) and the fact that one year is approximately \(3.15 \times 10^7\) seconds, calculate the distance light travels in one year. Express your answer in meters.
9. Inverse-Square Reasoning. A star moves from 10 light-years away to 40 light-years away \((4\times\) the original distance). By what factor does its apparent brightness change?
10. Lookback Time Calculation. A galaxy is 50 million light-years away. If we observe it today, when did the light we’re seeing actually leave that galaxy?
Synthesis
11. The Course Thesis. In 2-3 sentences, explain the course thesis “pretty pictures \(\rightarrow\) measurements \(\rightarrow\) models \(\rightarrow\) inferences” to a friend who has never taken astronomy.
12. Connecting Wavelength to Physics. Explain why observing the same galaxy at optical and radio wavelengths reveals different information. What physical components are visible at each wavelength, and why?
13. Dark Matter Evidence. A student says, “If we can’t see dark matter, how do we know it exists?” Describe one piece of observational evidence for dark matter, clearly stating what is measured and what is inferred.
14. Observable \(\rightarrow\) Model \(\rightarrow\) Inference. A star’s position on the sky changes periodically over several years. Using the Observable \(\rightarrow\) Model \(\rightarrow\) Inference pattern from this reading: (a) identify which observable is being measured, (b) explain what physical model connects this to unseen objects, and (c) state what you might infer about the star.
Glossary
- ★ Absorption
- Light removed from a beam by intervening material, often at specific wavelengths where atoms absorb photons. Absorption lines appear dark against a brighter continuum.
- ★ Blackbody
- An idealized object that absorbs all incident radiation and emits a characteristic spectrum determined only by its temperature. Stars approximate blackbodies. The blackbody spectrum peaks at \(\lambda_{\text{peak}} = b/T\) (Wien's law).
- ◇ Cosmic Web
- The large-scale structure of the universe: galaxies arranged in filaments, walls, and clusters, separated by vast voids. The cosmic web is still evolving—gravity continues to pull matter from voids into filaments and clusters.
- ◇ Dark Energy
- The unknown cause of the accelerating expansion of the universe, comprising ~68% of the cosmic energy budget. Often modeled as a cosmological constant (Λ), but its physical origin remains one of the deepest mysteries in physics.
- ◇ Dark Matter
- Invisible matter that does not emit, absorb, or reflect light but exerts gravitational influence. Dark matter outweighs ordinary matter ~5:1 and is essential for explaining galaxy rotation curves and cosmic structure formation.
- ★ Emission
- Light produced and sent out by a source, often at specific wavelengths determined by atomic transitions. Emission lines appear bright against a darker background.
- ◇ Extinction
- The dimming of light by dust through a combination of absorption and scattering. Extinction is wavelength-dependent: blue light is extinguished more than red (interstellar reddening).
- ★ Flux (F)
- The amount of light energy arriving at a detector per unit time per unit area. Measured in erg s⁻¹ cm⁻². Flux depends on both luminosity and distance: \(F = L/(4\pi d^2)\).
- ★ Frequency (ν)
- The number of wave cycles passing a point per second, measured in Hertz (Hz). Higher frequency means higher energy photons: \(E = h\nu\).
- ◇ Hubble Constant (H₀)
- The current expansion rate of the universe, approximately 70 km/s/Mpc. A galaxy 1 Mpc away recedes at ~70 km/s; one 10 Mpc away recedes at ~700 km/s. The inverse of H₀ gives a rough estimate of the universe's age.
- ★ Inference
- Drawing conclusions about quantities we cannot directly access (like a star's temperature) from quantities we can measure (like its color). Inference requires a model—a physical relationship connecting observable to unobservable.
- ★ Inverse-square law
- The principle that flux decreases with the square of distance: double the distance, quarter the brightness. \(F = L/(4\pi d^2)\). This geometric spreading is why distance determination is central to astronomy.
- ◇ Ionized
- An atom that has lost one or more electrons, leaving it with a net positive charge. Ionization requires energy (heat or UV radiation). Ionized gas emits different spectral lines than neutral gas.
- ★ Light-year
- The distance light travels in one year—approximately \(10^{18}\) cm or about 63,000 AU. A unit of distance, not time. Proxima Centauri is 4.2 light-years away.
- ◇ Lookback time
- The time light takes to travel from a distant object to us—we see the object as it was that long ago. Looking at the Andromeda Galaxy (2.5 million light-years away), we see it as it was 2.5 million years ago.
- ★ Luminosity (L)
- The total light energy emitted by a source per unit time—its intrinsic brightness. Measured in erg/s or solar luminosities (\(L_\odot\)). Luminosity is what the object emits; flux is what we receive.
- ★ Model
- A mathematical relationship encoding physical assumptions that connects what we measure to what we want to know. Models can be tested by comparing their predictions to new observations.
- ◇ Neutral
- An atom with equal numbers of protons and electrons, having no net electric charge. Neutral hydrogen emits at 21 cm (radio); ionized hydrogen emits at 656 nm (optical).
- ★ Observable
- A quantity that can be directly measured—brightness, position, wavelength, timing. Astronomers have remarkably few types of observables; nearly everything else is inferred.
- ★ Photon
- A discrete packet of electromagnetic energy; the quantum of light. Each photon carries energy \(E = h\nu\), where \(h\) is Planck's constant and \(\nu\) is frequency.
- ◇ Planck's constant (h)
- A fundamental constant that relates photon energy to frequency: \(h = 6.63 \times 10^{-27}\) erg·s. The appearance of \(h\) in an equation signals that quantum mechanics is involved.
- ◇ Redshift (Cosmological)
- The stretching of light wavelengths due to the expansion of space. More distant galaxies show larger redshifts because light has traveled through more expanding space to reach us.
- ◇ Rotation Curve
- A plot of orbital speed versus distance from a galaxy's center. Flat rotation curves—where speed stays constant at large radii—are the primary evidence for dark matter halos around galaxies.
- ★ Spectroscopy
- The technique of spreading light into its component wavelengths to analyze composition, temperature, and motion. Spectroscopy transformed astronomy from cataloging what's there to understanding what it's made of.
- ★ Spectrum
- Brightness measured as a function of wavelength—the distribution of light across different colors/energies. A spectrum contains far more information than a single brightness measurement.
- ★ Speed of light (c)
- The speed at which light travels in vacuum: \(c = 3 \times 10^{10}\) cm/s. A universal constant—the speed limit of the universe. Nothing with mass can reach this speed.
- ◇ Standard candle
- An object whose intrinsic luminosity can be determined independently, allowing distance to be calculated from observed brightness. Examples: Cepheid variables (period → luminosity), Type Ia supernovae (consistent peak brightness).
- ◇ Thermal radiation
- Light emitted by an object due to its temperature—all objects above absolute zero emit thermal radiation. Hotter objects emit more light at shorter wavelengths (Wien's law).
- ★ Wavelength (λ)
- The spatial period of a light wave—the distance between successive crests. Measured in nanometers (nm) for visible light, centimeters for radio. Related to frequency by \(c = \lambda\nu\).
- ◇ ΛCDM
- The standard cosmological model: Λ (cosmological constant/dark energy) + CDM (Cold Dark Matter). Fits observations remarkably well with only six free parameters, but leaves dark matter and dark energy unexplained.