Reading the Glow — Temperature Written in Light
Lecture 8 Reading Companion
The Big Idea
Everything glows. You, your laptop, the walls around you — all emit light. Most of it is infrared, invisible to your eyes. But heat it up enough, and anything will glow visibly: first red, then orange, yellow, white, blue. The color of the glow tells you the temperature.
Here’s what that buys us: Betelgeuse and Sirius are both among the brightest stars in the winter sky — but one is 880 times the Sun’s radius and the other is just \(1.7\times.\) We’ve never visited either one. By the end of this reading, you’ll understand exactly how astronomers figured that out using nothing but light.
This reading shows how temperature is encoded in light — the astronomer’s remote thermometer.
Musts for today (~25 min):
- The Big Idea
- What is thermal radiation / blackbody radiation?
- Wien’s Law: peak wavelength tells temperature
- The “Sun is green” puzzle (and why we see white)
- Stefan-Boltzmann Law: temperature affects luminosity powerfully
- The ratio method: calculating stellar properties in solar units
Non-negotiable: Stop at every Check Yourself question — don’t just read past them!
Deep Dives (important but save for later):
- L-T-R connection and worked examples (giants vs. dwarfs)
- Why blackbodies matter for stellar physics
Connection to the Course:
- L5-L6: Motion reveals mass
- L7-L8: Light reveals temperature
- L9: Spectral lines reveal composition and motion
If you only remember three things:
Everything glows. Objects emit thermal radiation because of their temperature. Hotter = brighter and bluer.
Wien’s Law: \(\lambda_{\text{peak}} \propto 1/T\). Measure the peak wavelength of emitted light \(\to\) know the temperature.
Stefan-Boltzmann Law: Power per unit area \(= \sigma T^4\). At the same size, doubling \(T\) makes emission \(16\times\) larger. (Total luminosity: \(L = 4\pi R^2 \sigma T^4\).)
Now for the details…
Seeing Heat
Imagine looking through an infrared camera. In pitch darkness, you see a person walking — their body glows brightly against the cool background. A coffee mug just removed from the microwave blazes with infrared light. The cold night sky is nearly black, but the warm buildings stand out in eerie detail.
Here’s the remarkable thing: that infrared “glow” isn’t reflected light — it’s light the objects are emitting because of their temperature. Everything with temperature above absolute zero radiates electromagnetic waves. At room temperature, that radiation is mostly infrared, invisible to our eyes. But heat something to \(500^{\circ}\mathrm{C}\) and it glows dull red. At \(1000^{\circ}\mathrm{C}\), bright orange. At ~5800 K (about \(5500^{\circ}\mathrm{C}\); the Sun’s photosphere), brilliant yellow-white.
This isn’t metaphor — it’s physics. Temperature is written in light.
In Lecture 7, we learned that light carries information and that wavelength matters. Now we’ll see the specific relationship: how the spectrum of emitted light encodes an object’s temperature. The hotter the object, the shorter the wavelength of its peak emission. The Sun peaks in green light (around 500 nm). A cool red star peaks in the infrared.
This is the astronomer’s thermometer: point a telescope at a star, spread its light into a spectrum, and read its temperature — from 40 trillion kilometers away, without touching anything.
Drag the slider below from VISIBLE to INFRARED and watch camouflaged animals appear. Warm-blooded animals (like meerkats) glow brightly in infrared — they can’t hide their thermal radiation! Cold-blooded animals (like the tomistoma) barely show up because their body temperature is much lower.
You might assume:
- Only “hot” things emit light (like fire or the Sun)
- Objects at room temperature don’t glow
- An object must be heated externally to glow
But everything above absolute zero emits electromagnetic radiation. At room temperature, you emit infrared light constantly — roughly 100 W of thermal radiation (it depends on your body, clothing, and surroundings). You’re glowing right now!
Throughout this lecture (and all of astrophysics), we use the Kelvin scale for temperature. Here’s why — and how to convert.
Why Kelvin?
The Kelvin scale starts at absolute zero — the coldest possible temperature, where all thermal motion stops. This makes physics formulas simpler because there are no negative temperatures to worry about. When we say “double the temperature,” that makes physical sense in Kelvin (\(2 \times 300\,\mathrm{K} = 600\,\mathrm{K}\)), but not in Celsius (\(2 \times 27^{\circ}\mathrm{C} \neq 54^{\circ}\mathrm{C}\) in any meaningful sense).
Kelvin vs. Celsius
Kelvin and Celsius use the same-sized degrees — they just start at different places:
\[ T_K = T_C + 273 \]
| Description | Celsius | Kelvin |
|---|---|---|
| Absolute zero (thermal motion stops) | \(-273^{\circ}\mathrm{C}\) | 0 K |
| Water freezes | \(0^{\circ}\mathrm{C}\) | 273 K |
| Room temperature | ~\(20^{\circ}\mathrm{C}\) | ~293 K |
| Water boils | \(100^{\circ}\mathrm{C}\) | 373 K |
| Oven temperature | ~\(200^{\circ}\mathrm{C}\) | ~473 K |
| Red-hot metal | ~\(700^{\circ}\mathrm{C}\) | ~1000 K |
| Sun’s surface | ~\(5500^{\circ}\mathrm{C}\) | ~5800 K |
Quick conversion: Add 273 to Celsius to get Kelvin. For rough estimates, remember that room temperature is about 300 K, and the Sun is about 6000 K.
The bottom line: Kelvin is the physicist’s temperature scale because it starts at true zero. Throughout this reading, temperatures are in Kelvin unless otherwise noted.
In Lecture 7, we established that light is information:
- Light is an electromagnetic wave with wavelength and frequency
- The EM spectrum ranges from radio to gamma rays
- Wavelength affects interactions: Rayleigh scattering makes skies blue
- Light intensity follows the inverse-square law
But we left a key question unanswered: What determines what wavelength an object emits?
The answer: temperature. Today we connect temperature to the spectrum of emitted light.
Need a refresher on the electromagnetic spectrum from Lecture 7? Explore it below — pay attention to where visible light sits relative to infrared and ultraviolet. You’ll need this mental map throughout today’s reading.
Part 1: Everything Glows
Thermal Radiation
The Basic Principle
All objects with temperature above absolute zero emit electromagnetic radiation. This is called thermal radiation. The radiation comes from the thermal motion of charged particles — atoms and electrons jiggling around because they have internal energy. A blackbody is an idealized object that emits a very specific “blackbody spectrum” determined only by its temperature — many real objects approximate this, but not perfectly.
Thermal radiation: Electromagnetic radiation emitted by an object due to its temperature. Every object above absolute zero emits it.
Absolute zero: The lowest possible temperature (\(0\,\mathrm{K} = -273^{\circ}\mathrm{C}\)). At this temperature, thermal motion stops and thermal radiation ceases.
No external source is needed — the object emits because it has internal energy. The hotter it is, the more it emits, and the shorter the wavelength.
Examples Across Temperatures
| Object | Temperature | Peak Wavelength | What It Emits |
|---|---|---|---|
| Cosmic microwave background | 2.7 K | ~1 mm | Microwaves |
| Liquid nitrogen | 77 K | ~\(38\,\mu\mathrm{m}\) | Far infrared |
| Room temperature | 300 K | ~\(10\,\mu\mathrm{m}\) | Infrared |
| Boiling water | 373 K | ~\(8\,\mu\mathrm{m}\) | Infrared |
| Red-hot metal | ~1000 K | ~\(3\,\mu\mathrm{m}\) | Near-IR, dull red visible |
| Incandescent bulb | ~2500 K | ~\(1.2\,\mu\mathrm{m}\) | Mostly IR, some visible |
| Sun’s surface | 5800 K | ~500 nm | Visible (peaks in green) |
| Hot blue star | 30,000 K | ~100 nm | Ultraviolet |
The Pattern
Notice the trend: hotter objects emit at shorter wavelengths. Cool objects emit mostly infrared (invisible). Heat them up and they glow dull red, then orange, then yellow, then white, then blue-white.
This isn’t coincidence — it’s physics, captured by Wien’s Law (coming up in Part 2).
Which of the following emits thermal radiation?
- Only the Sun and stars
- Only objects that are visibly glowing (red-hot or hotter)
- Everything with temperature above absolute zero
- Only objects connected to power sources
C) Everything with temperature above absolute zero. Your body, the walls, the air — everything emits thermal radiation. At room temperature, this is mostly infrared (invisible to eyes), but it’s still real EM radiation.
What Is a Blackbody?
The Idealized Emitter
A blackbody is an idealized object with two special properties:
- It absorbs all incident radiation — nothing is reflected
- It emits thermal radiation with a spectrum that depends only on its temperature
A blackbody glows even in complete darkness — the emission comes from its own internal thermal energy, not from reflected or re-radiated external light.
The spectrum shape is universal — same for any blackbody at the same temperature. A blackbody iron ball at 5800 K emits the same spectrum as a blackbody tungsten ball at 5800 K (or the Sun at 5800 K). Temperature alone determines the spectrum.
Blackbody: An idealized object that absorbs all incident radiation and emits thermal radiation with a spectrum determined solely by its temperature. Stars are excellent approximations.
Why “Black” Body?
The name is counterintuitive. A blackbody glows! But “black” refers to absorption, not emission. A perfect blackbody absorbs all light that hits it — it doesn’t reflect anything. That absorbed energy is re-radiated as thermal emission.
Ironically, a blackbody at high temperature is anything but black — it’s brilliantly luminous!
The Blackbody Spectrum
When you plot intensity vs. wavelength for a blackbody, you get a characteristic curve:
- Starts at zero intensity for very short wavelengths
- Rises to a peak at some wavelength (which depends on temperature)
- Falls off at longer wavelengths
- The entire curve shifts to shorter wavelengths as temperature increases
- Hotter curves are also taller — more total energy output
What to notice: hotter objects peak at shorter wavelengths and emit more total light; cooler objects peak at longer wavelengths. (Credit: Illustration: NASA, ESA, CSA)
Why Stars Are (Nearly) Blackbodies
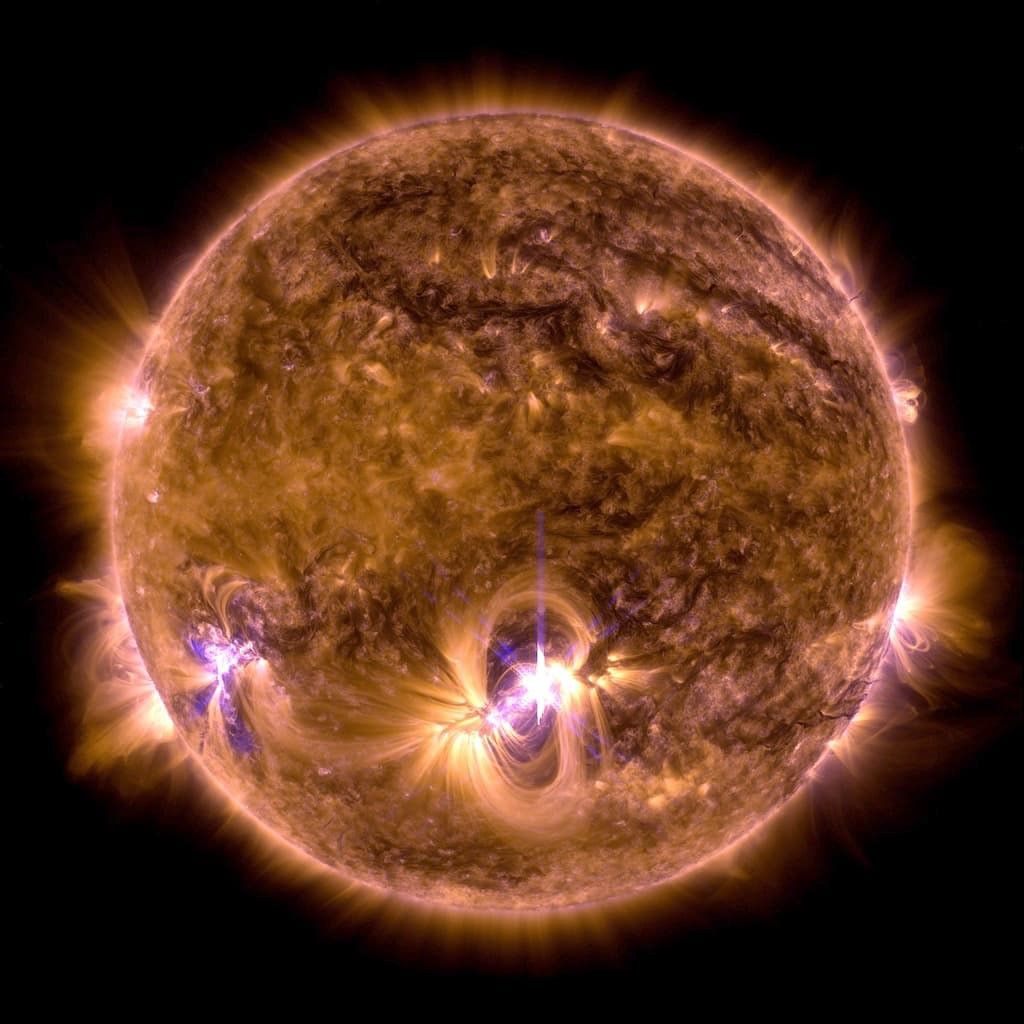
What to notice: the Sun’s surface (photosphere) glows because of its ~5800 K temperature — this is thermal radiation. The bright flares show localized regions of extreme heating, with magnetic loops visible at the limb. (Credit: NASA/SDO)
Stars are excellent approximations of blackbodies (for their smooth continuum spectrum) because:
- They’re opaque — photons interact many times before escaping
- Those repeated interactions tend to thermalize the radiation, producing a spectrum close to a blackbody
- The light we see comes from the photosphere, which can be described by an effective temperature
Real stellar spectra are not perfect blackbodies — spectral lines sit on top of the blackbody-like continuum. We’ll use those lines in Lecture 9 to get composition and motion.
Historical Aside: The Ultraviolet Catastrophe
The blackbody spectrum was a major puzzle in 19th-century physics. Classical theory predicted that a hot object should emit infinite energy at short wavelengths — an obvious absurdity called the “ultraviolet catastrophe.” This paradox was only resolved in 1900 when Max Planck proposed that energy is emitted in discrete packets (quanta), not continuously. This was the birth of quantum mechanics!
Planck’s explanation of the blackbody spectrum earned him the 1918 Nobel Prize and revolutionized physics. The smooth blackbody curve you see in the demo is a triumph of quantum physics — classical physics couldn’t explain it.
The most perfect blackbody ever measured isn’t a star — it’s the Cosmic Microwave Background (CMB), the afterglow of the Big Bang. The CMB has a temperature of 2.725 K and its spectrum matches a perfect blackbody curve to extraordinary precision (deviations constrained to tens of parts per million of the peak brightness in COBE/FIRAS analyses).
This perfect blackbody signature is powerful evidence that the early universe was in thermal equilibrium — hot, dense, and uniform — before it expanded and cooled to its current state. The CMB was discovered in 1965, and its blackbody nature was measured by COBE/FIRAS in the early 1990s — work that contributed to the 2006 Nobel Prize recognition of the CMB’s blackbody form.
Adjust the temperature slider below and watch the peak shift from infrared through visible to ultraviolet. Notice two things: the peak moves left (shorter wavelength) as temperature rises, and the curve gets taller (more total energy).
A blackbody’s emission spectrum depends on:
- What the object is made of
- The object’s color and reflectivity
- Only the object’s temperature
- The type of electromagnetic wave hitting it
C) Only the object’s temperature. This is the remarkable property of blackbodies: the shape of the spectrum is universal. A blackbody iron ball at 5800 K emits the same spectrum as a blackbody tungsten ball at 5800 K (or the Sun at 5800 K). Temperature alone determines the spectrum.
Part 2: Wien’s Law — Temperature from Color
The Peak Wavelength
If you double an object’s temperature (in Kelvin), does its peak wavelength:
- Double
- Stay the same
- Get cut in half
- Decrease by a factor of 4
Think about it before reading on…
Wien’s Displacement Law
The peak wavelength of a blackbody’s emission is inversely proportional to its temperature:
\[ \lambda_{\text{peak}} = \frac{2.9 \times 10^{-3}\,\mathrm{m\cdot K}}{T} \]
or in convenient form for visible light:
\[ \lambda_{\text{peak}}\,(\mathrm{nm}) = \frac{2.9 \times 10^6\,\mathrm{nm\cdot K}}{T\,(\mathrm{K})} \]
Hotter objects peak at shorter wavelengths.
Answer to prediction: C) Get cut in half. Double the temperature \(\to\) half the peak wavelength.
Wien’s Law: The relationship between temperature and peak emission wavelength; \(\lambda_{\text{peak}} \propto 1/T\). Hotter objects peak at shorter (bluer) wavelengths.
“Peak wavelength” here means the peak of the curve when plotted per unit wavelength (intensity vs. \(\lambda\)). If you plot the same spectrum per unit frequency (intensity vs. \(\nu\)), the numerical peak shifts to a different value — same physics, different way of labeling the curve. This is a mathematical subtlety that occasionally confuses advanced students, but for ASTR 101, just know that Wien’s Law as written applies to the wavelength form of the spectrum.
Use one version at a time and match the units:
- If you use the \(\mathrm{m\cdot K}\) form, \(\lambda_{\text{peak}}\) must be in meters and \(T\) in Kelvin
- If you use the \(2.9 \times 10^6\,\mathrm{nm\cdot K}\) form, \(\lambda_{\text{peak}}\) must be in nanometers and \(T\) in Kelvin
Mixing units gives nonsense answers!
What This Means
Wien’s Law is the astronomer’s thermometer. Measure where an object’s spectrum peaks, and you know its temperature.
| Object | Temperature | Peak Wavelength | Where in Spectrum |
|---|---|---|---|
| Cool red star | 3000 K | ~970 nm | Near-infrared (red visible tail) |
| Sun | 5800 K | ~500 nm | Green visible |
| Hot white star | 10,000 K | ~290 nm | Ultraviolet (blue visible tail) |
| Hot blue star | 25,000 K | ~120 nm | Far ultraviolet |
Worked Example
Problem: A star’s spectrum peaks at 290 nm (ultraviolet). What is its surface temperature?
Solution: \[ T = \frac{2.9 \times 10^6\,\mathrm{nm\cdot K}}{\lambda_{\text{peak}}} = \frac{2.9 \times 10^6\,\mathrm{nm\cdot K}}{290\,\mathrm{nm}} = 10^4\,\mathrm{K} \]
This is a hot, blue-white star — about \(1.7\times\) the Sun’s temperature.
Observable: A star’s spectrum peaks at 580 nm (yellow-orange light). (Wavelength observation)
Model: Wien’s Law: \(\lambda_{\text{peak}}\,(\mathrm{nm}) = 2.9 \times 10^6\,\mathrm{nm\cdot K}\, /\, T\,(\mathrm{K})\).
Inference: \(T = 2.9 \times 10^6\,\mathrm{nm\cdot K}\, /\, 580\,\mathrm{nm} = 5000\,\mathrm{K}\). This star is slightly cooler than the Sun.
A cool red star has a surface temperature of 3000 K. Approximately where does its spectrum peak?
- 100 nm (ultraviolet)
- 500 nm (visible green)
- 970 nm (near-infrared)
- 10,000 nm (far infrared)
C) 970 nm (near-infrared). Using Wien’s Law: \(\lambda_{\text{peak}} = 2.9 \times 10^6\,\mathrm{nm\cdot K}\, /\, 3000\,\mathrm{K} = 967\,\mathrm{nm} \approx 970\,\mathrm{nm}\).
This is just beyond the red end of visible light (700 nm). The star appears red because the visible tail of its blackbody curve favors red wavelengths.
The “Sun Is Green” Puzzle
The Puzzle
Plug the Sun’s temperature (5800 K) into Wien’s Law:
\[ \lambda_{\text{peak}} = \frac{2.9 \times 10^6\,\mathrm{nm\cdot K}}{5800\,\mathrm{K}} = 500\,\mathrm{nm} \]
That’s green light! Yet the Sun doesn’t look green — it looks white (or yellow when seen through atmosphere). What’s going on?
The Solution
The Sun isn’t green for two reasons:
Blackbody curves are broad, not sharp. The Sun emits significant light across the entire visible spectrum — red, orange, yellow, green, blue, violet. The peak happens to be at green, but there’s plenty of light on either side.
Our eyes see the combination as white. When all visible colors are present in roughly equal amounts, our brains perceive white light. The Sun’s spectrum is close enough to balanced that we see it as white (or yellow-white when atmosphere reddens it).
If the Sun emitted only at its peak wavelength, it would look green. But blackbody spectra are continuous and broad, so we get white.
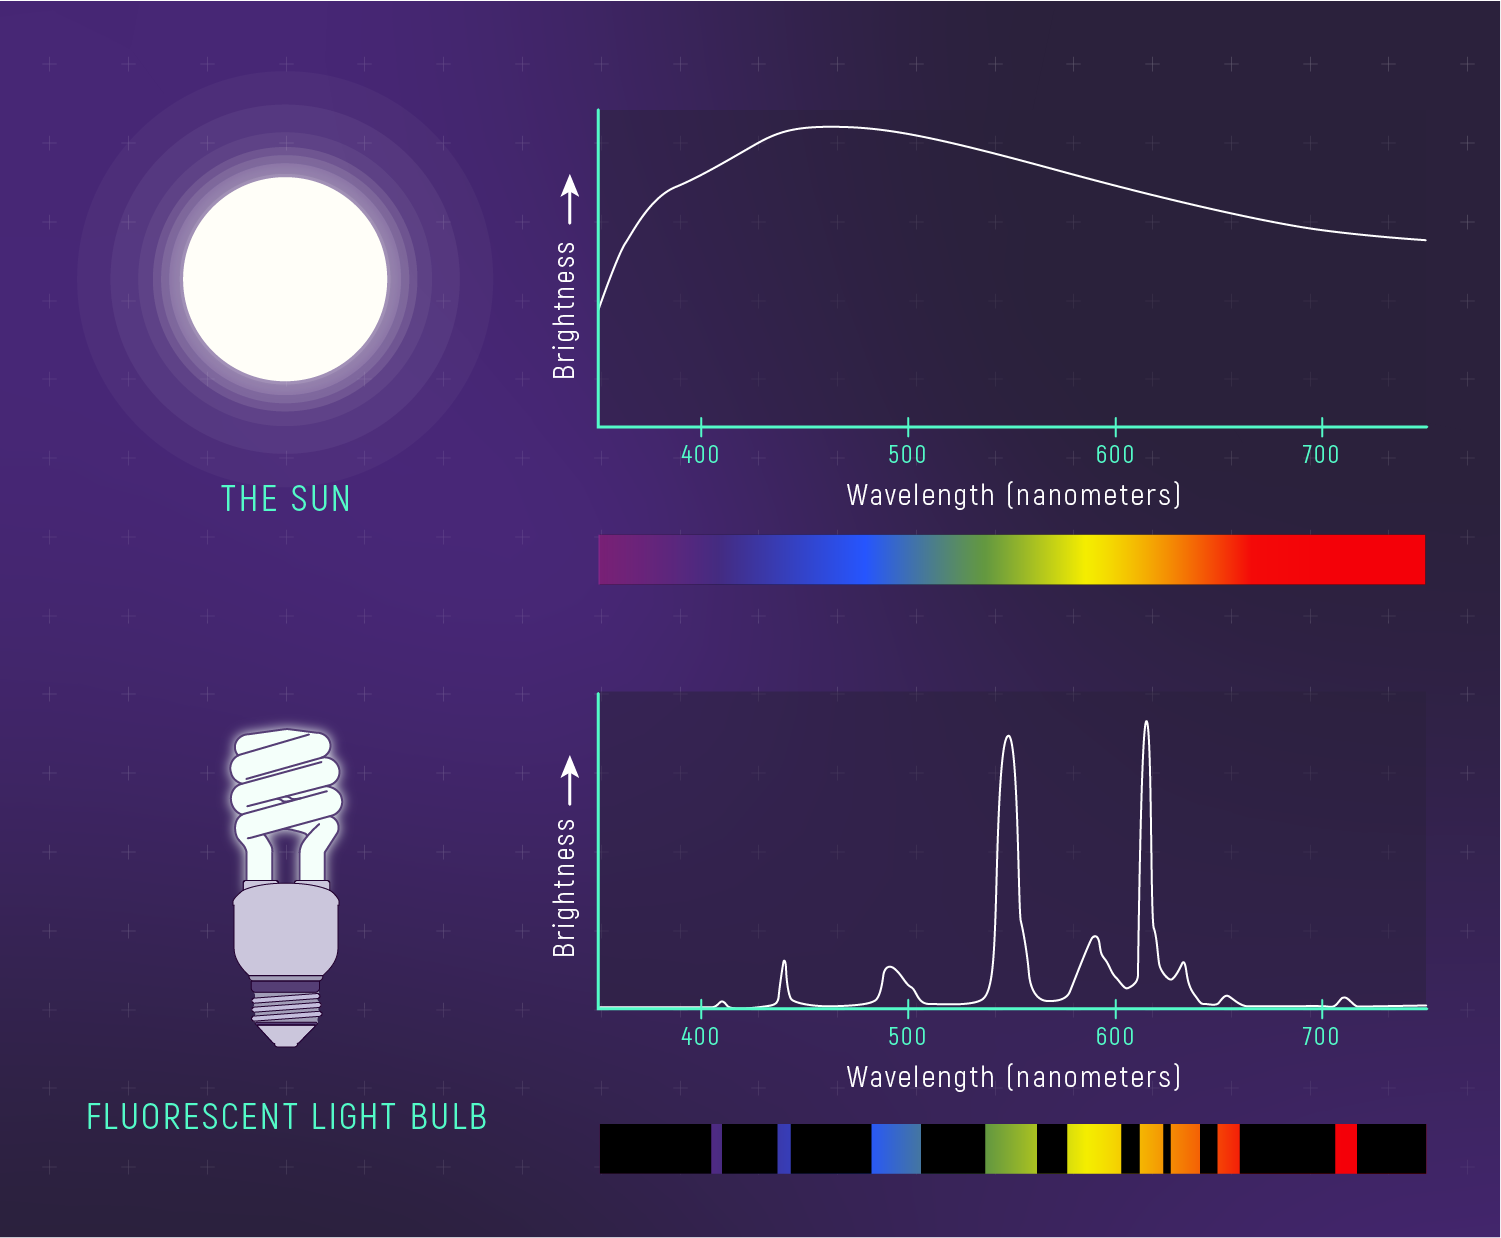
What to notice: the Sun’s spectrum is broad (a smooth-ish continuum), not a narrow spike at one color—so the mix of wavelengths looks white/yellow-white. (Credit: Illustration: NASA, ESA, CSA)
It’s probably not coincidence that human eyes are most sensitive to green light (~550 nm) — very close to where the Sun’s spectrum peaks.
Our visual system evolved under sunlight. It makes sense that we’d be most sensitive to the wavelengths where our primary light source is brightest. Fish that live in deep water (where only blue light penetrates) have eyes adapted for blue. Evolution matches perception to environment.
The Sun’s blackbody spectrum peaks at ~500 nm (green). Why doesn’t the Sun appear green?
- The Sun doesn’t actually emit green light
- Earth’s atmosphere absorbs all the green
- The Sun emits broadly across all visible wavelengths; we see the mix as white
- Our eyes can’t see green light
C) The Sun emits broadly across all visible wavelengths; we see the mix as white. The peak is at green, but blackbody curves are wide — substantial light is emitted at all visible wavelengths. Our eyes combine them into white (or yellow-white through atmosphere). Only if the Sun emitted a spike at 500 nm and nothing else would we see green.
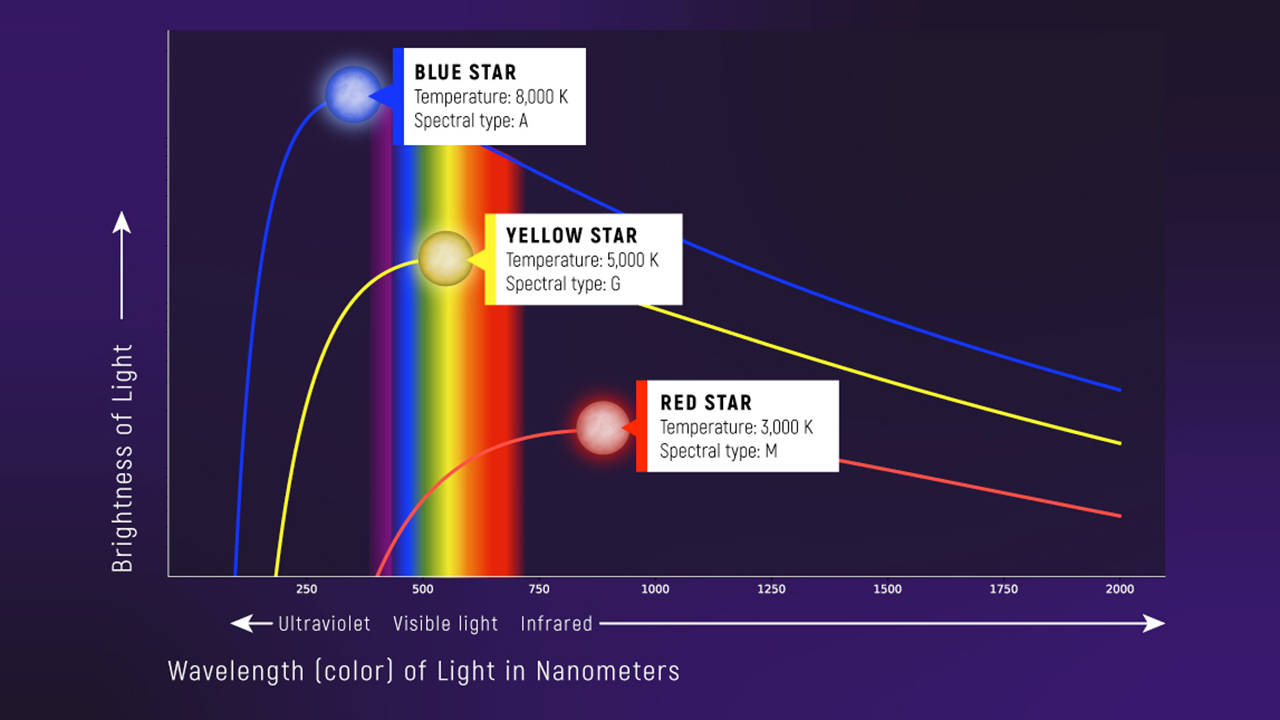
Star Colors and Temperature
The Astronomy Payoff
When you look at stars, their colors tell you their temperatures:
| Color | Temperature Range | Example Stars |
|---|---|---|
| Red/orange | 3000–4500 K | Betelgeuse, Antares |
| Yellow | 5000–6000 K | Sun, Alpha Centauri A |
| White | 7000–10,000 K | Sirius A, Vega |
| Blue-white | 10,000–30,000+ K | Rigel, Spica |
This is Wien’s Law in action. No thermometer needed — just analyze the color.
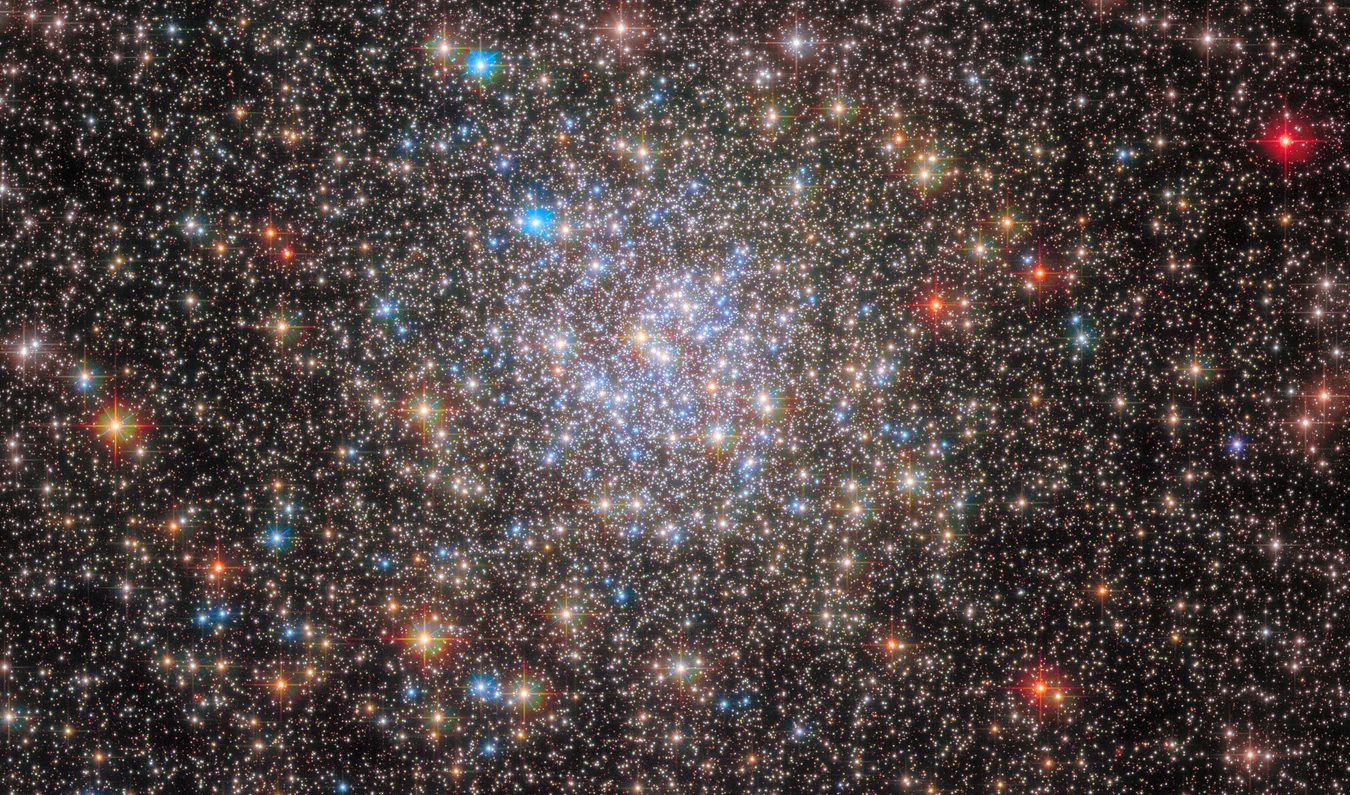
What to notice: the globular cluster NGC 6355 shows stars of many colors — blue, white, yellow, orange, and red — each color directly reflecting the star’s surface temperature via Wien’s Law. (Credit: NASA, ESA, Hubble)
Real-World Application
When JWST observes a distant planet-forming disk, it measures the infrared spectrum. By finding the peak, astronomers can determine the temperature of the dust — revealing whether it’s warm enough for certain chemical reactions or cool enough for ice to form.
No physical contact. No sample collection. Just light, carrying temperature information across cosmic distances.
Rank these stars from coolest to hottest: Rigel (blue-white), Betelgeuse (red), Sun (yellow-white).
- Rigel, Sun, Betelgeuse
- Betelgeuse, Sun, Rigel
- Sun, Betelgeuse, Rigel
- They’re all the same temperature
B) Betelgeuse, Sun, Rigel (coolest to hottest). Red stars are cool (Wien’s Law: longer peak wavelength = lower temperature). Blue stars are hot (shorter peak wavelength = higher temperature). The Sun is in between.
A newly discovered exoplanet has a surface temperature of approximately 1450 K (similar to a brown dwarf). At what wavelength does it peak, and in what part of the EM spectrum?
- ~200 nm, ultraviolet
- ~500 nm, visible green
- ~2000 nm (\(2\,\mu\mathrm{m}\)), infrared
- ~5000 nm (\(5\,\mu\mathrm{m}\)), far infrared
C) ~2000 nm (\(2\,\mu\mathrm{m}\)), infrared. Using Wien’s Law: \(\lambda_{\text{peak}} = 2.9 \times 10^6\,\mathrm{nm\cdot K}\, /\, 1450\,\mathrm{K} = 2000\,\mathrm{nm}\). This is in the near-infrared, well beyond the red end of visible light (700 nm). This is why infrared telescopes like JWST are essential for studying cool objects like brown dwarfs and directly-imaged exoplanets.
Part 3: Stefan-Boltzmann Law — Temperature and Luminosity
How Much Light Does an Object Emit?
If you double an object’s temperature (in Kelvin), does its total energy output (luminosity):
- Double
- Quadruple
- Increase by a factor of 8
- Increase by a factor of 16
Think about it before reading on…
The Stefan-Boltzmann Law
The total energy radiated per unit surface area by a blackbody is proportional to the fourth power of temperature:
\[ \text{Power per area} = \sigma T^4 \]
where \(\sigma = 5.67 \times 10^{-8}\,\mathrm{W\,m^{-2}\,K^{-4}}\) (Stefan-Boltzmann constant)
Temperature has a HUGE effect on luminosity.
Answer to prediction: D) Increase by a factor of 16. Double the temperature \(\to\) \(2^4 = 16\) times the energy output!
Stefan-Boltzmann Law: Radiated power per area scales as \(T^4\). Hotter objects emit dramatically more energy.
What This Means
The fourth power is dramatic:
| Temperature Factor | Luminosity Factor |
|---|---|
| \(2\times\) hotter | \(2^4 = 16\times\) more luminous |
| \(3\times\) hotter | \(3^4 = 81\times\) more luminous |
| \(10\times\) hotter | \(10^4 = 10{,}000\times\) more luminous |
A blue star twice as hot as the Sun (at the same size) would be 16 times more luminous — not twice. Temperature is the dominant factor in stellar luminosity.
Star A has twice the surface temperature of Star B. If both have the same radius, how does Star A’s luminosity compare to Star B’s?
- \(2\times\) more luminous
- \(4\times\) more luminous
- \(8\times\) more luminous
- \(16\times\) more luminous
D) \(16\times\) more luminous. By the Stefan-Boltzmann Law, luminosity scales as \(T^4\) (for same size). If Star A is twice as hot: \((2)^4 = 16\) times more luminous.
The Luminosity-Temperature-Radius Connection
The Full Relationship
The Stefan-Boltzmann Law gives power per unit area. To get total luminosity, multiply by the star’s surface area (\(4\pi R^2\) for a sphere):
\[ L = 4\pi R^2 \sigma T^4 \]
Luminosity depends on both size (\(R^2\)) and temperature (\(T^4\)).
A star can be luminous because:
- It’s very hot (even if small)
- It’s very large (even if cool)
- Or both!
Luminosity (L): The total power radiated by an object, measured in watts or in solar luminosities (\(L_\odot\)).
What This Tells Us
Two stars at the same temperature but different luminosities must have different sizes:
- If Star A and Star B have the same \(T\) but Star A is \(100\times\) more luminous…
- Then Star A must have \(10\times\) the radius (since \(L \propto R^2\))
This is how we distinguish giants from dwarfs observationally: same temperature, different luminosity \(\to\) different radius.
Observable: Two red stars have the same color (same temperature, ~3500 K), but Star A is \(10^4\) times more luminous than Star B. (Brightness + Wavelength observations)
Model: \(L = 4\pi R^2 \sigma T^4\). At fixed temperature, \(L \propto R^2\).
Inference: Star A has \((10^4)^{1/2} = 100\times\) the radius of Star B. Star A is a red giant; Star B is a red dwarf.
The Pillars of Creation in the Eagle Nebula are one of the most famous astronomical images — and a perfect demonstration of Wien’s Law and Stefan-Boltzmann in action. Compare the same structure in visible light (Hubble) and near-infrared (JWST):
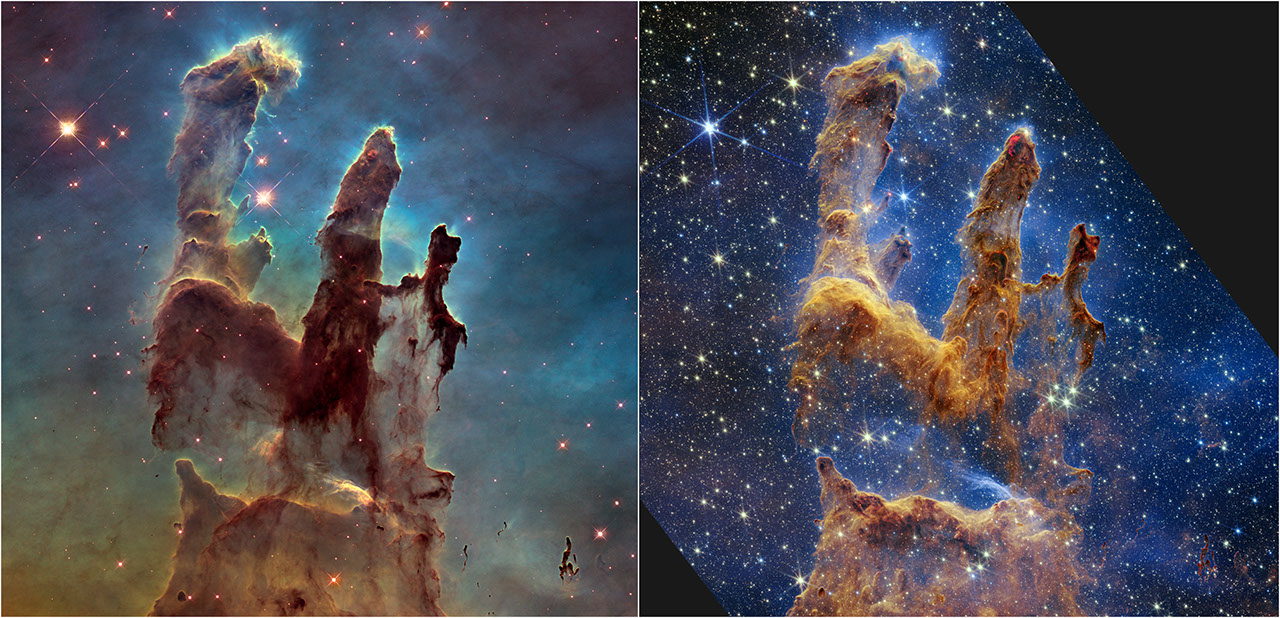
What to notice: Left (Hubble optical)—dark, opaque columns block visible light. Right (JWST infrared)—thousands of embedded newborn stars revealed. Infrared penetrates the dust that blocks optical light. (Credit: Illustration: NASA, ESA, CSA)
Hubble — visible light
- Glowing gas (~10,000 K) \(\rightarrow\) Wien’s peak in visible
- Dust pillars (~20–50 K) \(\rightarrow\) opaque at these wavelengths
Webb — near-infrared
- Same dust \(\rightarrow\) now transparent at longer wavelengths
- Newborn stars (~3,000 K) \(\rightarrow\) Wien’s peak in near-IR, revealed!
Wien’s Law told astronomers where to look (near-infrared, where cold dust becomes transparent). Stefan-Boltzmann told them what they’d find (cool but real protostars, radiating powerfully at infrared wavelengths). This is why NASA built a $10 billion infrared telescope.
Worked Example
Problem: Two stars have the same surface temperature (same color). Star A has \(100\times\) the luminosity of Star B. How do their radii compare?
Solution: Since \(L \propto R^2 T^4\) and \(T\) is the same: \[ \frac{L_A}{L_B} = \frac{R_A^2}{R_B^2} = 100 \] \[ \frac{R_A}{R_B} = 100^{1/2} = 10 \]
Star A has 10 times the radius of Star B.
The Astronomer’s Shortcut: Working in Solar Units
The L-T-R equation (\(L = 4\pi R^2 \sigma T^4\)) has constants like \(4\pi\) and \(\sigma\) that are awkward to use in practice. Professional astronomers avoid them with a simple trick: write the equation for a star and for the Sun, then divide.
Write the equation for any star: \(L_\star = 4\pi R_\star^2 \sigma T_\star^4\)
Write the same equation for the Sun: \(L_\odot = 4\pi R_\odot^2 \sigma T_\odot^4\)
Divide star by Sun:
\[ \frac{L}{L_\odot} = \left(\frac{R}{R_\odot}\right)^2 \left(\frac{T}{T_\odot}\right)^4 \]
All constants cancel! You only need ratios — no SI units, no scientific notation, no \(\sigma\).
This works because \(4\pi\) and \(\sigma\) are the same for every star. The physics is in how a star compares to the Sun.
Worked Example — Sirius A:
Sirius A has \(L = 25\,L_\odot\) and \(T = 9940\,\mathrm{K}\). What is its radius?
\[ 25 = \left(\frac{R}{R_\odot}\right)^2 \left(\frac{9940\,\mathrm{K}}{5800\,\mathrm{K}}\right)^4 = \left(\frac{R}{R_\odot}\right)^2 \times (1.71)^4 = \left(\frac{R}{R_\odot}\right)^2 \times 8.6 \]
\[ \frac{R}{R_\odot} = \left(\frac{25}{8.6}\right)^{1/2} = 2.9^{1/2} = 1.7 \]
Sirius A is about 1.7 times the Sun’s radius — hot and slightly larger.
Worked Example — Betelgeuse:
Betelgeuse has \(T \approx 3500\,\mathrm{K}\) and \(L \approx 10^5\,L_\odot\). How big is it?
\[ 10^5 = \left(\frac{R}{R_\odot}\right)^2 \left(\frac{3500\,\mathrm{K}}{5800\,\mathrm{K}}\right)^4 = \left(\frac{R}{R_\odot}\right)^2 \times (0.60)^4 = \left(\frac{R}{R_\odot}\right)^2 \times 0.13 \]
\[ \frac{R}{R_\odot} = \left(\frac{10^5}{0.13}\right)^{1/2} = (7.7 \times 10^5)^{1/2} \approx 880 \]
Betelgeuse is about 880 times the Sun’s radius — roughly 4 AU, large enough to swallow Mars and the entire asteroid belt. Its temperature is low (so \(T^4\) is small), but its enormous surface area makes it incredibly luminous.

What to notice: Betelgeuse is a red supergiant with a surface temperature of only ~3500 K, yet its luminosity is ~100,000 L☉ — the ratio method reveals it must be ~880 times the Sun’s radius. (Credit: ESO)
Preview: The H-R Diagram
In Module 2, we’ll study the Hertzsprung-Russell (H-R) diagram — a plot of stellar luminosity vs. temperature. You’ll see that:
- Main sequence stars (like the Sun) follow a diagonal strip
- Giants and supergiants are above the main sequence — same temperature, higher luminosity, therefore larger
- White dwarfs are below — same temperature, lower luminosity, therefore smaller
The L-T-R relationship makes sense of the whole diagram.
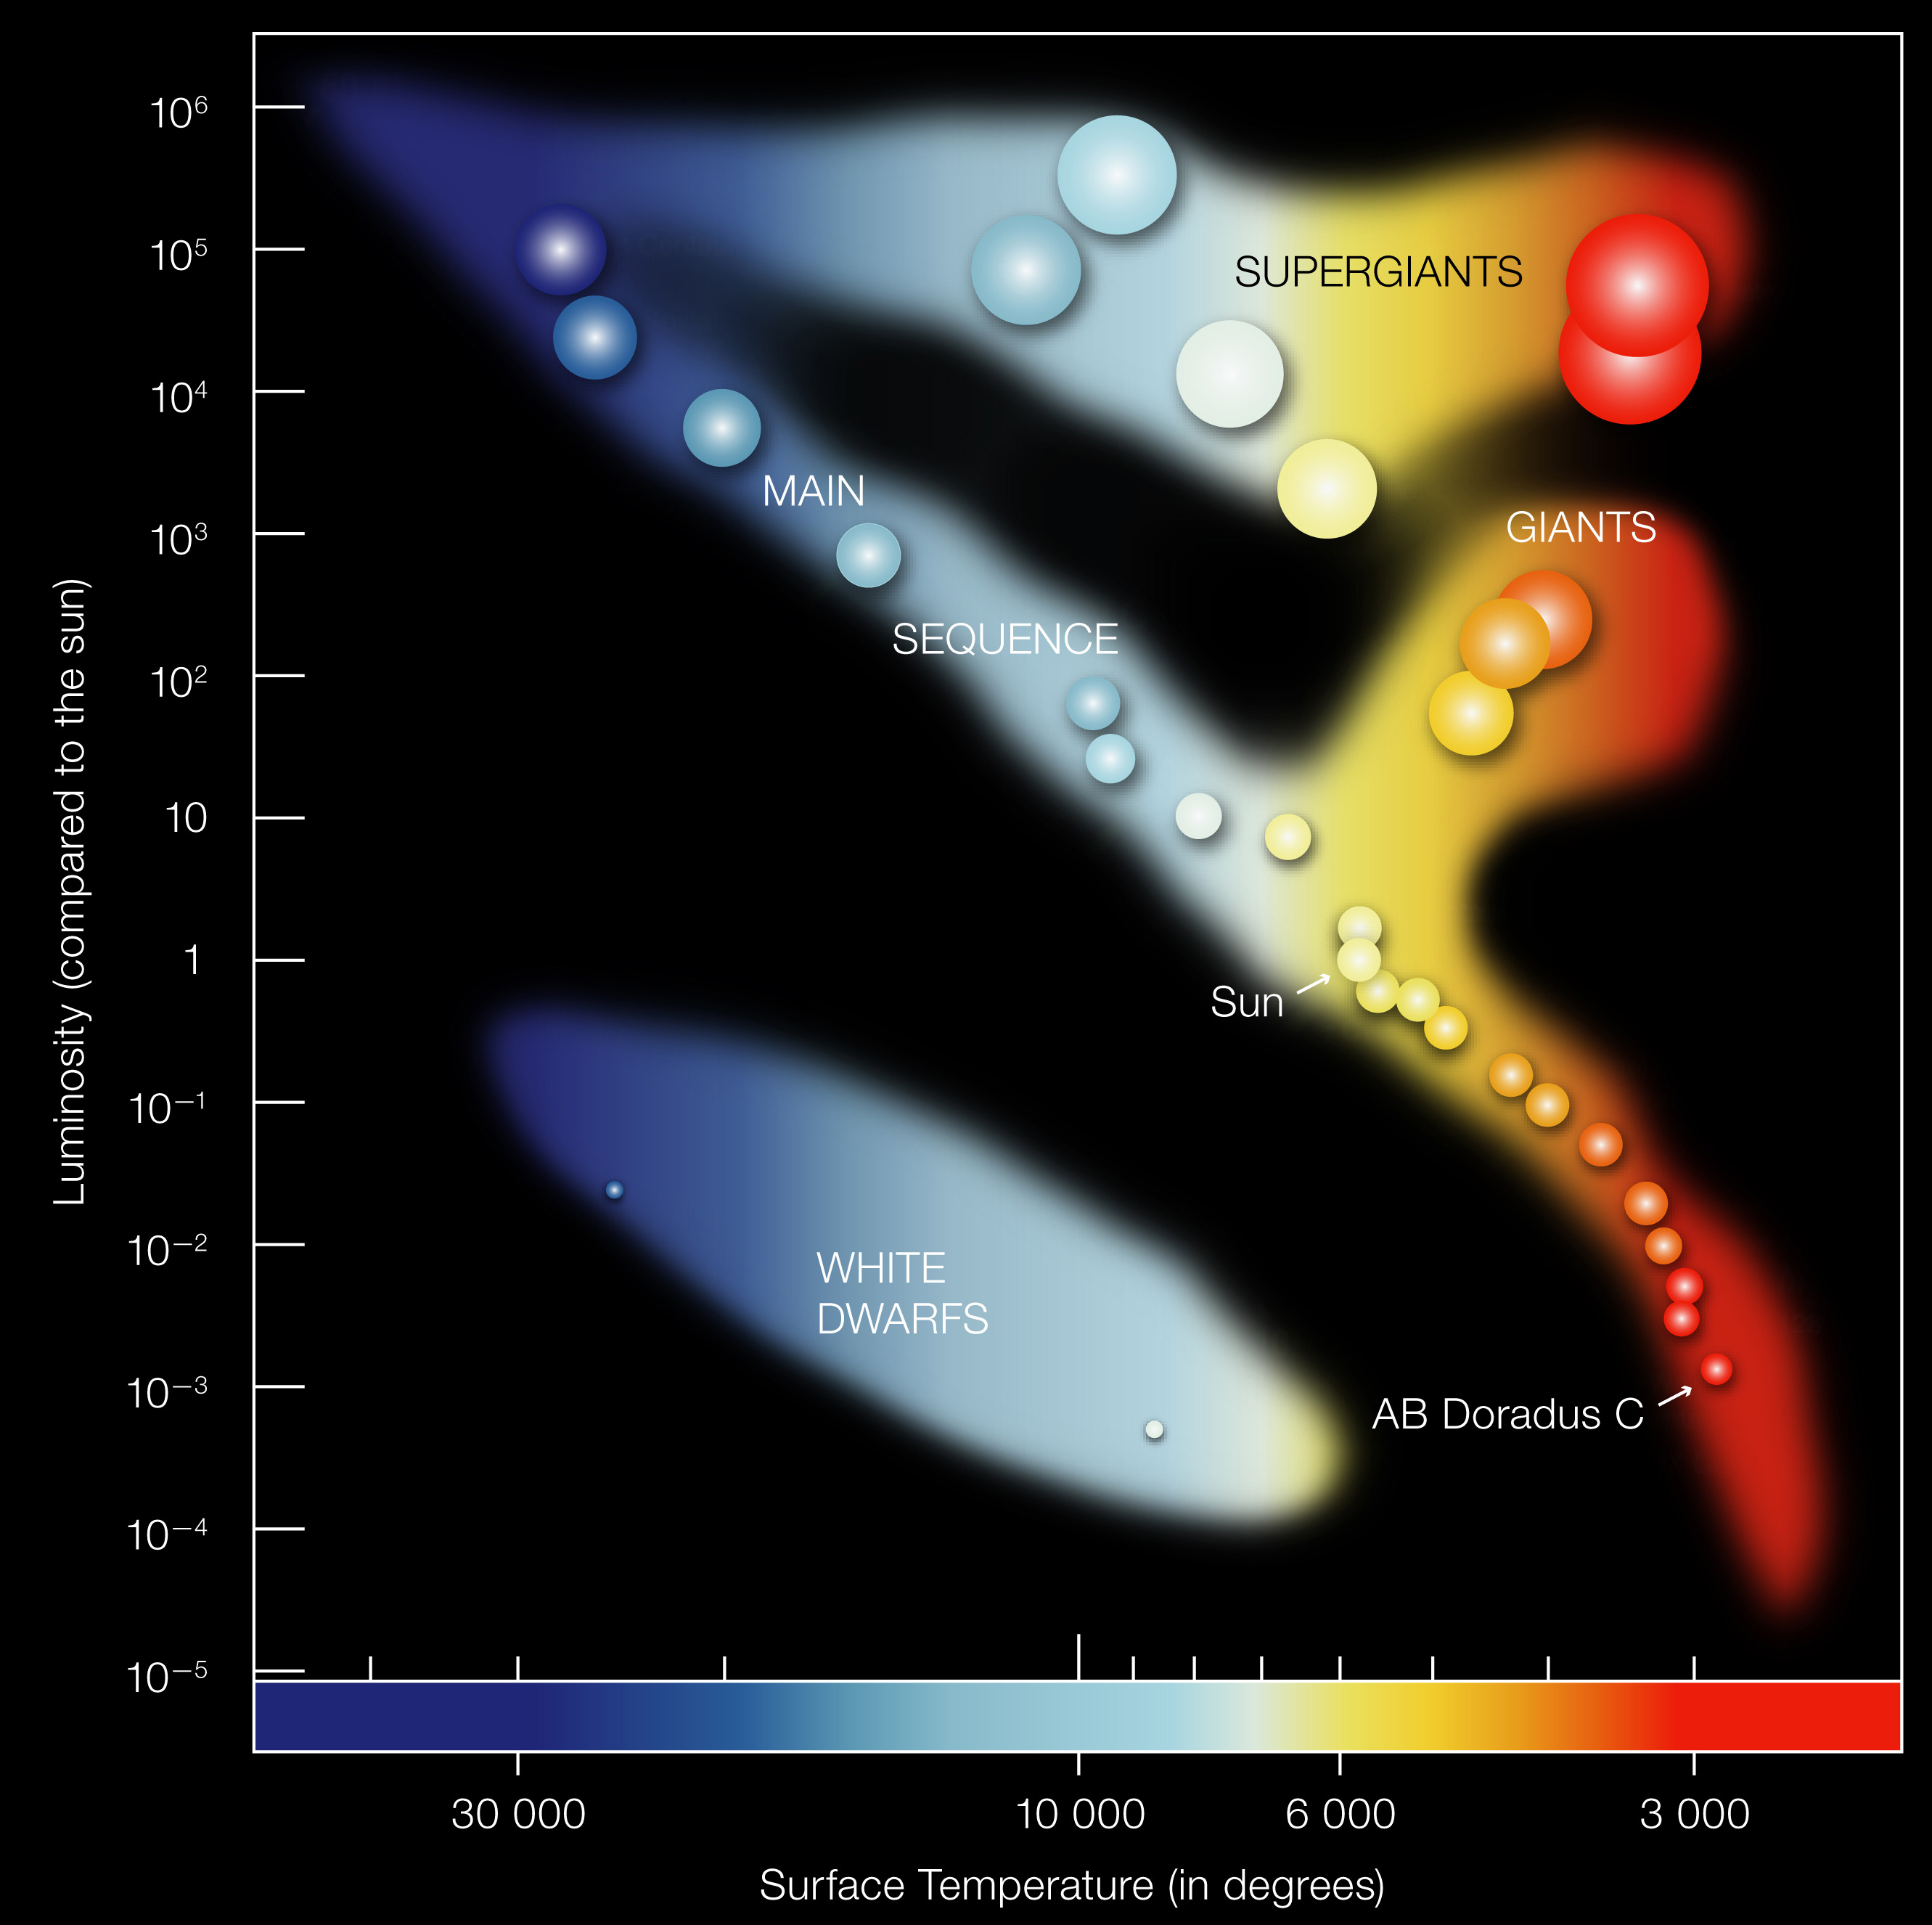
What to notice: the H-R diagram plots luminosity vs. temperature; most stars fall on the main sequence, while giants (upper right) and white dwarfs (lower left) occupy separate regions. Star size and color vary systematically with position. (Credit: ESO)
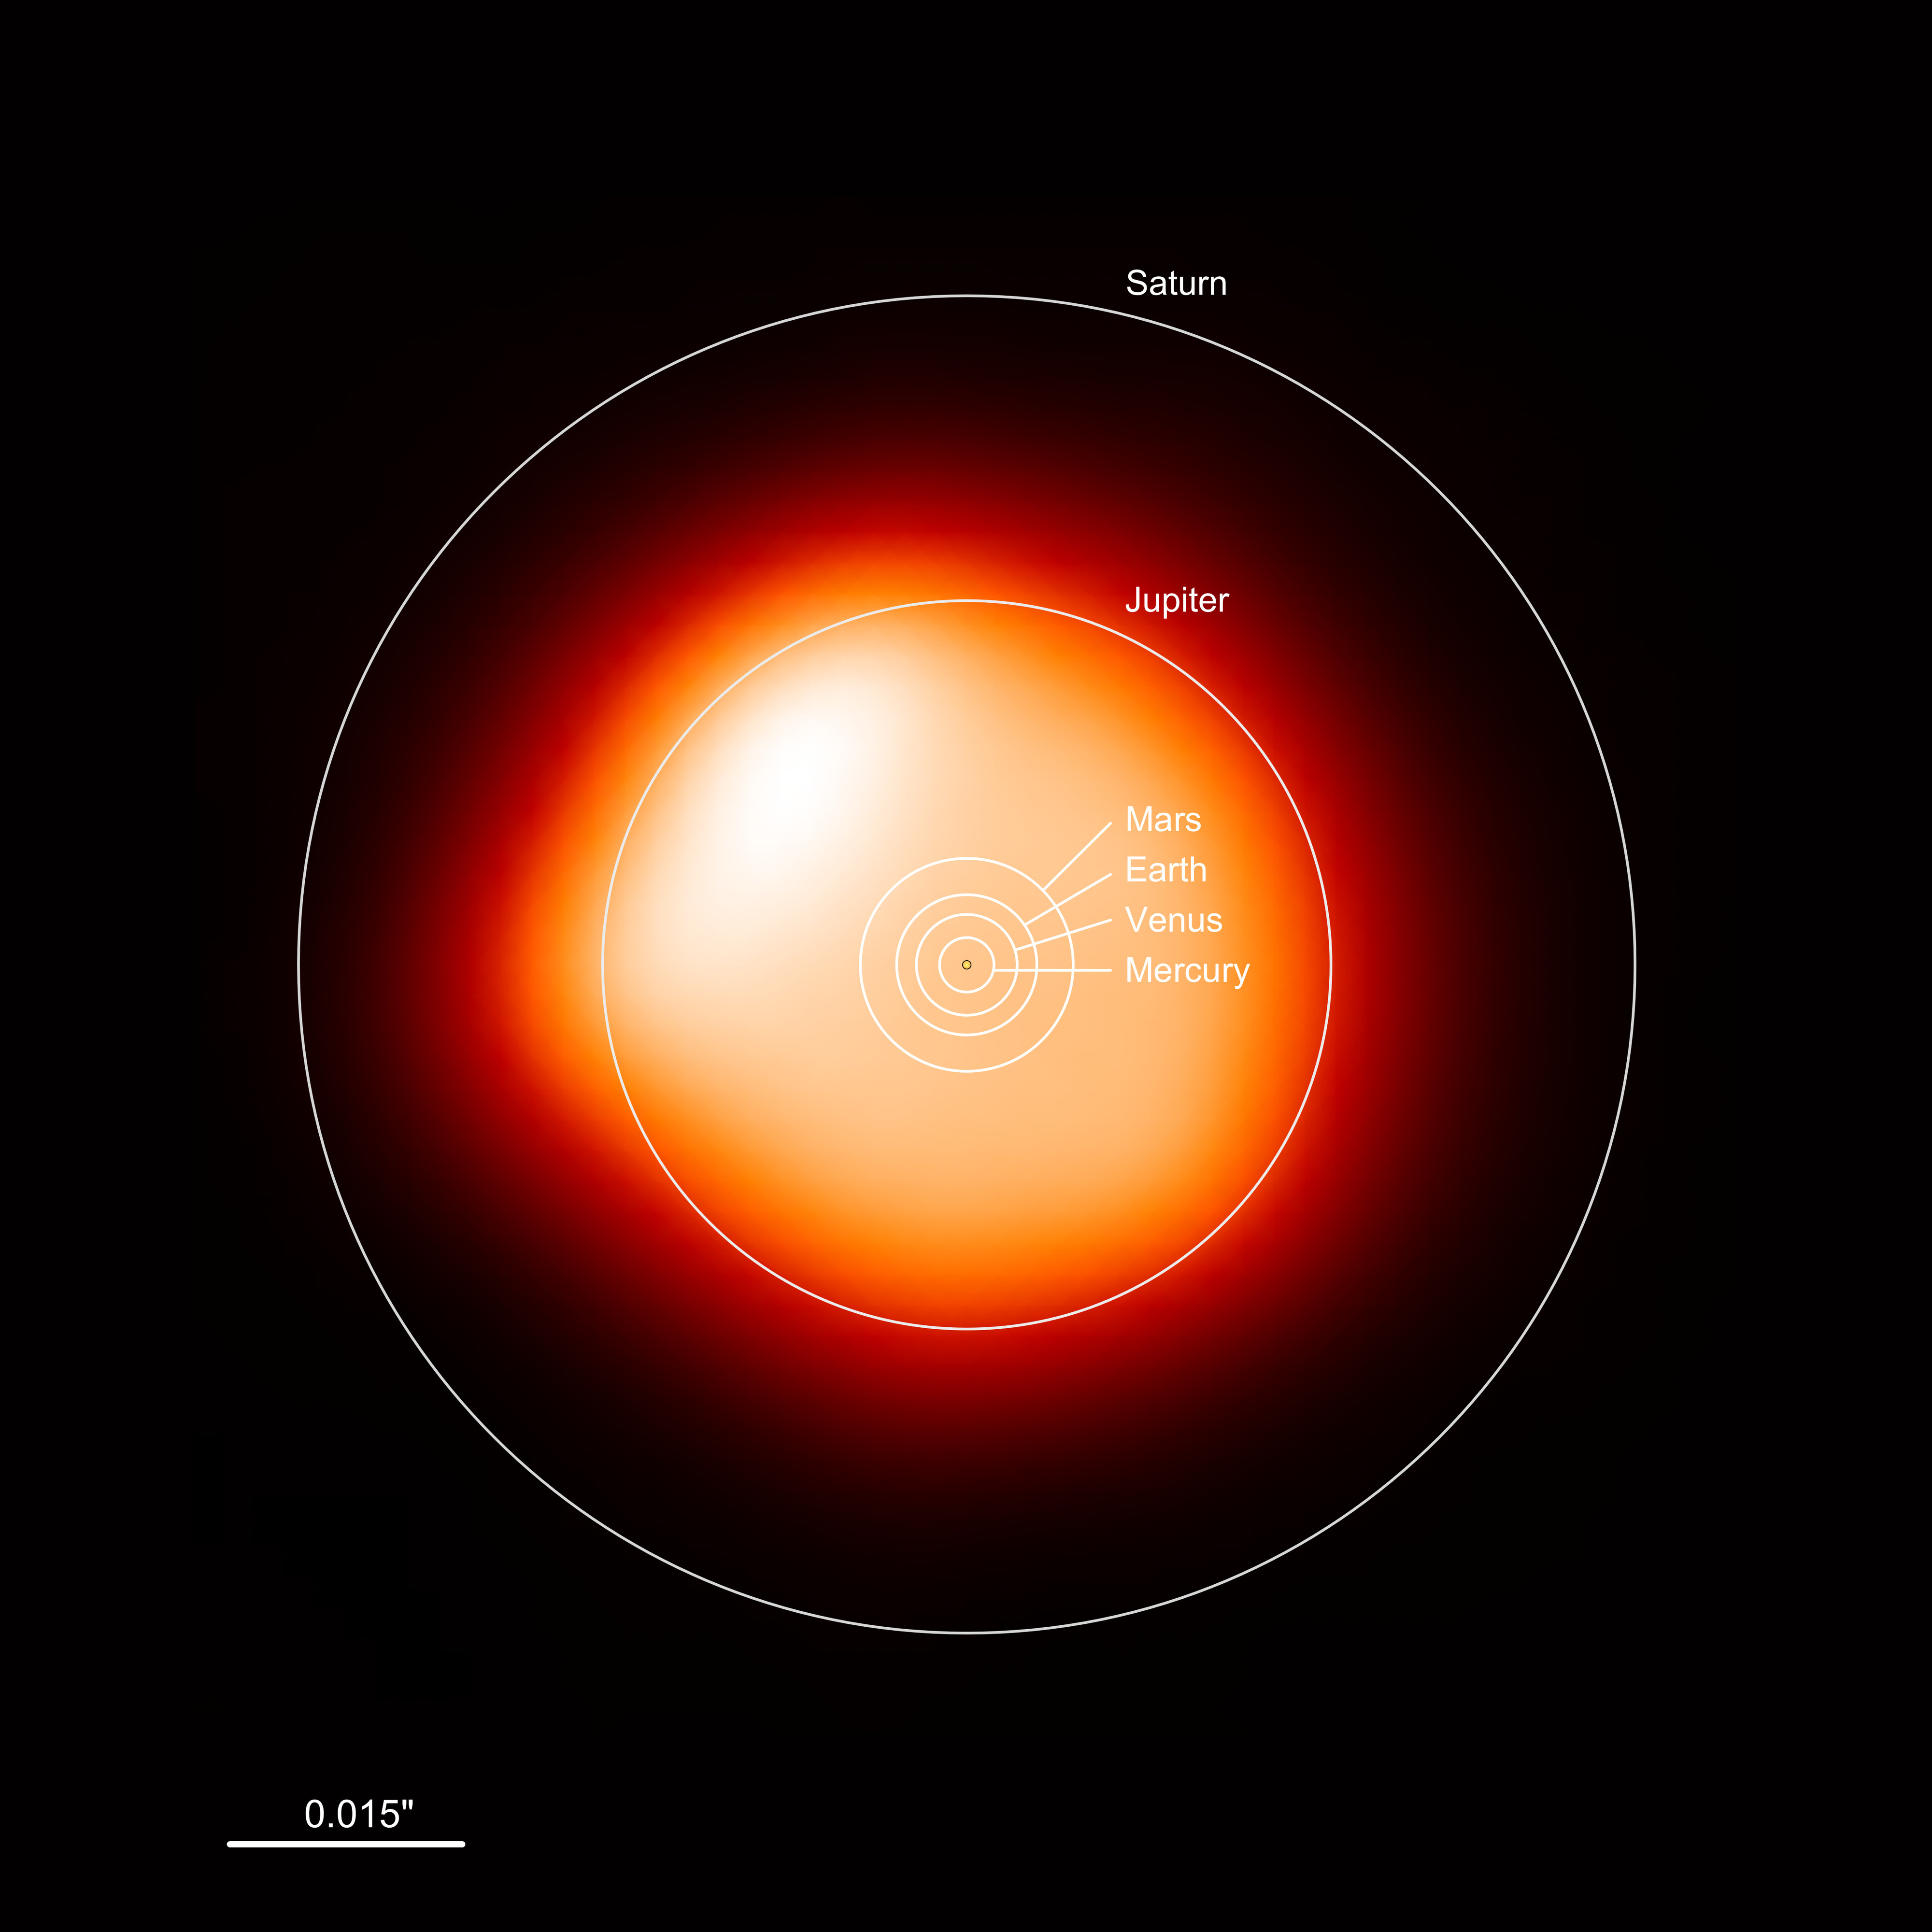
What to notice: this ALMA millimeter-continuum image shows Betelgeuse—around 1400 times the Sun’s size in the millimeter continuum—with an overlay comparing it to the Solar System; it would engulf the inner planets and even Jupiter, while Saturn would remain beyond its surface. (Credit: ESO/ALMA)
A red giant and a red dwarf have the same surface temperature (both appear red). The red giant is \(10^4\) times more luminous. How do their radii compare?
- The giant’s radius is \(10\times\) the dwarf’s
- The giant’s radius is \(100\times\) the dwarf’s
- The giant’s radius is \(10^4\) times the dwarf’s
- Their radii are the same
B) The giant’s radius is \(100\times\) the dwarf’s. Since both have the same temperature, \(L \propto R^2\). If luminosity ratio is \(10^4\), then: \(R_{\text{giant}}/R_{\text{dwarf}} = (10^4)^{1/2} = 100\).
The red giant’s radius is \(100\times\) larger than the red dwarf’s!
Star X is twice as hot as Star Y and has half the radius. How does Star X’s luminosity compare to Star Y’s?
- Same luminosity
- \(2\times\) more luminous
- \(4\times\) more luminous
- \(8\times\) more luminous
C) \(4\times\) more luminous. Using \(L \propto R^2 T^4\):
\[ \frac{L_X}{L_Y} = \left(\frac{R_X}{R_Y}\right)^2 \left(\frac{T_X}{T_Y}\right)^4 = \left(\frac{1}{2}\right)^2 \times (2)^4 = \frac{1}{4} \times 16 = 4 \]
Temperature’s \(T^4\) dependence dominates over the smaller size.
🔭 Demo Exploration: Blackbody Radiation
Use the interactive demo below (or open it in a new tab ↗) to explore how temperature affects the blackbody spectrum — both the peak wavelength (Wien’s Law) and the total energy output (Stefan-Boltzmann).
Demo Mission 1: Finding the Sun’s Peak
Predict before you explore: Where should the Sun’s spectrum peak? In what color?
Using Wien’s Law with \(T \approx 5800\,\mathrm{K}\): \(\lambda_{\text{peak}} =\) _____ nm. This is in the _____ part of the visible spectrum.
Do this:
- Set the temperature slider to ~5800 K
- Observe where the peak falls on the wavelength axis
- Note which visible color this corresponds to
The peak falls at approximately 500 nm — green light! Yet the curve shows significant emission across the entire visible spectrum (400-700 nm), which is why the Sun appears white, not green.
Claim: Wien’s Law correctly predicts the Sun peaks in green, but the broad spectrum means we perceive white light.
Evidence: The demo shows the 5800 K curve spanning all visible wavelengths with substantial intensity.
Demo Mission 2: Hot vs. Cool Stars
Predict before you explore: If you compare a 3000 K star to a 10,000 K star:
- Which peaks at a shorter wavelength?
- Which emits more total energy (taller curve)?
Shorter wavelength peak: _____ Higher total energy: _____
Do this:
- Set temperature to 3000 K and note the peak wavelength and curve height
- Change to 10,000 K and observe both changes
- Compare the two curves
The 10,000 K star:
- Peaks at a much shorter wavelength (around 290 nm, in UV)
- Has a much taller curve (much more total energy)
The 3000 K star:
- Peaks in the infrared (~970 nm)
- Has a much lower curve (less total energy)
Claim: Wien’s Law (peak wavelength) and Stefan-Boltzmann Law (total power) both operate. Hot stars peak at shorter wavelengths AND emit dramatically more energy.
Evidence: The \(10^4\,\mathrm{K}\) curve is shifted left (shorter wavelength) AND higher (more total area under the curve). The \(T^4\) dependence means the hot star emits \((10^4\,\mathrm{K}/3000\,\mathrm{K})^4 \approx 120\times\) more power per unit area!
Demo Mission 3: Measuring an Unknown Star’s Temperature
Do this:
- Have a partner click Cycle Presets (or choose a preset like O/B/A/Sun/K/M) while you look away, or have them set a random temperature with the slider
- Look at where the spectrum peaks
- Use Wien’s Law to estimate the temperature: \(T = 2.9 \times 10^6\,\mathrm{nm\cdot K}\, /\, \lambda_{\text{peak}}\,(\mathrm{nm})\)
- Check your answer against the slider
This is exactly what astronomers do! By measuring the peak wavelength of a star’s spectrum, we can determine its temperature without ever touching it.
Claim: Wien’s Law lets us measure stellar temperatures remotely.
Evidence: Your temperature estimate from the peak wavelength should match the actual temperature within a few percent.
Part 4: Transition to Spectral Lines
Step through how astronomers analyze starlight — from naked-eye view to spectrum to physical interpretation. The smooth curve is the blackbody continuum; the dark lines on top are spectral absorption lines (Lecture 9).
What Blackbodies Can and Cannot Tell Us
The Power of Blackbody Physics
With blackbody radiation, we can measure:
- Temperature (from peak wavelength via Wien’s Law)
- Luminosity (from the total spectrum intensity via Stefan-Boltzmann)
- Radius (if we know both L and T, we can calculate R)
This is remarkable — three fundamental properties of a star, from analyzing its light.
What’s Missing?
But there’s something blackbody spectra can’t tell us directly:
- Composition: What is the star made of? Hydrogen? Helium? Metals?
- Motion: Is the star moving toward or away from us?
- Chemical abundances: How much of each element is present?
A perfect blackbody spectrum is smooth — no features, no fingerprints. To get composition and motion, we need something more.
Enter Spectral Lines
Here’s the key insight for Lecture 9: Real stars aren’t perfect blackbodies. Their spectra have discrete features — bright or dark lines at specific wavelengths. These are spectral lines, and they’re the fingerprints of chemical elements.
- Each element absorbs or emits light at specific wavelengths
- The pattern of lines is unique to each element — like a barcode
- By identifying the lines, we identify the elements present
- By measuring line shifts, we detect motion (Doppler effect)
Every Atom Has Its Own Fingerprint
Why do elements produce lines at specific wavelengths? It comes down to quantum mechanics: electrons in atoms can only occupy certain energy levels. When an electron jumps between levels, it absorbs or emits a photon with exactly the right energy — and therefore exactly the right wavelength.
Hydrogen, the simplest atom, produces a distinctive pattern of lines called the Balmer series (in visible light). These appear at 656 nm (red), 486 nm (blue-green), 434 nm (violet), and so on. No other element produces this exact pattern.
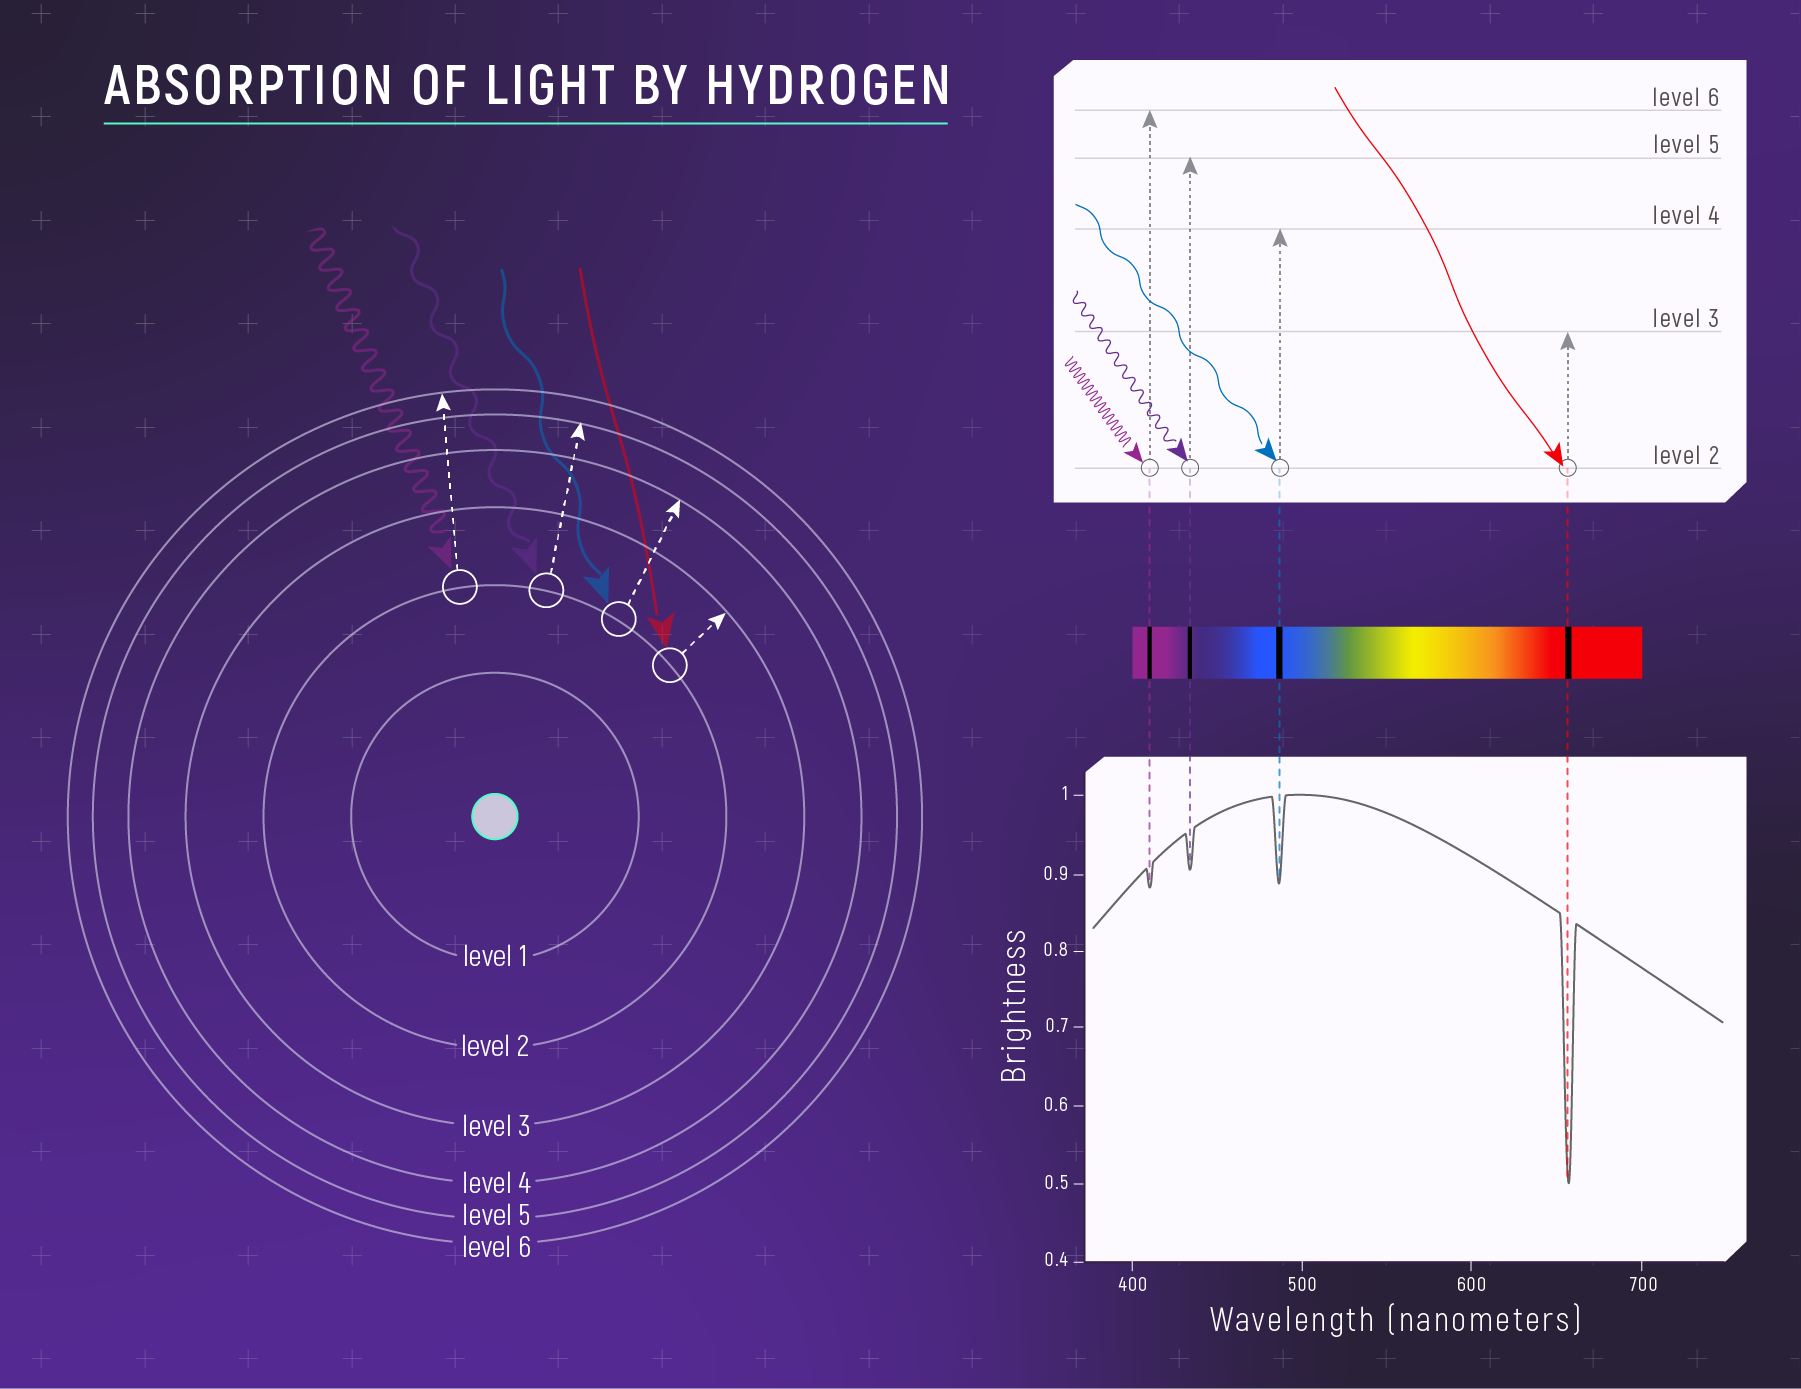
What to notice: when cooler hydrogen gas sits in front of a hotter source, it absorbs specific wavelengths—creating dark absorption lines. (Credit: Illustration: NASA, ESA, CSA)
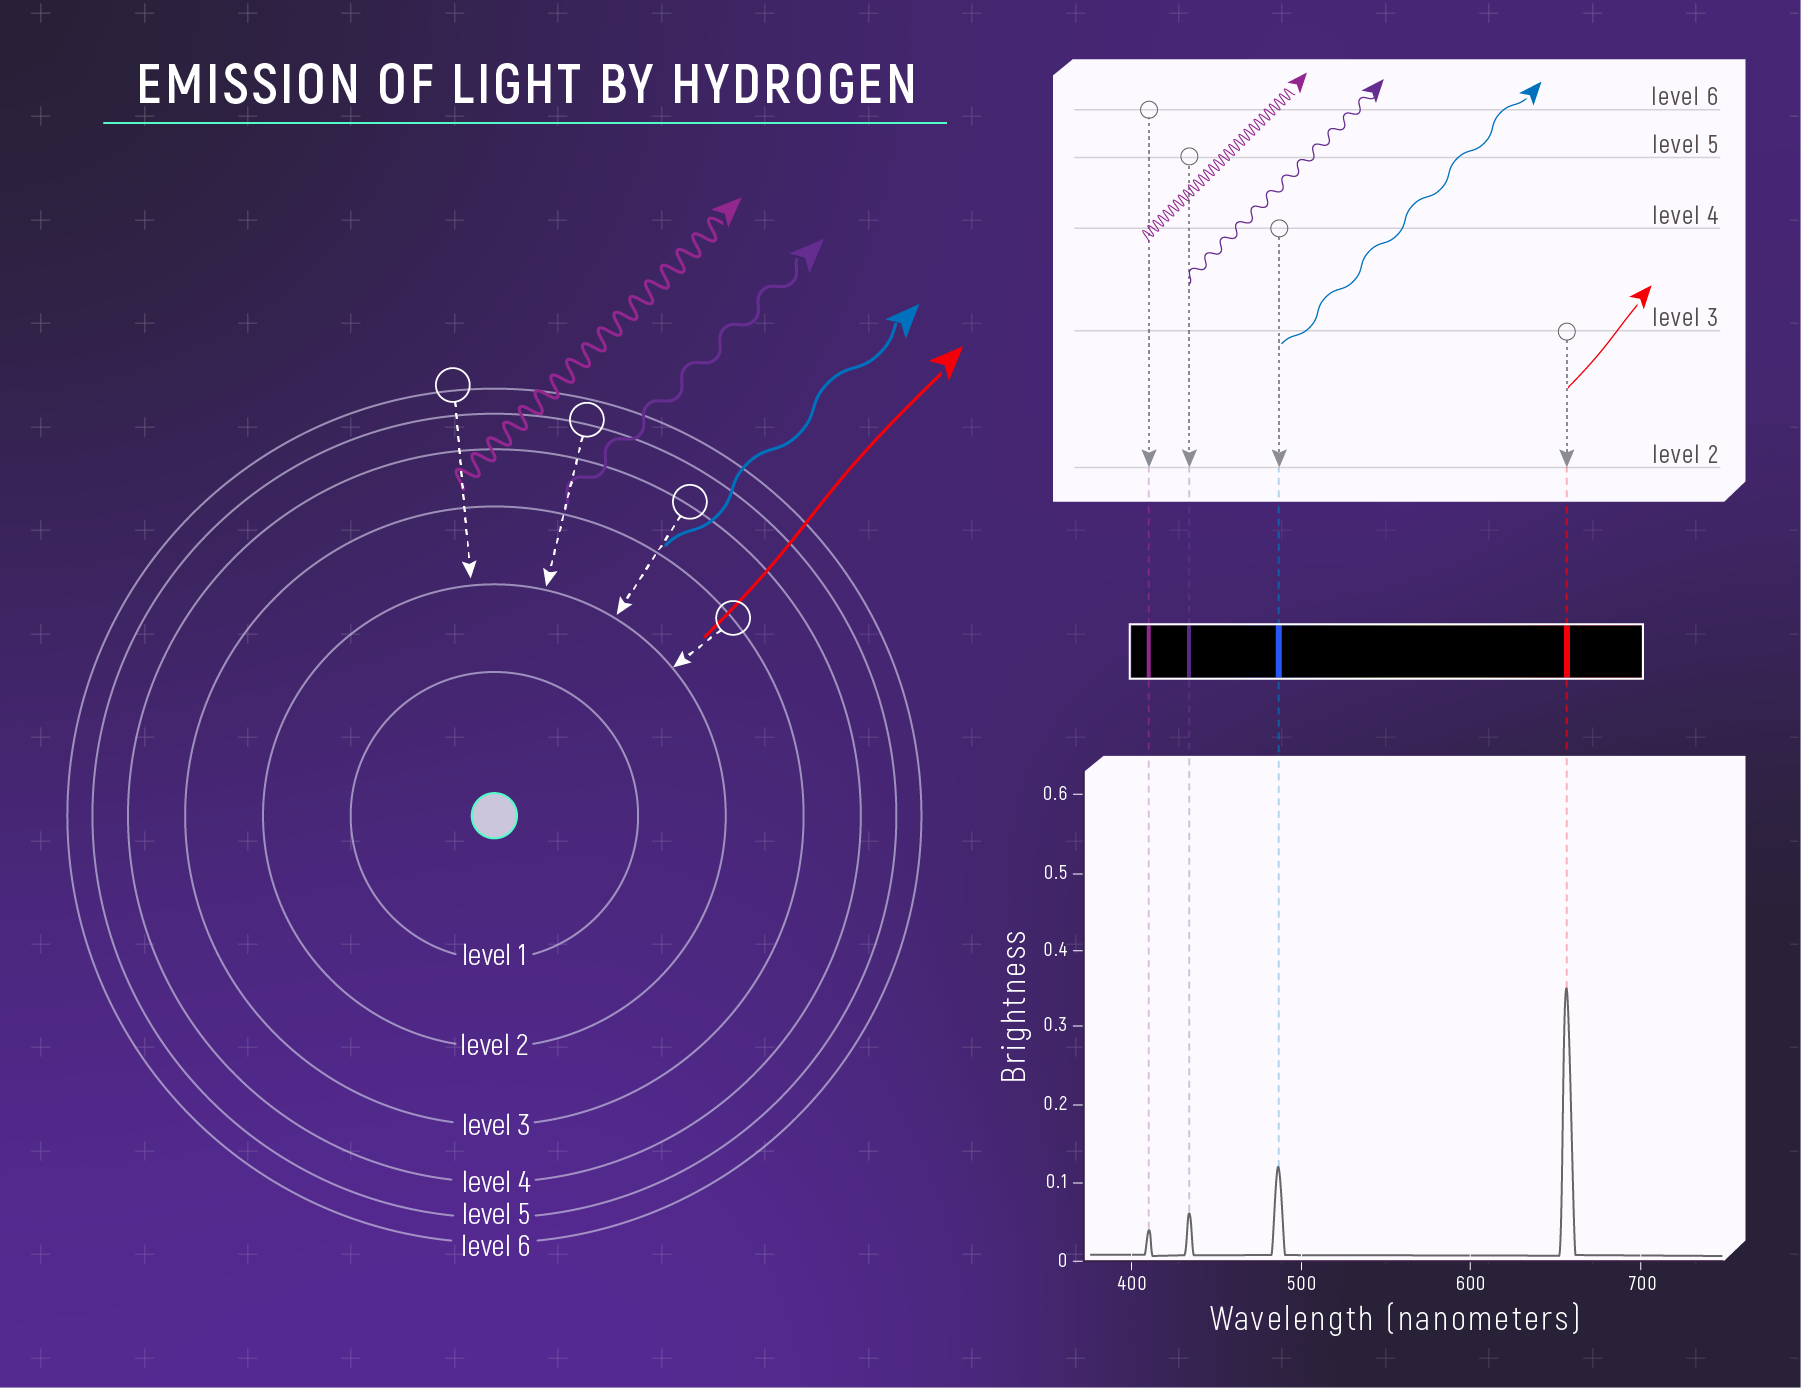
What to notice: a hot, low-density hydrogen gas emits light at specific wavelengths—creating bright emission lines. (Credit: Illustration: NASA, ESA, CSA)
Absorption vs. Emission: When light from a hot, bright source passes through cooler gas, the gas absorbs specific wavelengths — creating dark lines against a bright continuum. When hot, thin gas glows on its own, it emits only those same wavelengths — creating bright lines against a dark background. Same atomic fingerprint, opposite appearance.
Every element and molecule — hydrogen, helium, sodium, water vapor, carbon dioxide — has its own unique pattern of lines. By matching observed patterns to laboratory measurements, astronomers can identify what’s present in a star, nebula, or exoplanet atmosphere from across the cosmos.
Lecture 8 (today): Blackbody radiation tells us temperature (Wien’s Law) and luminosity (Stefan-Boltzmann). Peak wavelength reveals how hot a star is.
Lecture 9 (next): Spectral lines tell us composition (what elements are present) and motion (Doppler shifts). They’re the missing pieces that turn temperature into a full chemical and kinematic portrait.
Together: We can measure a star’s temperature, luminosity, size, composition, and velocity — all from analyzing its light.
When you observe the Sun’s spectrum, you see the smooth blackbody curve with hundreds of dark lines superimposed — wavelengths where light has been absorbed by atoms in the Sun’s outer layers. In 1860, Gustav Kirchhoff showed that each element produces its own unique pattern of lines.

What to notice: the photosphere is the layer where photons finally escape the star. Below it, the star is opaque and radiation is thermalized (blackbody). Absorption lines form as photons pass through the cooler outer layers. (Credit: cococubed.com)
We’ll explore this in detail in Lecture 9, where we’ll learn to “read” stellar spectra like chemical barcodes.
Everything above absolute zero emits thermal radiation. Hotter objects emit more and at shorter wavelengths.
A blackbody is an idealized perfect emitter/absorber whose spectrum depends only on temperature.
Wien’s Law: \(\lambda_{\text{peak}}\,(\mathrm{nm}) = 2.9 \times 10^6\,\mathrm{nm\cdot K}\, /\, T\,(\mathrm{K})\). Hot \(\to\) peak at short wavelengths (blue). Cool \(\to\) peak at long (red).
The Sun peaks at green (~500 nm) but appears white because it emits broadly across all visible wavelengths.
Stefan-Boltzmann Law: Power per unit area scales as \(T^4\). At fixed radius, doubling \(T\) makes luminosity \(16\times\) larger.
L-T-R Relationship: \(L = 4\pi R^2 \sigma T^4\). Use the ratio method — \(L/L_\odot = (R/R_\odot)^2 (T/T_\odot)^4\) — to skip the constants.
Blackbodies reveal temperature, but not composition or motion. For those, we need spectral lines (Lecture 9).
Self-Assessment Checklist
Before moving on, check whether you can do each of the following. If any feel shaky, revisit the corresponding section.
Practice Problems
Solutions are available in the Lecture 8 Solutions.
Core (do these first)
1. Wien’s Law: A star’s spectrum peaks at 580 nm. Calculate its surface temperature.
2. Wien’s Law (reverse): What is the peak wavelength for a 4000 K star? Is this in visible light, infrared, or ultraviolet?
3. Stefan-Boltzmann: Star A is three times hotter than Star B. If they have the same radius, how much more luminous is Star A?
4. L-T-R: Two stars have identical temperatures but one is \(400\times\) more luminous. How do their radii compare?
5. Conceptual: Why does the Sun appear white rather than green, even though its peak wavelength is in the green part of the spectrum?
6. Star colors: Rank these stars from coolest to hottest based on color: a red star, a blue star, a yellow star.
Challenge
7. Combined Wien + Stefan-Boltzmann: Star X has twice the temperature and half the radius of Star Y.
- Where does Star X’s spectrum peak relative to Star Y’s?
- How does Star X’s luminosity compare to Star Y’s?
8. Earth as a blackbody: Earth has an effective temperature of about 255 K (due to energy balance with sunlight). At what wavelength does Earth’s thermal emission peak? In what part of the EM spectrum is this?
9. Size from L and T: The star Betelgeuse has a surface temperature of about \(3500\,\mathrm{K}\) and a luminosity of about \(10^5\,L_\odot\). The Sun has \(T = 5800\,\mathrm{K}\) and \(L = 1\,L_\odot\). Estimate the ratio \(R_{\text{Betelgeuse}}/R_{\odot}\).
Use the L-T-R relationship in ratio form: \[ \frac{R_{\text{Betelgeuse}}}{R_\odot} = \left(\frac{L_{\text{Betelgeuse}}}{L_\odot}\right)^{1/2} \times \left(\frac{T_\odot}{T_{\text{Betelgeuse}}}\right)^2 \]
10. Why blackbodies matter: Explain in your own words why blackbody physics is useful for astronomy, and what additional information (beyond temperature) requires spectral lines.
Glossary
| Term | Definition |
|---|---|
| Thermal radiation | EM radiation emitted by an object due to its temperature |
| Blackbody | An idealized object that absorbs all incident radiation and emits with a spectrum depending only on \(T\) |
| Blackbody spectrum | The characteristic continuous spectrum emitted by a blackbody; shape depends only on temperature |
| Wien’s Law | \(\lambda_{\text{peak}} \propto 1/T\); hotter objects peak at shorter wavelengths |
| Stefan-Boltzmann Law | Power per area \(= \sigma T^4\); radiated energy scales steeply with temperature |
| Luminosity (L) | Total power radiated by an object (watts or \(L_\odot\)) |
| L-T-R relationship | \(L = 4\pi R^2 \sigma T^4\); connects luminosity, temperature, and radius |
| Ratio method | Dividing the L-T-R equation for a star by the same equation for the Sun; all constants cancel, leaving \(L/L_\odot = (R/R_\odot)^2 (T/T_\odot)^4\) |
| Photosphere | The visible “surface” layer of a star from which light escapes; characterized by an effective temperature |
| Planck function | The equation \(B_\lambda(T)\) that describes the blackbody spectrum; temperature is the only variable |
| Giant star | A star with large radius and high luminosity relative to its temperature |
| Dwarf star | A star with small radius and low luminosity relative to its temperature |
| Spectral lines | Discrete features in a spectrum from absorption or emission by specific elements (covered in L9) |
- ★ Blackbody spectrum
- The characteristic continuous spectrum emitted by an idealized thermal radiator, determined only by temperature. The shape is universal; only the peak position and height change with temperature.
- ★ L-T-R Relation
- The relationship \(L = 4\pi R^2 \sigma T^4\) connecting luminosity, radius, and temperature. Knowing any two quantities allows calculation of the third.
- ★ Stefan-Boltzmann Law
- The total power radiated by a blackbody is proportional to the fourth power of temperature: \(L = 4\pi R^2 \sigma T^4\). Doubling temperature increases luminosity by 16×.
- ★ Wien's Law
- The peak wavelength of a blackbody spectrum is inversely proportional to temperature: \(\lambda_{peak} = b/T\). Hotter objects peak at shorter (bluer) wavelengths; b = 2.9 × 10⁶ nm·K.