The Cosmic Messenger — Light Carries Information
Lecture 7 Reading Companion
The Big Idea
You’ve never touched a star. You never will. Yet you can tell me a star’s temperature, composition, age, mass, and motion. How? Light. Light is the universe’s messenger — and learning to decode it is the astronomer’s superpower.
This reading introduces light as astronomy’s fundamental tool. Keep the big picture in mind: light is how the universe communicates with us.
Musts for today (~25 min):
- The Big Idea
- What is light? (waves, wavelength, frequency, \(c = \lambda \nu\))
- The electromagnetic spectrum (at least know the order!)
- Why the sky is blue (Rayleigh scattering)
- Why lunar eclipses are red (same physics)
Non-negotiable: Stop at every Check Yourself question — don’t just read past them!
Deep Dives (important but save for later):
- Speed of light and its implications
- Inverse-square law for intensity (preview of L8)
Connection to the Course:
- L5-L6: Motion reveals mass
- L7-L8: Light reveals everything else
- L9 (next): Spectral lines reveal composition and motion
If you only remember three things:
Light is an electromagnetic wave. Its wavelength determines its “color” — from radio (long) to gamma rays (short).
Wavelength carries information. The color of light tells you about the source: temperature, composition, motion.
Astronomy is information extraction. Every observation is about decoding the light that reaches us from cosmic sources.
Now for the details…
You’ve Never Touched a Star
Think about this for a moment: the closest star to the Sun — Proxima Centauri — is about 4 light-years away. That means light traveling at 300,000 km/s takes four years to reach us. In human terms, that’s roughly 40 trillion kilometers. You will never go there. No one alive today will visit another star.
And yet… we can tell you that Proxima Centauri is a red dwarf with a surface temperature of about 3,000 K. It has multiple confirmed planets. It occasionally releases violent flares. We know its mass, its age, its chemical composition.
How do we know all this about something we’ve never touched?
Because light carries information.
Every photon that reaches your telescope has a story to tell. Its wavelength reveals the temperature of the surface that emitted it. Subtle shifts in that wavelength reveal whether the source is moving toward or away from you. Specific wavelengths absorbed or emitted reveal which chemical elements are present.
In Lectures 5 and 6, we learned that motion reveals mass — by watching how things orbit, we can weigh the invisible. Now we’ll discover that light reveals everything else: temperature, composition, distance, velocity, age.
This lecture is about what light IS and why wavelength matters. Next lecture, we’ll see how to read temperature from light. Together, they give astronomers the tools to decode the cosmos without ever leaving Earth.
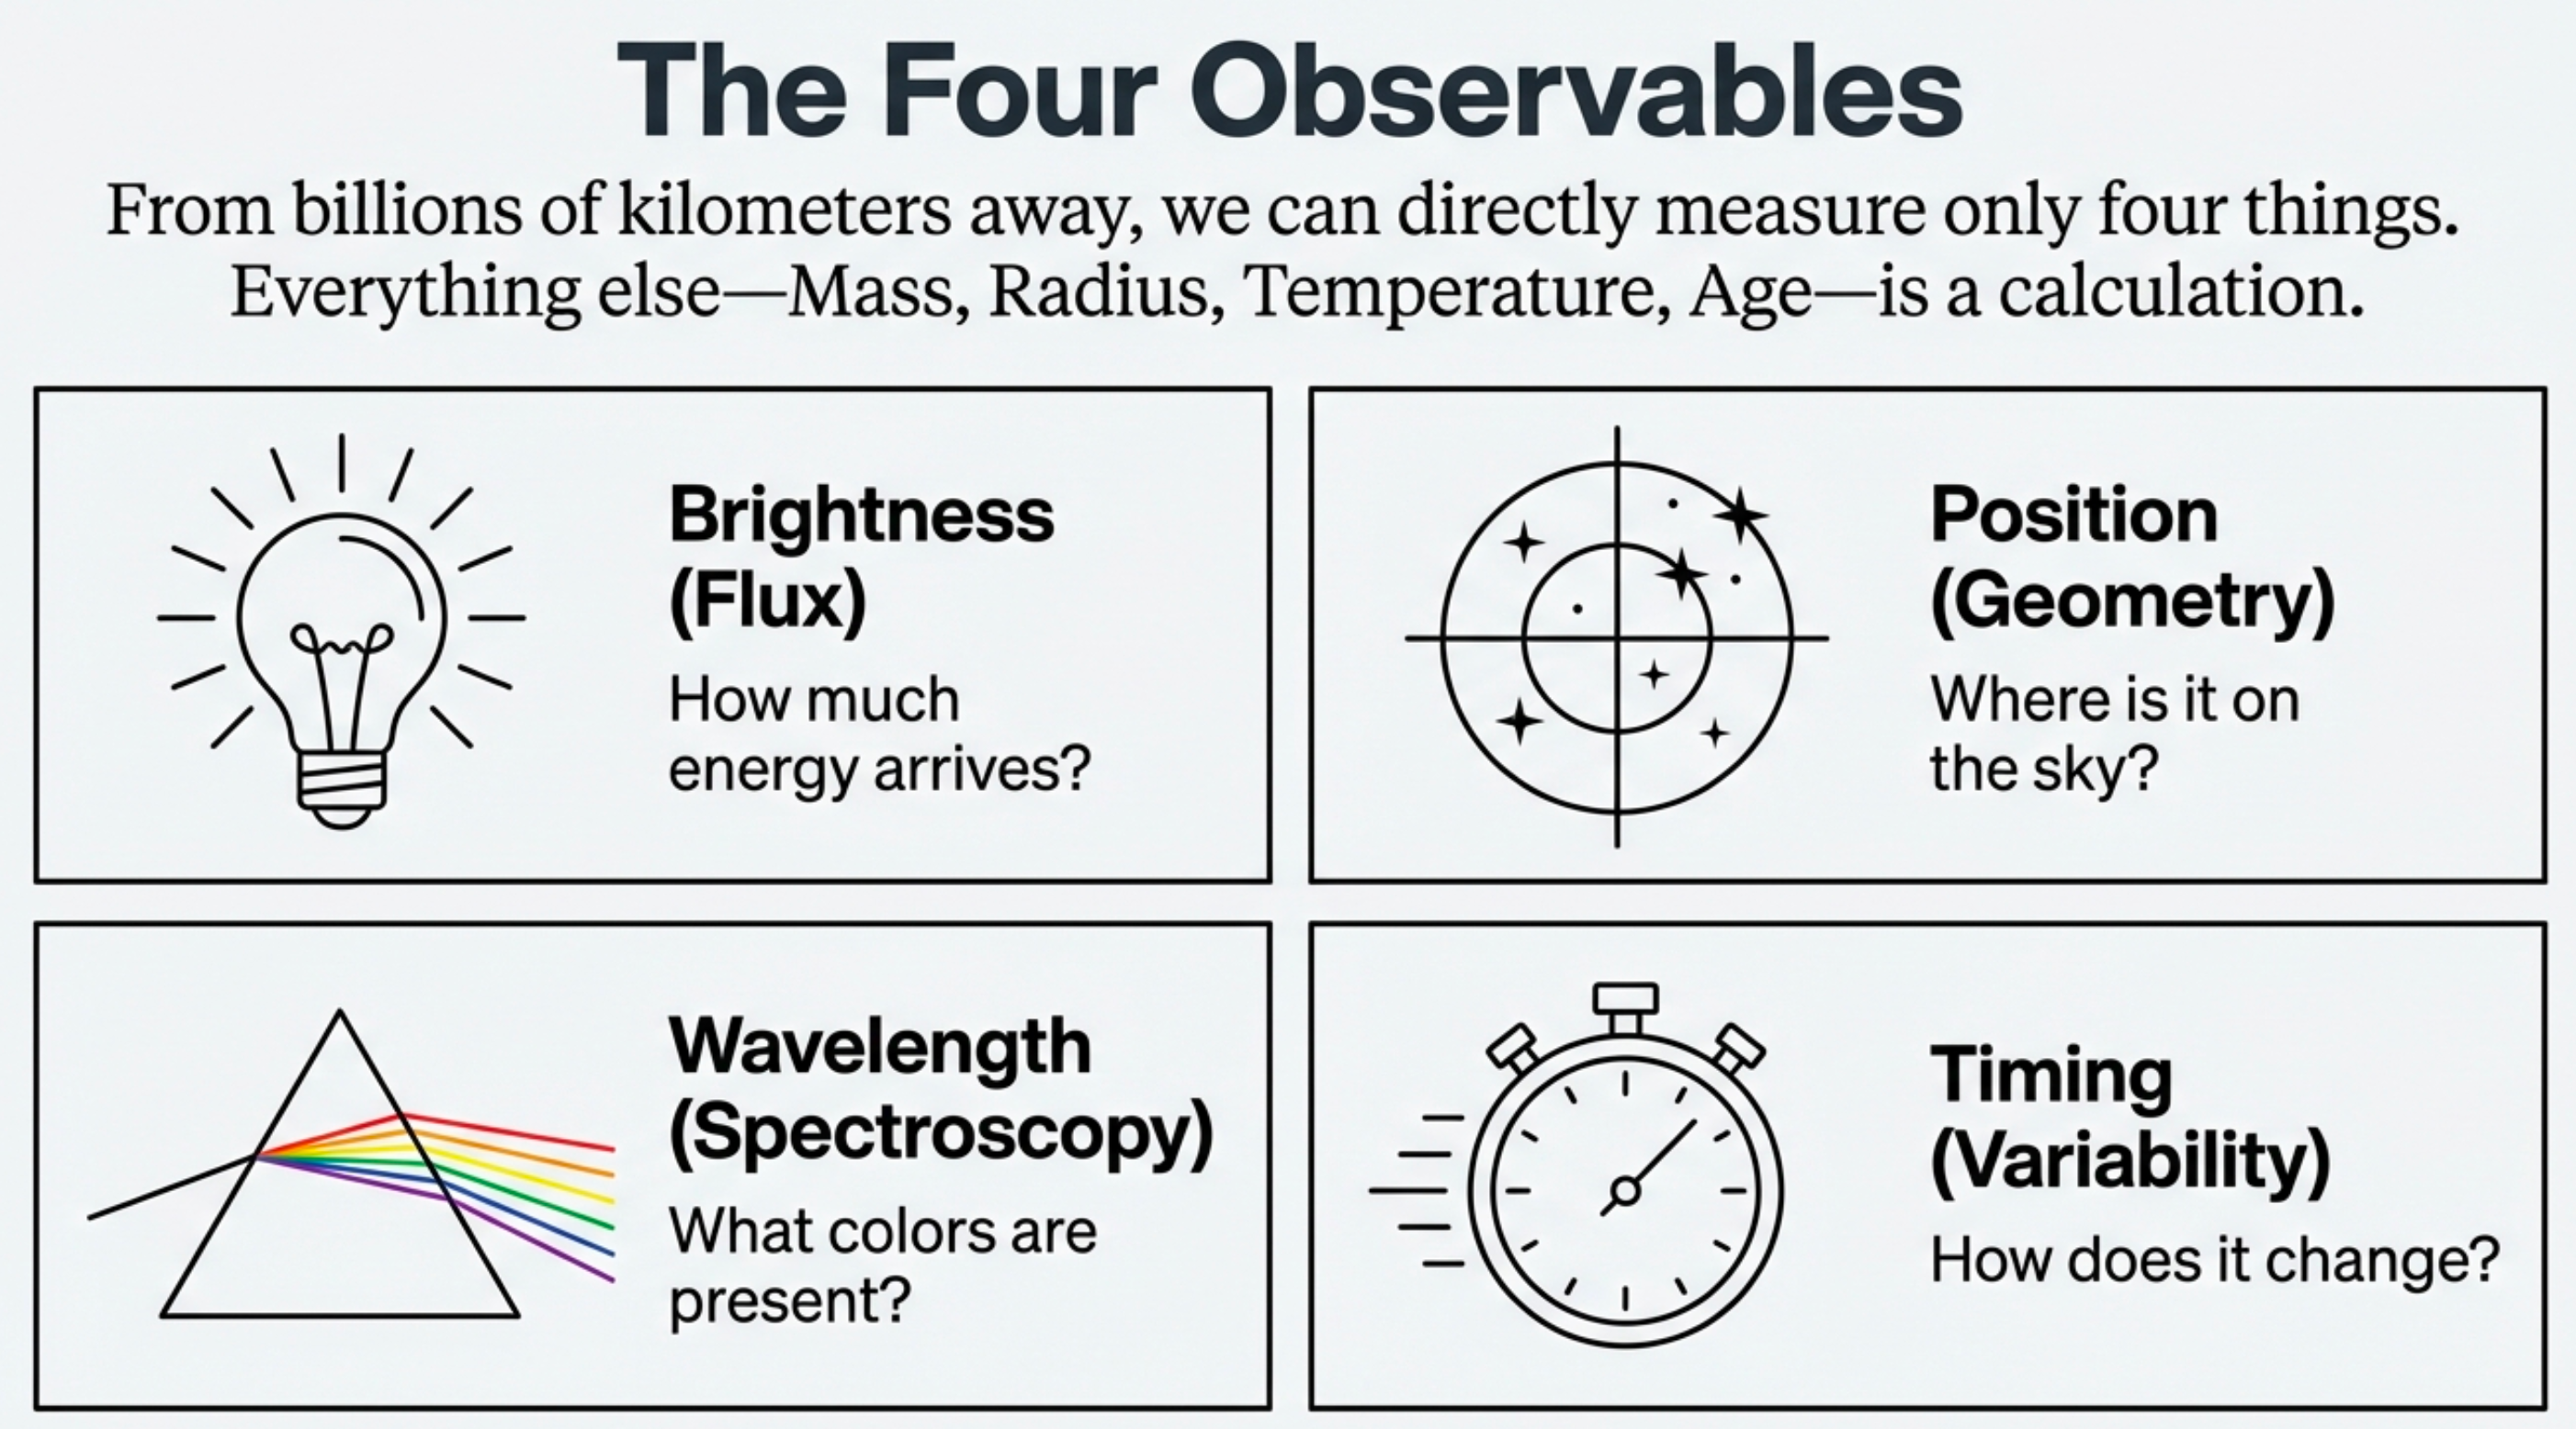
What to notice: From billions of kilometers away, we can directly measure only four things. Everything else—mass, radius, temperature, age—is a calculation. (Credit: (A. Rosen/NotebookLM))
Before this lecture, you might have assumed:
- We can only study things we can touch or visit
- Distant objects are fundamentally unknowable
The breakthrough: Light carries information across cosmic distances. Every wavelength is a data point. Every spectrum is a message.
In the last two lectures, we discovered how motion reveals mass:
- Kepler found patterns in planetary motion (empirical laws)
- Newton explained those patterns with gravity (physical law)
- By measuring orbits, we can “weigh” invisible objects
The key insight: Watching how things move tells us about the invisible forces and masses involved.
Now we turn to an even more powerful tool: light. With motion, we can measure mass. With light, we can measure temperature, composition, velocity, distance, and more — all without touching anything.
Part 1: What Is Light?
Light as a Wave
What exactly is light? For centuries, scientists debated whether light was made of particles or waves. The modern answer is “both” — light has wave-like and particle-like properties depending on the experiment. For understanding the electromagnetic spectrum and how light carries information, the wave picture is what we need.
Light is an electromagnetic wave — a self-propagating oscillation of electric and magnetic fields. Unlike ocean waves (which need water) or sound waves (which need air), electromagnetic waves need no medium at all. They travel perfectly well through the vacuum of space. This is why we can see starlight from billions of light-years away.
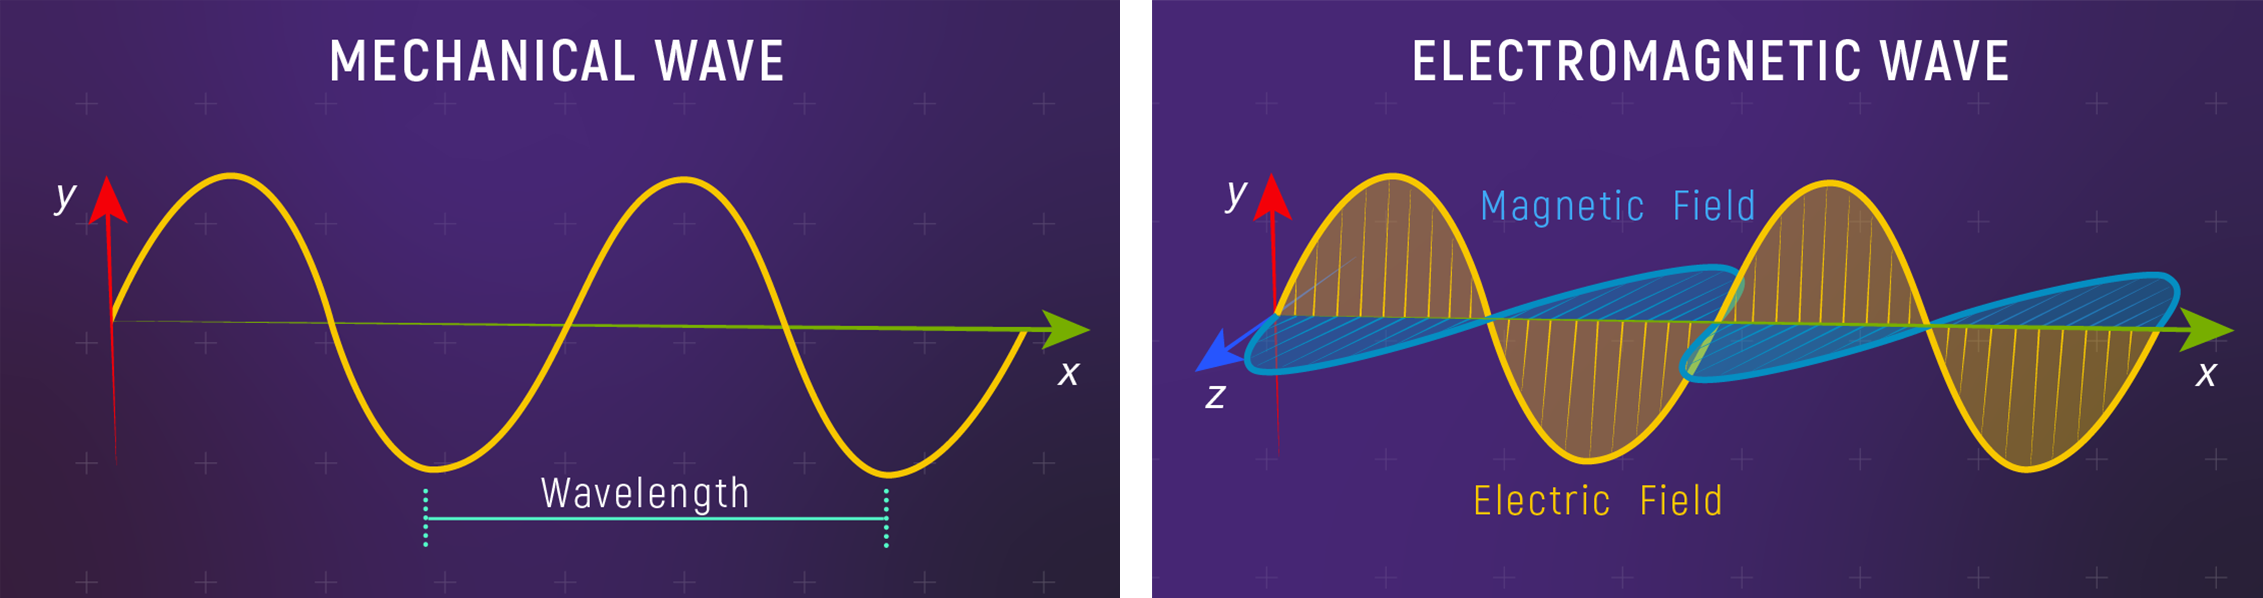
What to notice: both mechanical waves and electromagnetic waves have wavelength, but EM waves do not require a material medium. (Credit: Illustration: NASA, ESA, CSA)
Electromagnetic wave: A self-propagating wave of oscillating electric and magnetic fields. Light, radio, X-rays — all are electromagnetic waves.
Every electromagnetic wave has two fundamental properties:
Wavelength (\(\lambda\)): The distance between consecutive wave crests; measured in meters (or nanometers for visible light).
Frequency (\(\nu\)): How many wave crests pass a point per second; measured in hertz (Hz).
| Property | Symbol | What it measures | Units |
|---|---|---|---|
| Wavelength | \(\lambda\) (lambda) | Distance between wave crests | meters (m) or nanometers (nm) |
| Frequency | \(\nu\) | Wave crests passing per second | hertz (Hz) = cycles/second |
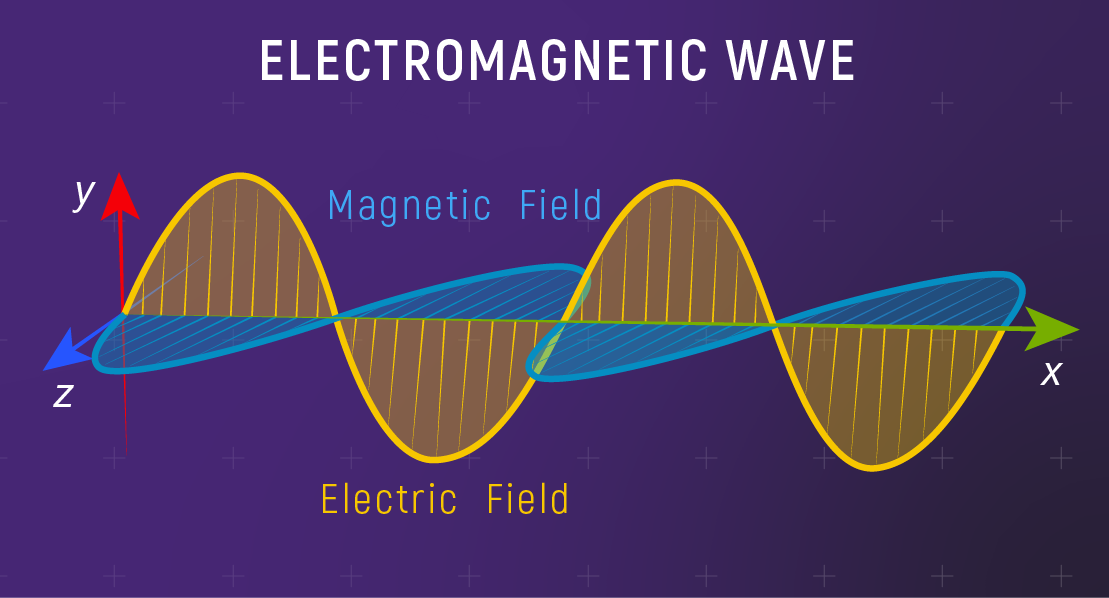
What to notice: light is an electromagnetic wave—electric and magnetic fields oscillate at right angles while the wave travels forward. (Credit: Illustration: NASA, ESA, CSA)
The Key Relationship
All electromagnetic waves — whether radio, visible light, or gamma rays — travel at exactly the same speed in vacuum:
For any electromagnetic wave:
\[ c = \lambda \nu \]
where:
- \(c = 3 \times 10^8\) m/s (speed of light)
- \(\lambda\) = wavelength (meters)
- \(\nu\) = frequency (hertz = cycles per second)
Since \(c\) is constant: longer wavelength \(\leftrightarrow\) lower frequency, shorter wavelength \(\leftrightarrow\) higher frequency.
What Does This Mean?
The equation \(c = \lambda \nu\) has a profound implication: since the speed of light is fixed, wavelength and frequency are inversely related. A wave with twice the wavelength has half the frequency. A wave with \(10\times\) the frequency has \(1/10\) the wavelength.
This means wavelength and frequency carry the same information — they’re two ways of describing the same property. Astronomers often switch between them depending on convenience. Radio astronomers tend to talk about frequency (MHz, GHz). Optical astronomers tend to talk about wavelength (nanometers).
Quick Calculation
Example: Visible red light has a wavelength of about 700 nm (nanometers). What’s its frequency?
First, convert: \(\lambda = 700 \text{ nm} = 700 \times 10^{-9} \text{ m} = 7 \times 10^{-7}\) m
Then: \(\nu = \frac{c}{\lambda} = \frac{3 \times 10^8 \text{ m/s}}{7 \times 10^{-7} \text{ m}} \approx 4.3 \times 10^{14}\) Hz
Red light oscillates about 430 trillion times per second!
If one type of light has twice the wavelength of another, it has:
- Twice the frequency
- Half the frequency
- The same frequency
- Four times the frequency
B) Half the frequency. Since \(c = \lambda \nu\) and \(c\) is constant, wavelength and frequency are inversely related. Double the wavelength means half the frequency.
The Electromagnetic Spectrum
More Than Meets the Eye
What we call “visible light” — the colors of the rainbow — is just a tiny sliver of the electromagnetic spectrum. There’s a vast range of wavelengths our eyes can’t see, from radio waves longer than buildings to gamma rays smaller than atoms. All of them are light. All of them are electromagnetic waves. All of them travel at speed \(c\). And all of them carry information.
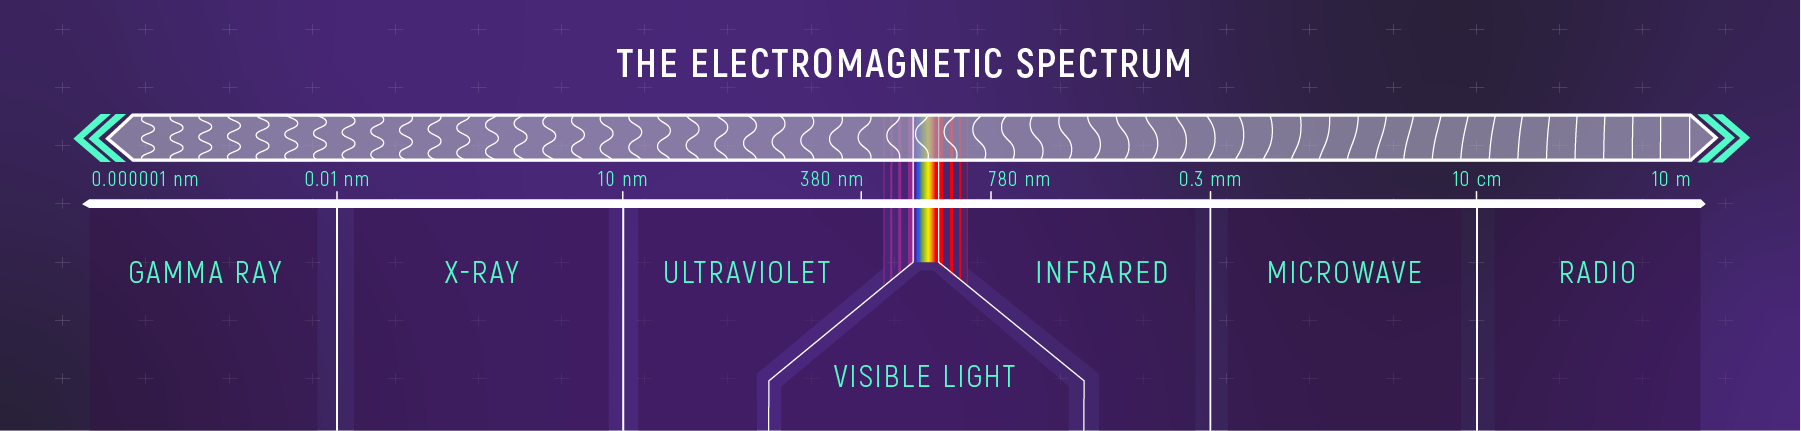
What to notice: visible light is a tiny slice of the electromagnetic spectrum, between ultraviolet and infrared. (Credit: Illustration: NASA, ESA, CSA)
The Full Spectrum
| Region | Wavelength Range (approx.) | Typical Sources | Astronomical Uses |
|---|---|---|---|
| Radio | > 10 cm | Radio transmitters, cold gas | Mapping hydrogen, pulsars |
| Microwave | 1 mm – 10 cm | Ovens, cosmic background | CMB, cold dust, molecules |
| Infrared | 700 nm – 1 mm | Warm objects, heat | Dust-obscured regions, cool stars |
| Visible | 400 – 700 nm | Hot objects (stars, bulbs) | Direct imaging, stellar classification |
| Ultraviolet | 10 – 400 nm | Very hot stars, active galaxies | Hot gas, stellar nurseries |
| X-ray | 0.01 – 10 nm | Extremely hot gas, accretion | Black holes, neutron stars |
| Gamma ray | < 0.01 nm | Nuclear reactions, explosions | Supernovae, gamma-ray bursts |
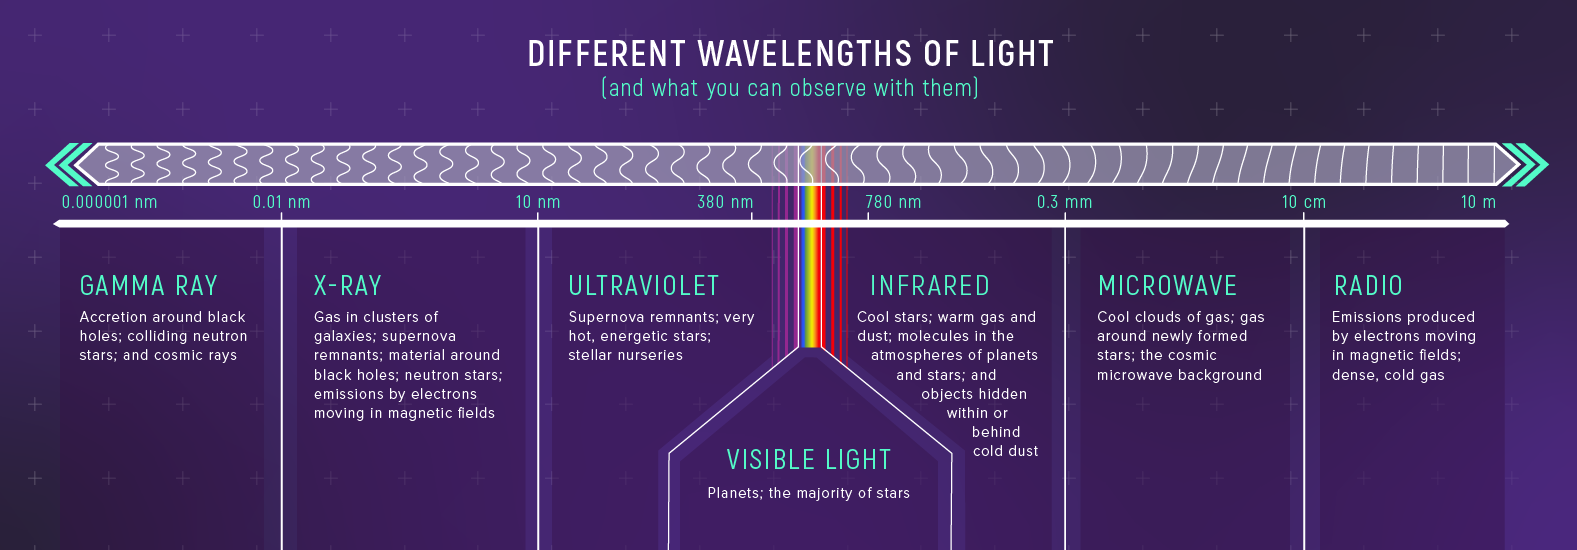
What to notice: the electromagnetic spectrum is much bigger than visible light; different wavelength bands reveal different kinds of astronomical objects and physics. (Credit: Illustration: NASA, ESA, CSA)
Mnemonic for visible light order: Red, Orange, Yellow, Green, Blue, Violet — “Roy G. Biv.” Red has the longest visible wavelength (~700 nm); violet has the shortest (~400 nm).
Why Multiple Wavelengths Matter
Different wavelengths reveal different phenomena. Radio waves penetrate dust that blocks visible light. X-rays reveal million-degree gas invisible to optical telescopes. Infrared shows warm dust and forming stars hidden behind clouds.
The universe looks different at every wavelength. To understand the cosmos fully, we need to observe across the spectrum — which is why astronomers build radio dishes, infrared satellites, X-ray telescopes, and more.
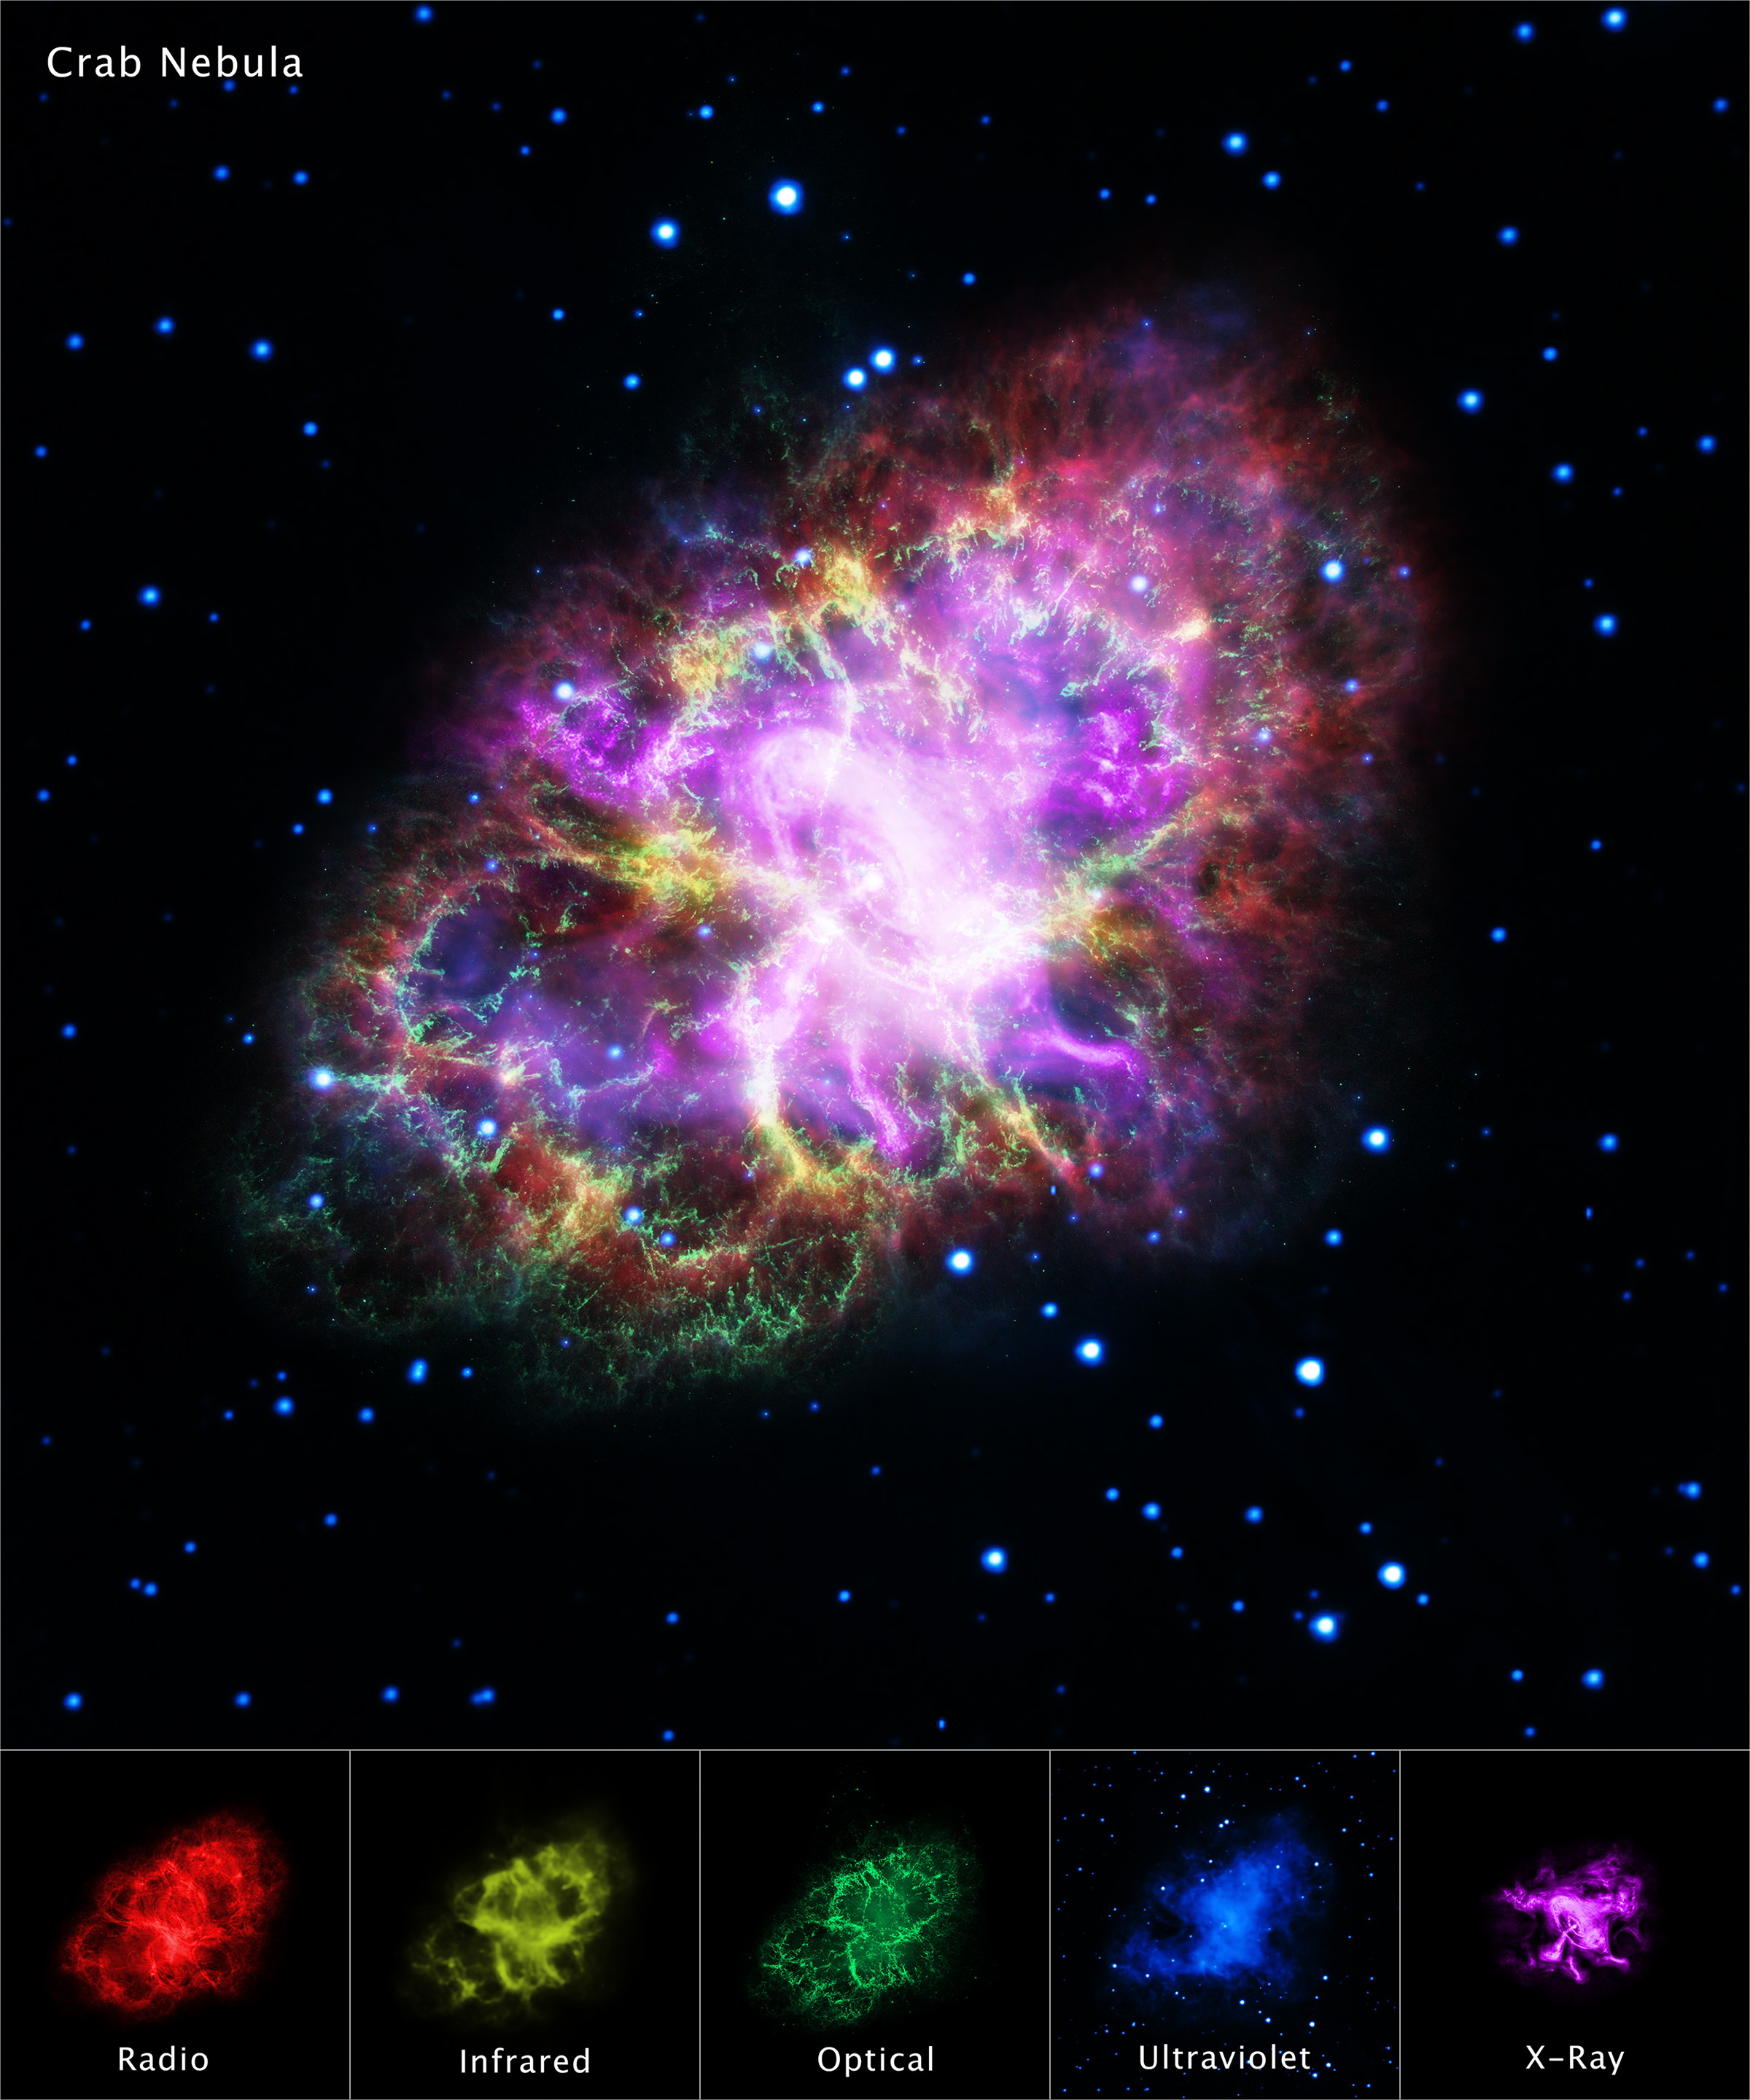
What to notice: The same object can look completely different at different wavelengths; each band highlights different physics. (Credit: NASA/CXC/SAO)
Earth’s atmosphere is transparent mainly in two broad windows: visible light and parts of radio. It absorbs most ultraviolet, X-rays, and gamma rays, and it absorbs a lot of infrared (though some IR gets through from high, dry sites).
This is why some astronomy must be done from space: the atmosphere blocks the very wavelengths that would carry that information to the ground. Space telescopes like JWST (infrared), Chandra (X-ray), and Fermi (gamma-ray) observe wavelengths that never reach Earth’s surface.
Open the EM Spectrum Interactive Demo to explore different wavelengths and see what each region reveals about the universe. Try clicking on different astronomical sources!
Which correctly orders these types of light from longest wavelength to shortest?
- Gamma rays -> X-rays -> UV -> Visible -> Infrared -> Radio
- Radio -> Infrared -> Visible -> UV -> X-rays -> Gamma rays
- Visible -> UV -> Infrared -> Radio -> X-rays -> Gamma rays
- Microwave -> Radio -> Visible -> Infrared -> Gamma rays
B) Radio -> Infrared -> Visible -> UV -> X-rays -> Gamma rays. Radio has the longest wavelengths (meters to kilometers), gamma rays the shortest (smaller than atoms). This order goes from low-energy, low-frequency light to high-energy, high-frequency light.
You’ll hear X-rays and gamma rays called “high-energy” light, while radio waves are “low-energy.” Why?
Photon energy increases with frequency: \(E = h\nu\) (where \(h\) is Planck’s constant). Since shorter wavelength means higher frequency, shorter-wavelength photons carry more energy per photon.
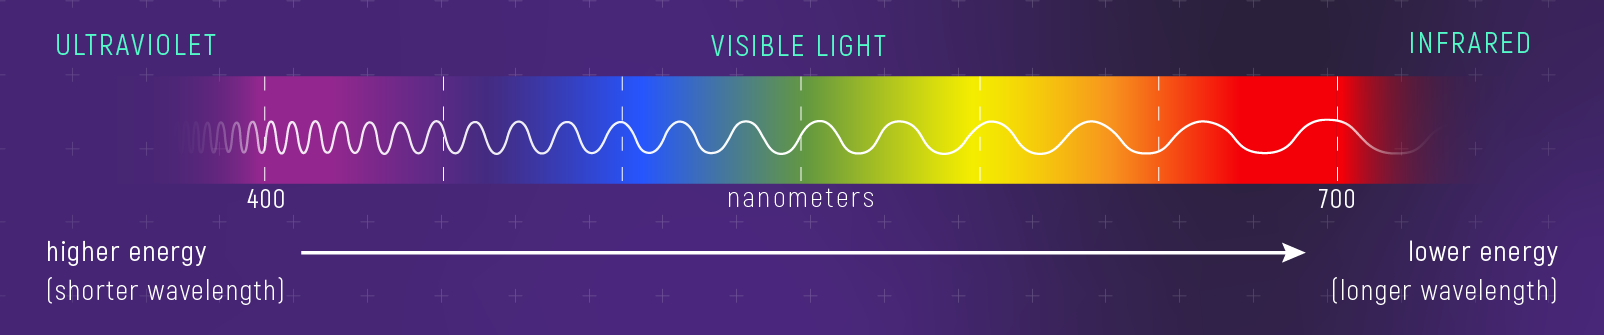
What to notice: shorter wavelength means higher photon energy; moving from red to violet increases energy. (Credit: Illustration: NASA, ESA, CSA)
A single gamma-ray photon can carry millions of times more energy than a radio photon — which is why gamma rays are dangerous and radio waves are harmless.
Why do astronomers observe the same object at different wavelengths?
- Different telescopes are in different locations
- Different wavelengths reveal different physical processes
- It’s cheaper to use old telescopes
- Visible light is too faint
B) Different wavelengths reveal different physical processes. Radio waves might show cold gas, infrared reveals dust, X-rays show hot plasma. A single wavelength gives an incomplete picture — combining observations across the spectrum reveals the full story.
The Speed of Light
A Cosmic Speed Limit
Light travels at \(c = 299,792,458\) m/s — approximately 300,000 km/s or 186,000 miles/s. This is the fastest speed possible for any information, energy, or matter. Nothing with mass can reach \(c\); only massless particles (like photons) travel at this speed.
Speed of light (c): The universal speed limit; approximately 300,000 km/s or \(3 \times 10^8\) m/s. All electromagnetic waves travel at this speed in vacuum.
Light-Travel Time
Because light has finite speed, when we look at distant objects, we see them as they were in the past:
| Object | Distance | Light-Travel Time |
|---|---|---|
| Moon | 384,000 km | 1.3 seconds |
| Sun | 150 million km | 8 minutes |
| Jupiter | 600 million km | ~30-50 minutes |
| Proxima Centauri | 4.2 light-years | 4.2 years |
| Andromeda Galaxy | 2.5 million light-years | 2.5 million years |
| Distant galaxies | Billions of light-years | Billions of years |
Looking out in space is looking back in time. The farther we see, the younger the universe appears. When we observe a galaxy whose light has been traveling for ~10 billion years (a “lookback time” of ~10 billion years), we see it as it was when the universe was only about 4 billion years old.
This has profound implications for cosmology. When astronomers observe the most distant galaxies, they’re studying the early universe directly. The Hubble and James Webb Space Telescopes have detected galaxies so distant that their light has been traveling for over 13 billion years — we see them as they were when the universe was less than a billion years old. These infant galaxies look completely different from modern galaxies, giving us a window into cosmic history. (In an expanding universe, “distance” can be defined in several ways; for now, light-travel time is the cleanest intuition, and we’ll refine this later in the course.)
Even within our own solar system, light-travel time matters. Signals between Earth and Mars take about 3 to 22 minutes one-way, depending on where the planets are in their orbits — so rovers can’t be “joysticked” in real time; they must make decisions autonomously. For spacecraft much farther out, the delay becomes dramatic: signals take ~22.5 hours one-way to reach Voyager 1 (now ~24 billion km away), and ~45 hours round trip for a reply!
A light-year is the distance light travels in one year:
\[ 1 \text{ light-year} = c \times (1 \text{ year}) \approx 9.5 \times 10^{12} \text{ km} \]
It’s a unit of distance, not time! When astronomers say a star is “10 light-years away,” they mean light from that star takes 10 years to reach us.
The first successful measurement of light’s speed came from astronomy! In 1676, Danish astronomer Ole Rømer noticed that Jupiter’s moons seemed to orbit faster when Earth was closer to Jupiter and slower when farther away. He realized this was because light took more time to reach Earth across the larger distance.
From his observations, Rømer calculated \(c \approx 220,000\) km/s — not bad for the 1670s! Modern measurements give exactly \(c = 299,792,458\) m/s, now used to define the meter.
When we observe the Andromeda Galaxy (2.5 million light-years away), we see it as it was:
- Right now, in real time
- 2.5 years ago
- 2.5 million years ago
- Billions of years ago
C) 2.5 million years ago. Light from Andromeda takes 2.5 million years to reach us. We’re seeing Andromeda as it existed 2.5 million years in the past. Looking at distant objects is literally looking back in time.
Part 2: Why Is the Sky Blue?
Deep Dive: Rayleigh Scattering
On a clear day, the sky is blue. At sunset, it turns orange and red. Why? And what does this have to do with astronomy?
You might assume:
- The sky has an inherent color (like paint)
- Sunlight is already colored when it enters the atmosphere
- Blue and red light behave identically when passing through air
Which of these is wrong? (Hint: all of them — but especially the last one.)
Sunlight Is All Colors
First, the setup: sunlight is white light — a mix of all visible wavelengths. When a prism spreads sunlight into a rainbow, it reveals the full spectrum: red, orange, yellow, green, blue, violet.
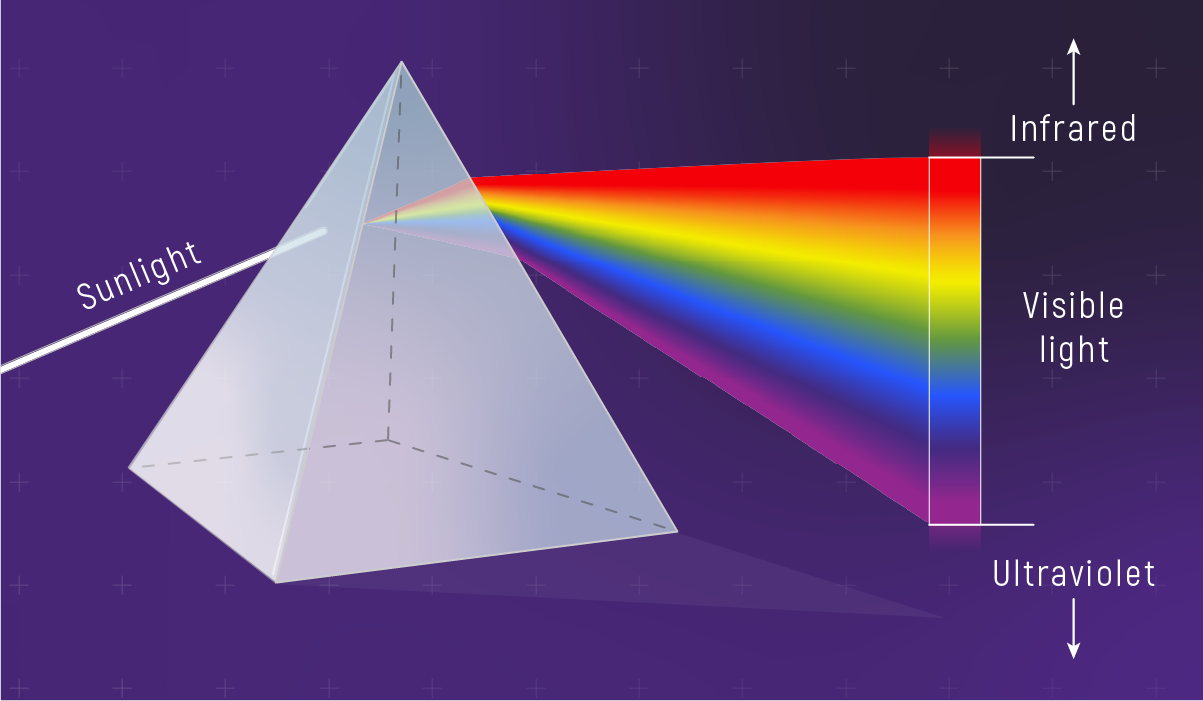
What to notice: white light contains many wavelengths; a prism separates them into a spectrum from ultraviolet through visible into infrared. (Credit: Illustration: NASA, ESA, CSA)
The key question: if sunlight contains all colors equally, why does the sky favor blue?
The Key Physics: Wavelength-Dependent Scattering
When light encounters particles much smaller than its wavelength — like the nitrogen and oxygen molecules that make up most of our atmosphere — something interesting happens: the light gets scattered (redirected in random directions). But not all wavelengths scatter equally.
When light interacts with particles much smaller than its wavelength (like air molecules), the amount of scattering depends on wavelength:
\[ \text{Scattering} \propto \frac{1}{\lambda^4} \]
Shorter wavelengths scatter MUCH more than longer wavelengths.
Rayleigh scattering: Scattering of light by particles much smaller than the wavelength. The scattering strength goes as \(1/\lambda^4\), meaning short wavelengths scatter much more.
What Does This Mean?
Let’s compare blue light (\(\lambda \approx 450\) nm) and red light (\(\lambda \approx 700\) nm):
\[ \frac{\text{Blue scattering}}{\text{Red scattering}} = \left(\frac{700}{450}\right)^4 \approx \left(1.56\right)^4 \approx 5.9 \]
Blue light scatters about 6 times more than red light! This is why the sky is blue — blue photons get scattered all over the sky, reaching your eyes from every direction. Meanwhile, red photons mostly travel straight through without scattering.
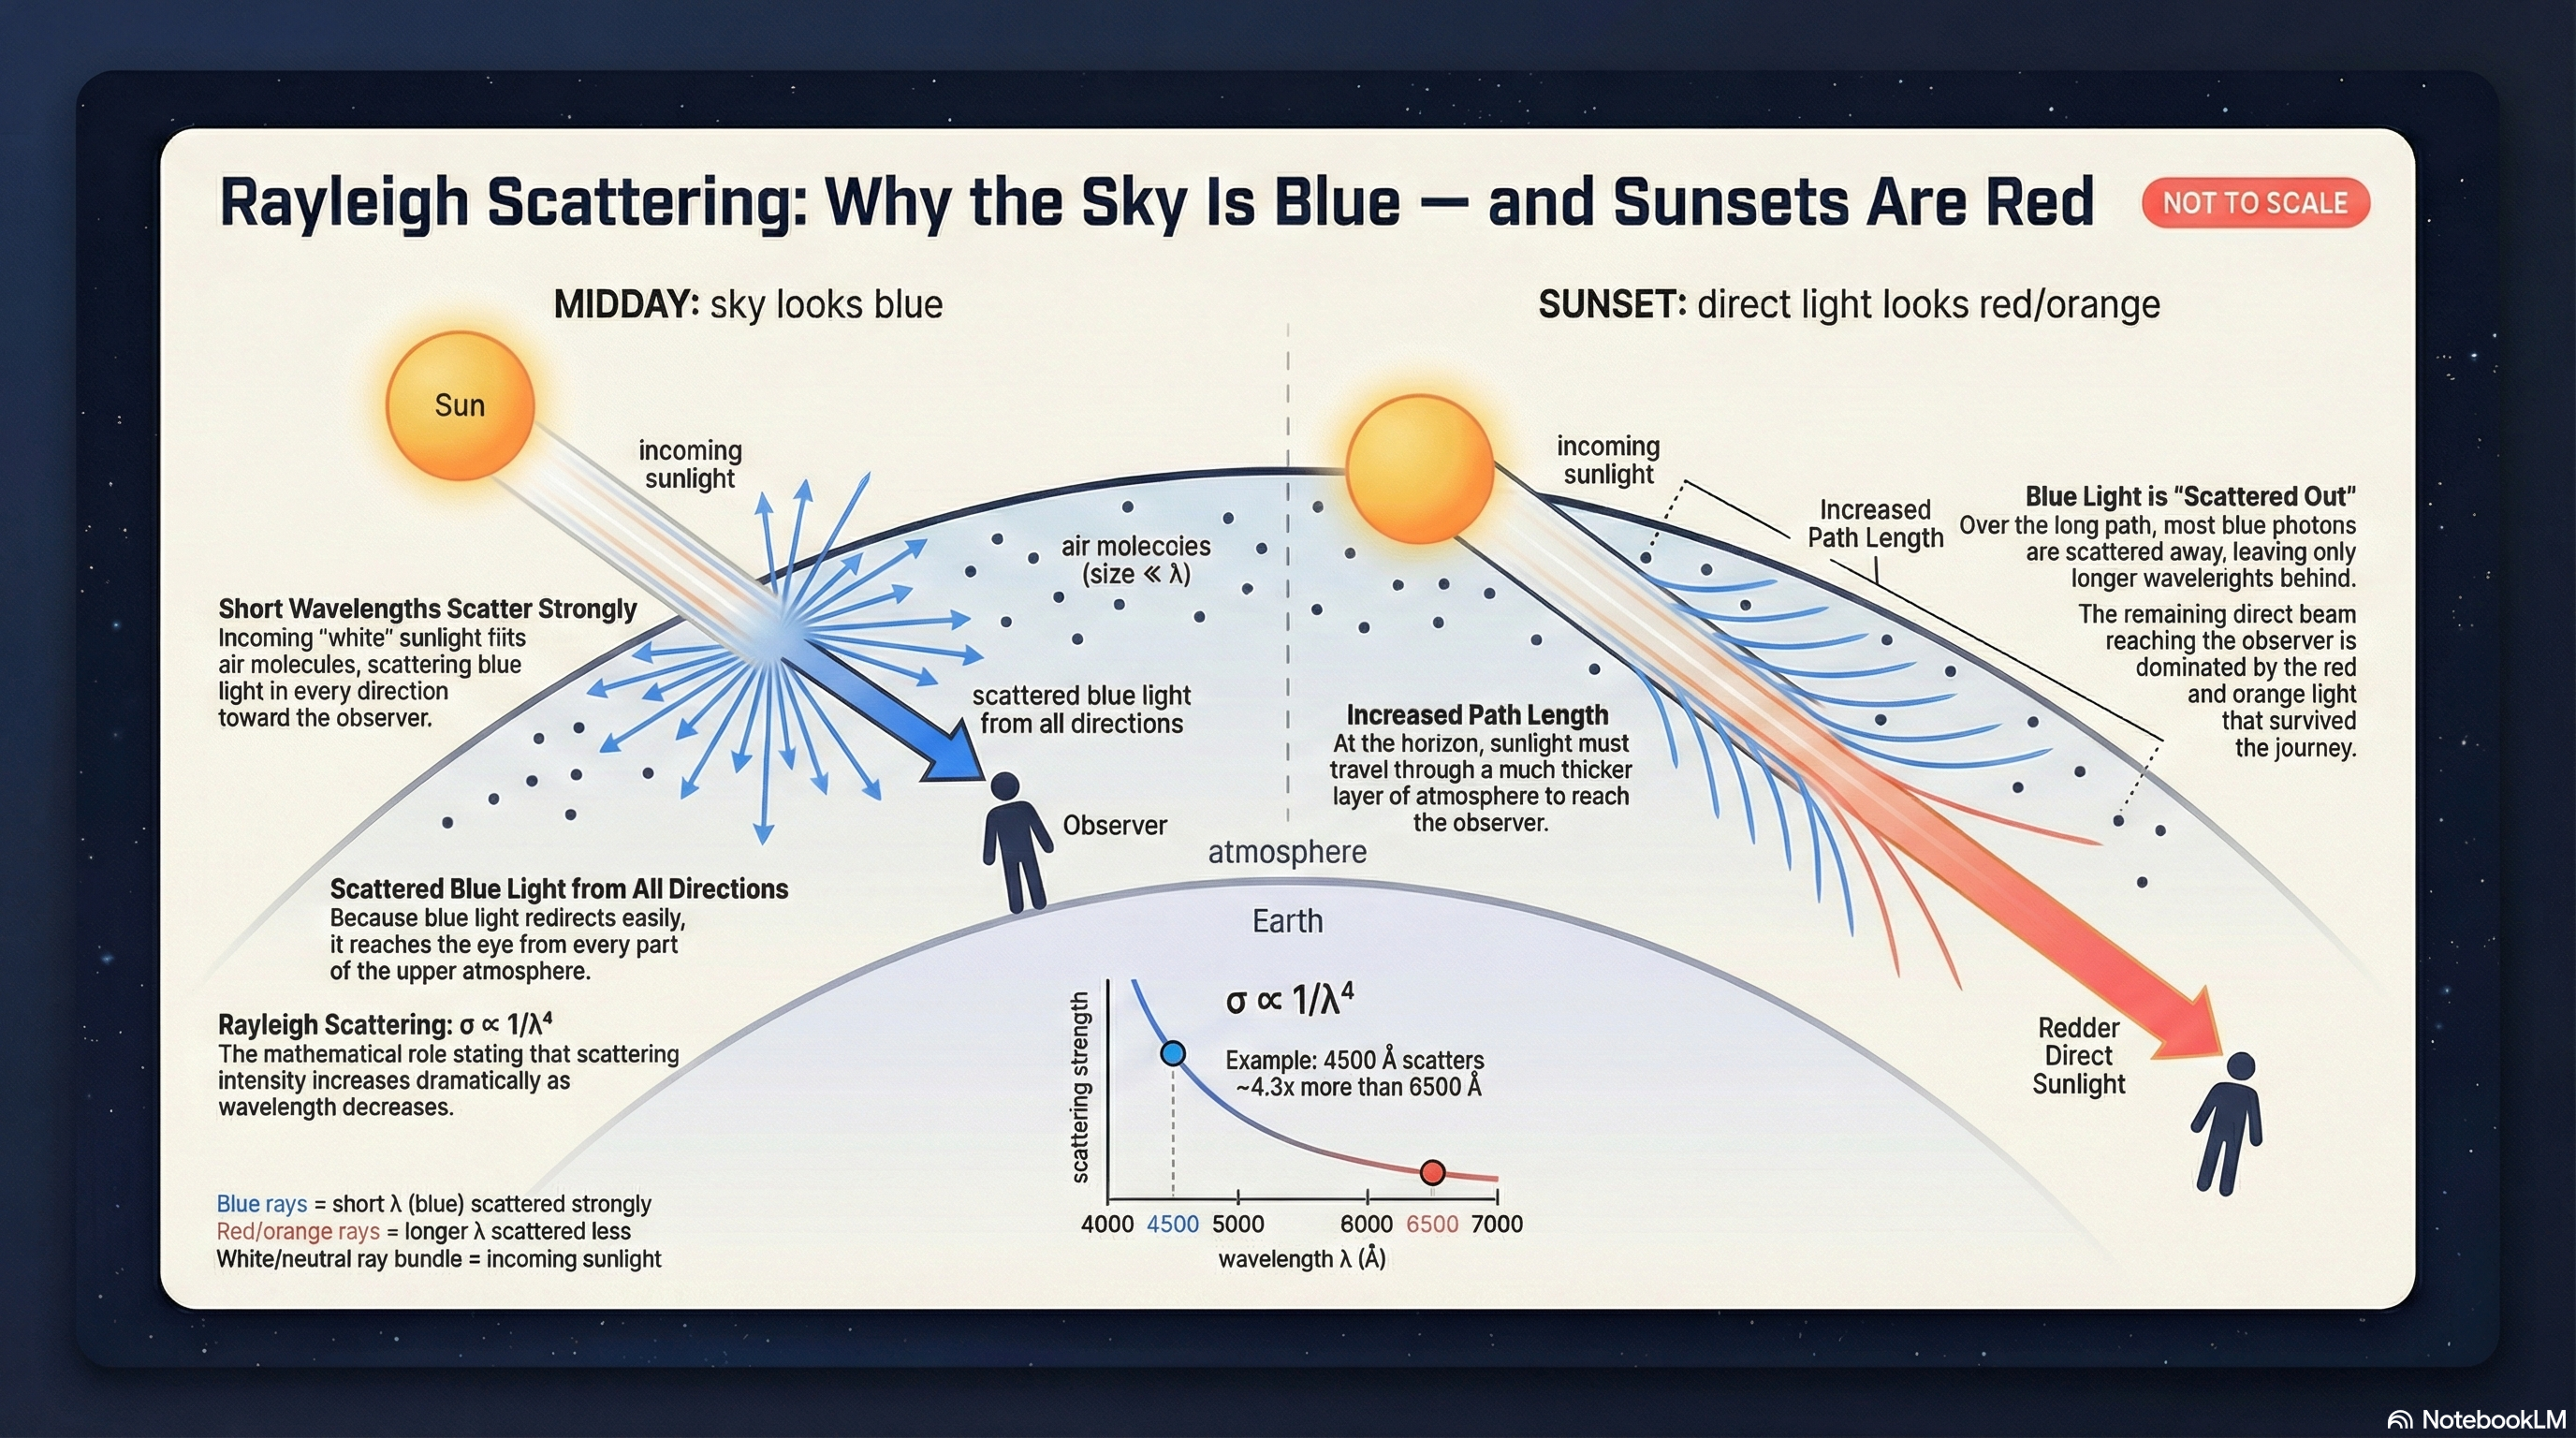
What to notice: short-wavelength (blue) light scatters much more than long-wavelength (red) light, so scattered blue light dominates the daytime sky. (Credit: (A. Rosen/NotebookLM))
Violet light does scatter even more than blue (it has shorter wavelength). But the sky doesn’t look violet because:
- The Sun emits less violet than blue or green.
- Some of the shortest-wavelength light is absorbed in the upper atmosphere.
- Human eyes are less sensitive to violet than to blue/green.
The result is a sky that looks blue to us, not violet.
Why Sunsets Are Red and Orange
At sunset, sunlight travels through much more atmosphere to reach your eyes. The blue light has been scattered away so many times that very little remains — you see what’s left: the reds and oranges that weren’t scattered.
The same physics, different geometry: at noon, you’re looking at scattered blue from a short path through the atmosphere. At sunset, the direct sunlight has lost most of its blue.
What to notice: at sunset, sunlight travels through much more atmosphere; blue light scatters out along the long path, leaving redder light to reach you. (Credit: (A. Rosen/NotebookLM))
Blue light scatters more than red light because:
- Blue light is faster than red light
- Shorter wavelengths scatter more in Rayleigh scattering (\(\propto 1/\lambda^4\))
- Air molecules are blue
- The Sun emits more blue light
B) Shorter wavelengths scatter more. Rayleigh scattering goes as \(1/\lambda^4\) — the fourth power makes a huge difference. Blue light (shorter wavelength) scatters about \(6\times\) more than red light (longer wavelength).
Sunsets appear red because:
- The Sun turns red as it sets
- The atmosphere filters out red light, leaving blue
- Blue light has been scattered away on the long path through atmosphere
- Dust particles block the blue
C) Blue light has been scattered away. At sunset, sunlight travels through much more atmosphere. After all that scattering, the blue is gone — redirected in other directions. What remains is the less-scattered red and orange, giving sunsets their characteristic colors.
Note: dust and aerosols can enhance reds and oranges, but the baseline reason sunsets redden is the long path through the atmosphere plus wavelength-dependent scattering.
Deep Dive: Why Are Lunar Eclipses Red?
The Blood Moon Puzzle
During a total lunar eclipse, the Moon doesn’t go dark — it turns a deep red, sometimes called a “blood moon.” Why?
During a total lunar eclipse, the Moon is in Earth’s shadow. So why doesn’t it go completely dark?
Hint: Apply what you just learned about Rayleigh scattering…
The Answer: Earth’s Atmosphere as a Lens and Filter
Here’s what happens during a total lunar eclipse:
- The Moon enters Earth’s shadow — no direct sunlight reaches it
- But sunlight passing through Earth’s atmosphere bends toward the Moon
- As it passes through the atmosphere, blue light scatters away (Rayleigh!)
- Only the red light makes it through and reaches the Moon
- The Moon reflects this reddish light back to us
It’s the same physics as a sunset, but projected onto the Moon!
Earth’s atmosphere acts like a lens, bending sunlight around our planet. But it’s also a filter: the same Rayleigh scattering that makes skies blue removes blue light from the transmitted beam. What reaches the Moon is essentially the light from every sunset and sunrise on Earth, all focused together.
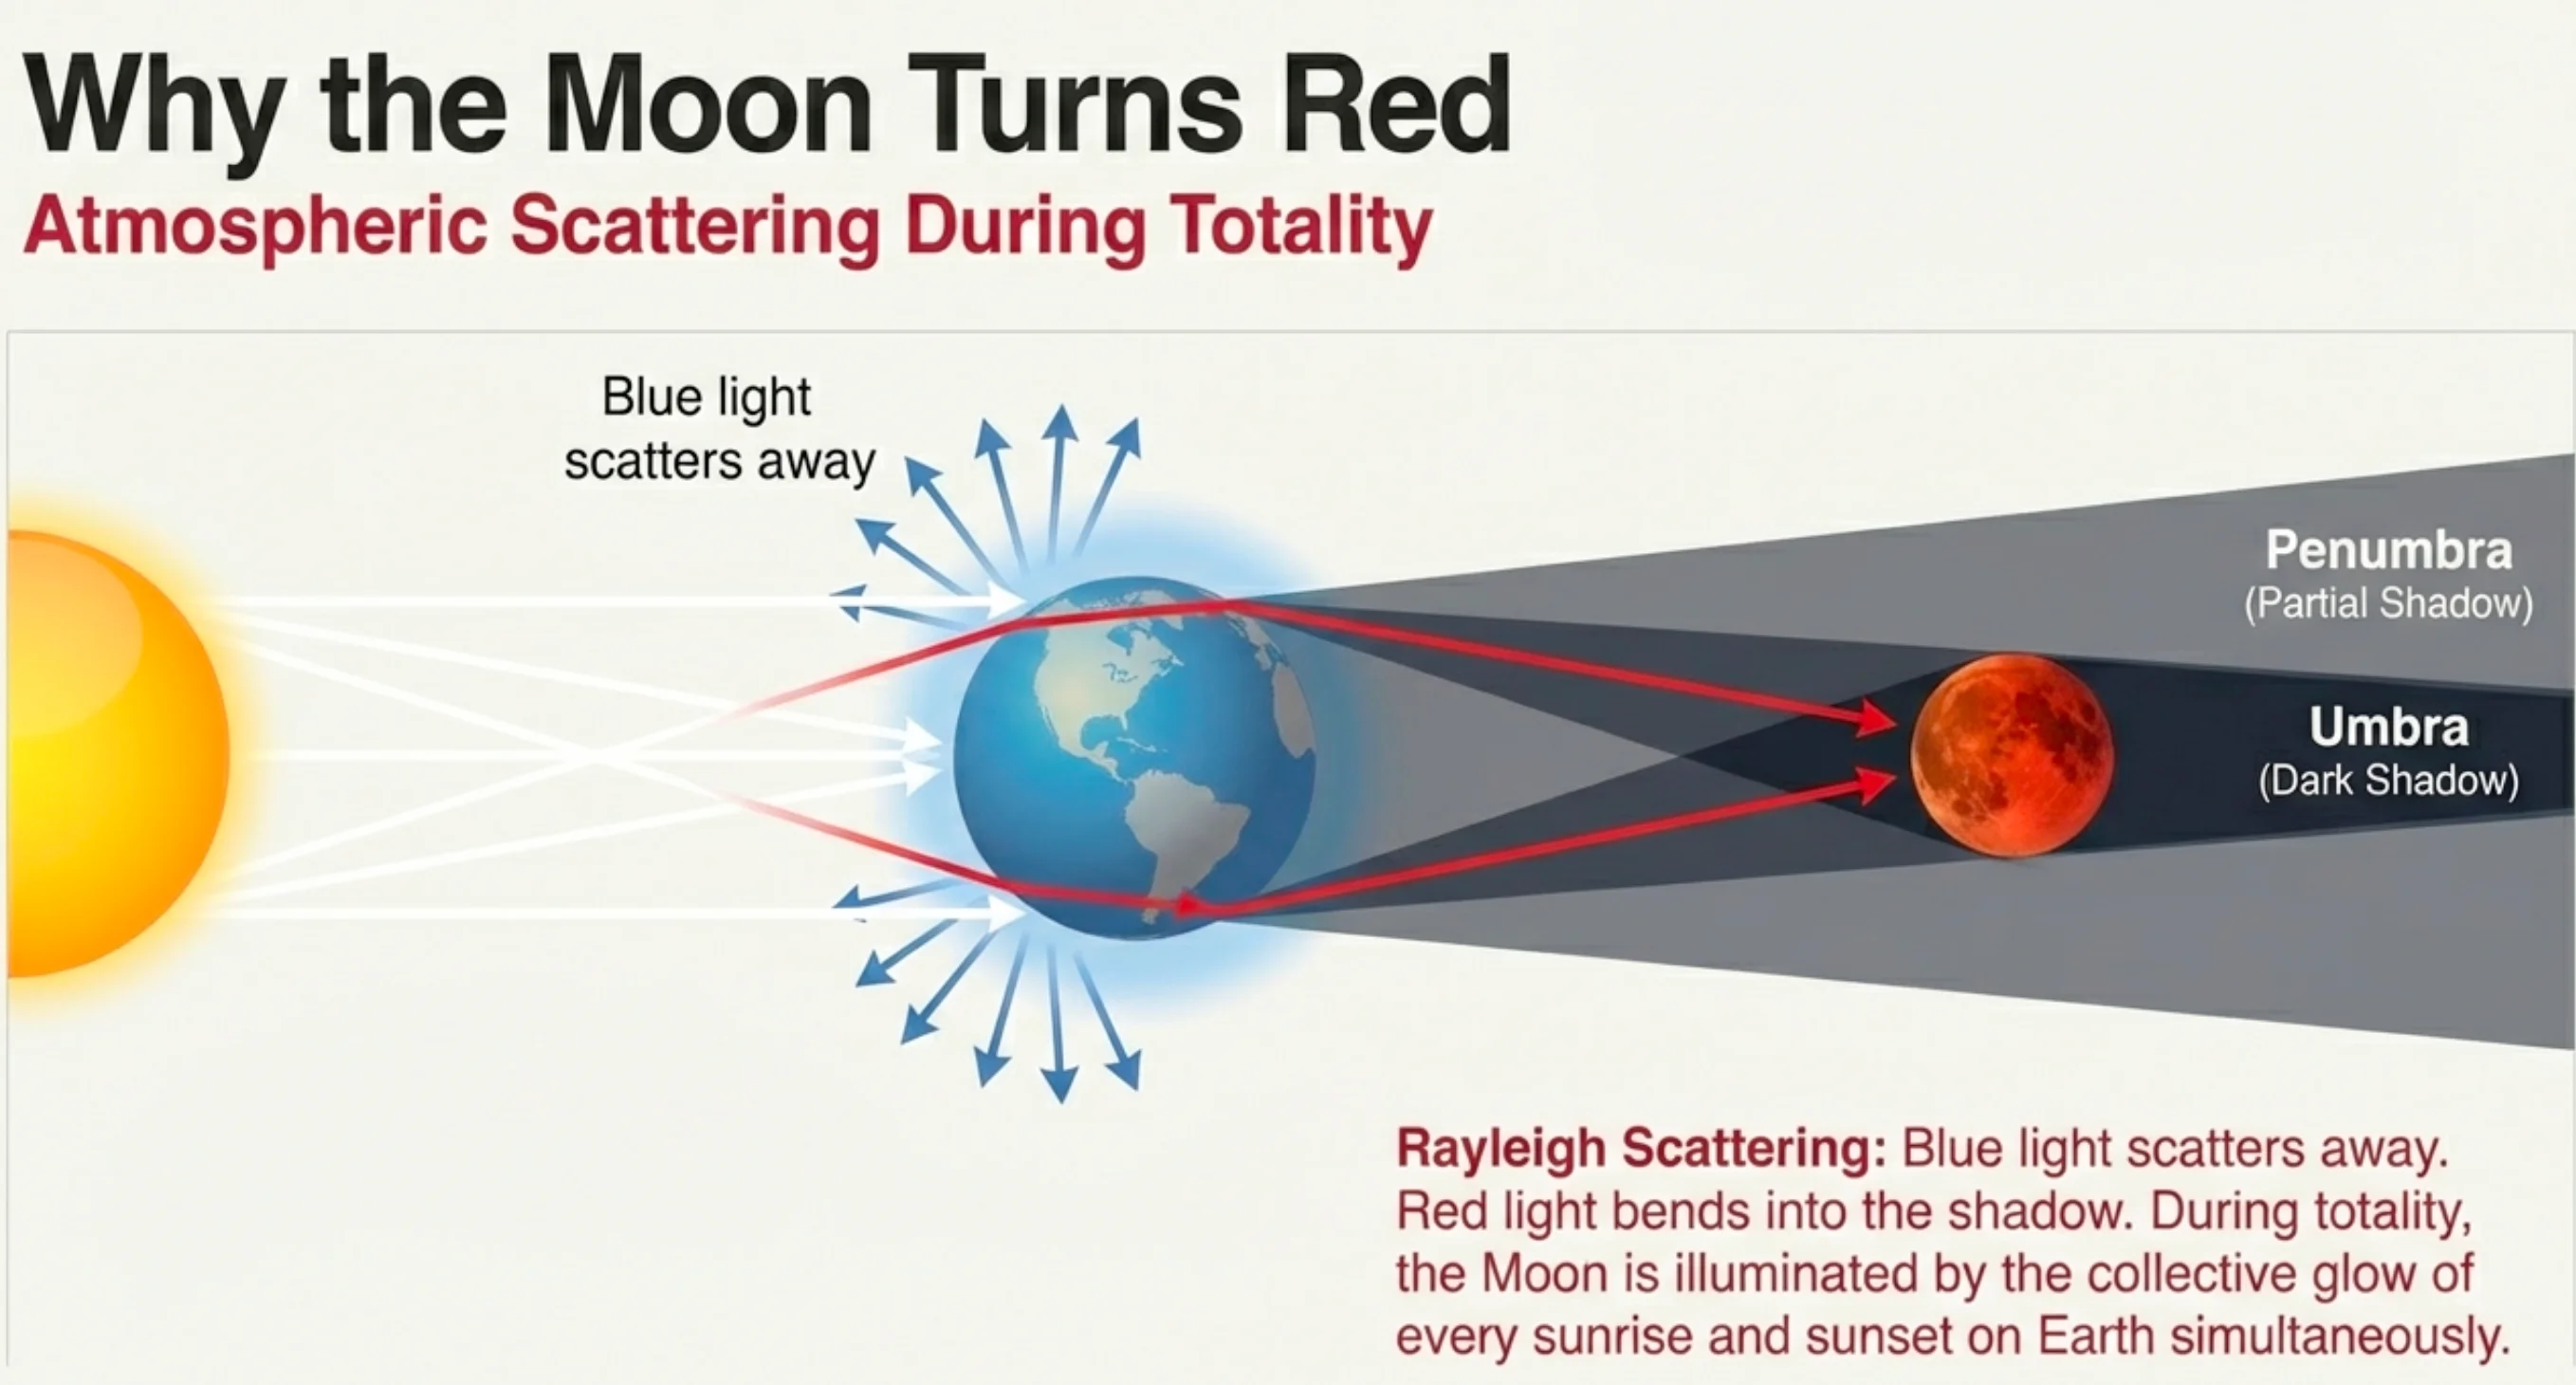
What to notice: during a total lunar eclipse, sunlight filtered through Earth’s atmosphere illuminates the Moon, often giving it a reddish color. (Credit: (A. Rosen/NotebookLM))
The Cosmic Connection
This isn’t just pretty — it’s useful! The same principle applies to exoplanet atmospheres. When a planet transits (passes in front of) its host star, some starlight filters through the planet’s atmosphere. By measuring which wavelengths are absorbed or scattered, astronomers can detect what gases are present.
Observable: During a total lunar eclipse, the Moon turns red instead of going completely dark. (Brightness + Wavelength observation)
Model: Earth’s atmosphere bends sunlight around the planet. Rayleigh scattering removes blue light; red light passes through.
Inference: The Moon is illuminated by “filtered sunset light” from all around Earth’s rim. This same physics lets us study exoplanet atmospheres.
Astronomers can detect gases in some exoplanet atmospheres by the same basic physics you just used for lunar eclipses: light filters through a planet’s atmosphere, and different wavelengths are absorbed or scattered by different molecules.
This is how we might someday detect signs of life on distant worlds: by looking for atmospheric signatures (like oxygen and methane together) that could be suggestive — but only with the right planetary context, and only after ruling out non-biological “false positive” explanations.
During a total lunar eclipse, the Moon appears red because:
- The Moon reflects Mars’s light
- Earth’s atmosphere scatters blue away, letting red sunlight reach the Moon
- The Moon’s surface is actually red
- The Sun becomes cooler during eclipses
B) Earth’s atmosphere scatters blue away. Sunlight passing through Earth’s atmosphere has its blue light scattered out (Rayleigh scattering), leaving red. This reddened light bends around Earth and illuminates the Moon — like projecting every sunset on Earth onto the lunar surface.
After a major volcanic eruption (which puts extra particles in the atmosphere), lunar eclipses tend to appear darker and redder. Why?
- Volcanoes emit red light
- Extra particles scatter away even more blue light, leaving only deep red
- Volcanic ash blocks all light
- The Moon moves closer during volcanic activity
B) Extra particles scatter away even more blue light. Volcanic aerosols and dust scatter and absorb more light overall, so less total sunlight reaches the Moon through Earth’s atmosphere. That can make eclipses darker, and often shifts the transmitted light toward deeper reds. The 1991 eruption of Mount Pinatubo led to notably dark lunar eclipses for about two years afterward.
Part 3: Light Intensity and Distance
The Inverse-Square Law for Light
Another Inverse-Square Law!
In Lecture 6, we learned that gravity follows an inverse-square law: \(F \propto 1/r^2\). It turns out light intensity does too — for the same fundamental reason.
The intensity (brightness) of light from a source decreases with distance squared:
\[ I \propto \frac{1}{r^2} \]
Double your distance from a light source \(\to\) receive \(1/4\) the intensity.
Luminosity: The total power emitted by a source. Measured in watts (W). An intrinsic property — doesn’t depend on distance.
Intensity (flux): The power of light received per unit area. Measured in \(\mathrm{W/m^2}\). This does depend on distance — farther = fainter.
Why?
The explanation is geometric: light spreads out in all directions from a source. At distance \(r\), the light is spread over a sphere of surface area \(4\pi r^2\). The same total light spread over a larger area means less light per unit area.
This is exactly the same “spreading over a sphere” argument we used for gravity in Lecture 6! Both gravity and light “dilute” as they spread over ever-larger spheres.
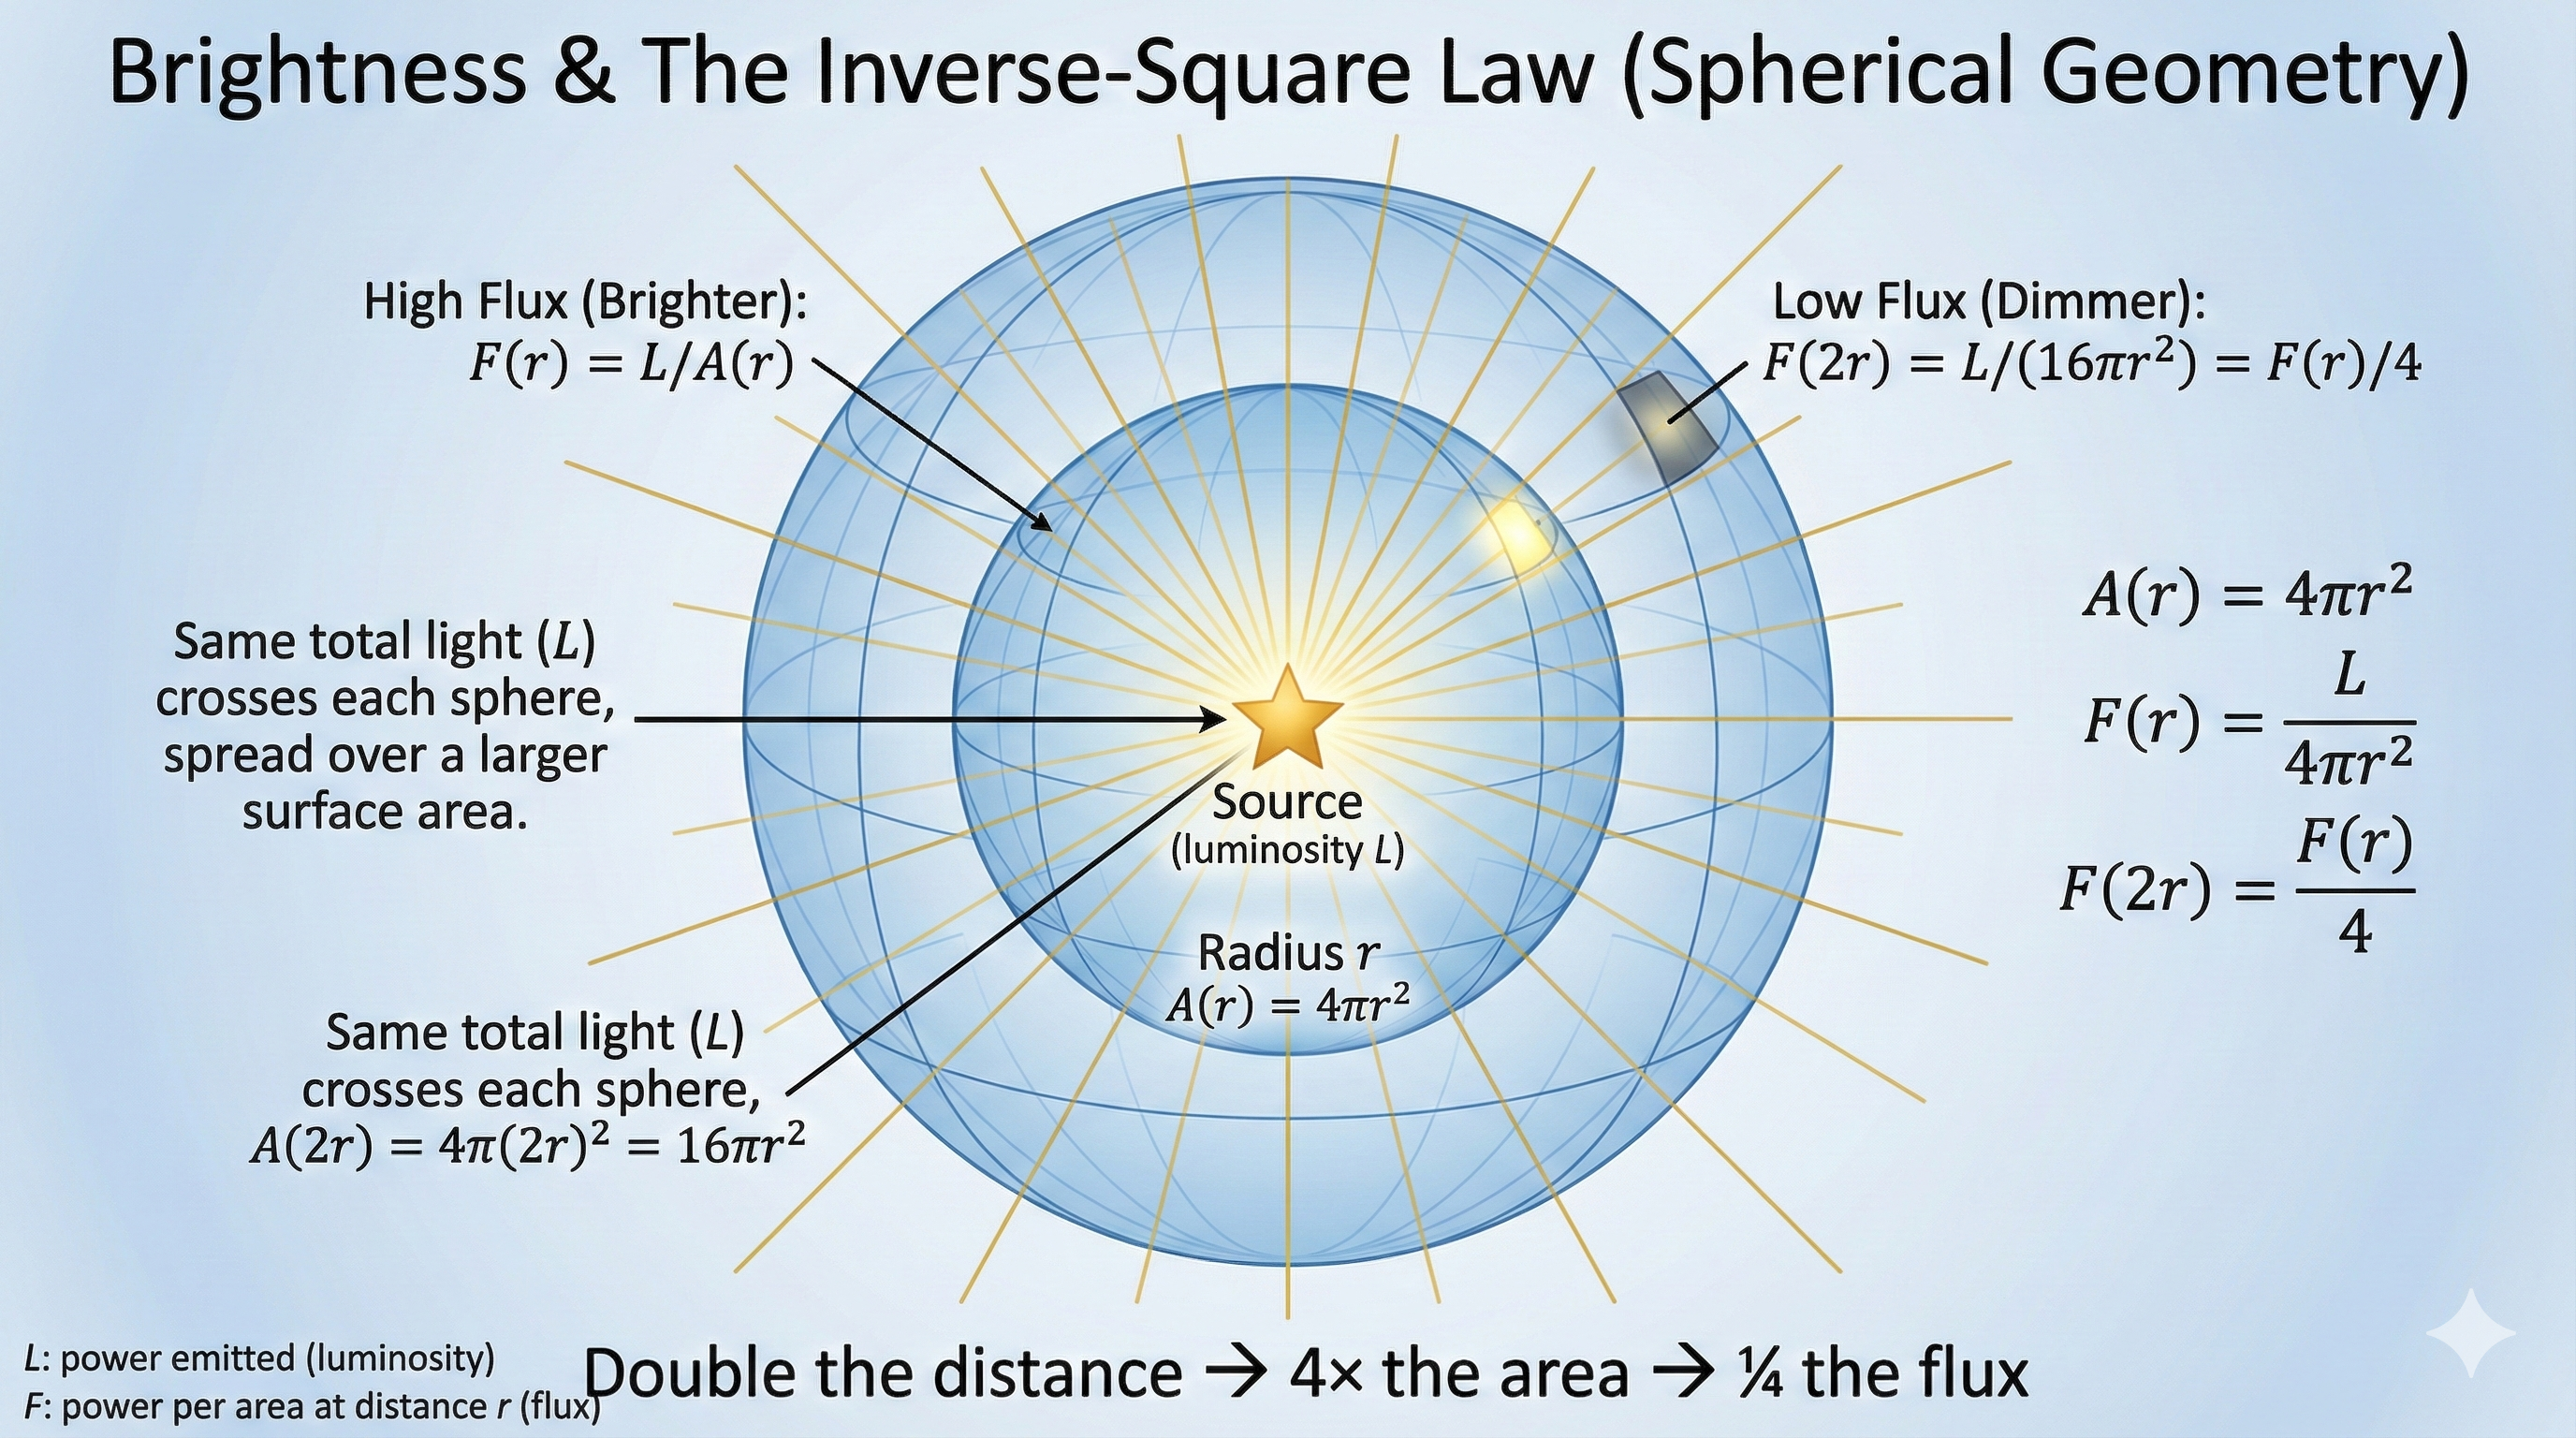
What to notice: as distance increases, the same light spreads over a larger area, so intensity drops as 1/r². (Credit: (A. Rosen/Gemini))
| Distance Change | Intensity Change |
|---|---|
| \(2\times\) farther | \(1/4\) as bright |
| \(3\times\) farther | \(1/9\) as bright |
| \(10\times\) farther | \(1/100\) as bright |
| \(100\times\) farther | \(1/10{,}000\) as bright |
Astronomical Implications
The inverse-square law is why distant stars appear dim even if they’re intrinsically very luminous. A star with the same luminosity as the Sun but 10 times farther away appears 100 times fainter.
This also means that if we know a star’s true luminosity (its intrinsic power output) and measure its apparent brightness, we can calculate its distance. We’ll return to this idea when we discuss “standard candles” and the cosmic distance ladder.
Observable: Star A appears \(100\times\) fainter than Star B, but we know they have the same intrinsic luminosity. (Brightness observation)
Model: Light intensity follows the inverse-square law: \(I \propto 1/r^2\).
Inference: Star A is \(10\times\) farther away than Star B. This is the foundation of distance measurement in astronomy.
A star appears 16 times fainter than an identical star nearby. How much farther away is the faint star?
- \(4\times\) farther
- \(16\times\) farther
- \(8\times\) farther
- \(2\times\) farther
A) \(4\times\) farther. By the inverse-square law, intensity \(\propto 1/r^2\). If intensity is \(1/16\), then \(1/r^2 = 1/16\), so \(r^2 = 16\) and \(r = 4\). The faint star is 4 times more distant.
Star A is \(5\times\) farther away than Star B. If they have the same intrinsic luminosity, Star A appears:
- \(5\times\) fainter
- \(10\times\) fainter
- \(25\times\) fainter
- \(125\times\) fainter
C) \(25\times\) fainter. By the inverse-square law, intensity \(\propto 1/r^2\). If distance increases by factor 5, intensity decreases by factor \(5^2 = 25\). This is why even intrinsically luminous stars can appear faint if they’re far enough away — and why distance is so important in astronomy.
🔭 Demo Exploration: The Electromagnetic Spectrum
Open the EM Spectrum Interactive Demo: ../../../demos/em-spectrum/
This demo lets you explore the electromagnetic spectrum and see what different wavelengths reveal about astronomical objects.
Demo Mission 1: The Visible Window
Predict before you explore: What fraction of the full electromagnetic spectrum does visible light represent — roughly half, a tenth, or much less?
Write your prediction here before continuing: _______________
Do this:
- Open the demo and look at the wavelength scale
- Find visible light (roughly 400-700 nm)
- Compare this range to the full spectrum (radio to gamma rays)
Visible light is a tiny sliver of the full spectrum. It spans only a factor of ~2 in wavelength (400–700 nm), while the electromagnetic spectrum spans ~15 orders of magnitude — from about \(10^{-12}\) m (gamma rays) up to \(10^{3}\) m (radio waves). Our eyes see only a narrow window in the middle.
Claim: Visible light is an extremely small part of the electromagnetic spectrum.
Evidence: The demo shows wavelengths ranging from \(10^{-12}\) m (gamma rays) to \(10^{3}\) m (radio). Visible light (400–700 nm = \(4\)–\(7 \times 10^{-7}\) m) is a tiny band in the middle of this enormous range.
Demo Mission 2: Different Wavelengths, Different Universe
Predict before you explore: If you looked at a dusty star-forming region in visible light vs. infrared, which would reveal more stars?
Write your prediction here: _______________
Do this:
- Find a dusty object in the demo (like a nebula or star-forming region)
- Toggle between visible and infrared views
- Note what each wavelength reveals
Infrared reveals more stars. Dust blocks visible light but is transparent to infrared. Stars hidden behind dust clouds become visible in infrared observations.
Claim: Different wavelengths reveal different phenomena. Multiwavelength astronomy gives a complete picture.
Evidence: The demo shows how dust-obscured regions appear dark in visible light but bright in infrared, revealing hidden stars and structure.
Demo Mission 3: High-Energy Universe
Predict before you explore: X-rays reveal extremely hot gas (millions of degrees). Where might you expect to find such hot material in the universe?
Write your prediction here: _______________
Do this:
- Find X-ray sources in the demo
- Note what types of objects emit X-rays
- Compare to what the same objects look like in visible light
X-ray sources include:
- Black holes — material spiraling into black holes heats to millions of degrees
- Neutron stars — incredibly dense stellar remnants with extreme surface temperatures
- Galaxy clusters — filled with hot intergalactic gas
- Supernova remnants — shock-heated gas from stellar explosions
These are among the most violent and energetic environments in the universe. X-ray telescopes like Chandra reveal physics invisible to optical telescopes.
Claim: Different wavelengths probe different physical regimes — from cold gas (radio) to the most extreme temperatures (X-rays).
Evidence: The demo shows that X-ray sources are associated with the most energetic phenomena: accretion onto compact objects, shock-heated gas, and extreme gravitational environments.
Light as Information — The Throughline
What We’ve Learned
Let’s step back and see the big picture:
- Light is an electromagnetic wave with wavelength and frequency related by \(c = \lambda \nu\)
- The EM spectrum spans radio to gamma rays — each region reveals different physics
- Wavelength affects how light interacts with matter — scattering depends on \(1/\lambda^4\)
- Light intensity follows the inverse-square law — distance affects brightness predictably
But we haven’t yet answered the most important question: How do we read temperature from light?
Preview of Lecture 8
Everything with temperature glows. Not just stars — everything. Your body emits infrared light. A stovetop burner glows red, then orange as it heats up. The Sun glows yellow-white at 5,500 K.
The key insight: hotter objects emit shorter-wavelength light. There’s a precise relationship between temperature and the peak wavelength of emission. That’s what Lecture 8 is about.
Lecture 7 (today): Light carries information — wavelength matters because different wavelengths interact differently with matter.
Lecture 8 (next): Temperature writes its signature in wavelength. By measuring the spectrum of emitted light, we can read an object’s temperature — even from billions of kilometers away.
Together: Motion reveals mass (L5-L6). Light reveals temperature (L7-L8). Spectral lines reveal composition and motion (L9).
Light is an electromagnetic wave. Wavelength (\(\lambda\)) and frequency (\(\nu\)) are related by \(c = \lambda \nu\), where \(c = 3 \times 10^8\) m/s.
The EM spectrum spans radio to gamma rays. Visible light is a tiny sliver. Different wavelengths reveal different physics — astronomers observe across the spectrum.
Rayleigh scattering: Small particles scatter short wavelengths more (\(\propto 1/\lambda^4\)). This is why the sky is blue and sunsets are red.
Lunar eclipses are red because Earth’s atmosphere scatters away blue light, leaving only red to reach the Moon — same physics as sunsets.
Light intensity follows the inverse-square law: \(I \propto 1/r^2\). Double the distance \(\to\) \(1/4\) the brightness.
Light is the astronomer’s primary tool. We extract temperature, composition, motion, and distance from light — without ever leaving Earth.
Practice Problems
Solutions are available in the Lecture 7 Solutions.
Core (do these first)
1. Wave equation: Green light has a wavelength of about 550 nm. Calculate its frequency. (Remember: \(c = 3 \times 10^8\) m/s, and 1 nm = \(10^{-9}\) m)
2. Spectrum ordering: Rank these from longest to shortest wavelength: X-rays, visible light, radio waves, infrared, ultraviolet.
3. Rayleigh scattering: Why is the sky blue at noon but red/orange at sunset? Explain using Rayleigh scattering.
4. Inverse-square law: A star is observed to be 25 times fainter than an identical star nearby. How many times farther away is it?
5. Light travel time: The star Vega is about 25 light-years away. When you look at Vega tonight, how long ago did that light leave the star?
Challenge
6. Scattering ratio: Calculate how many times more a 400 nm (violet) photon scatters compared to a 600 nm (orange) photon, using the Rayleigh scattering law (\(\propto 1/\lambda^4\)).
7. Lunar eclipse colors: During some lunar eclipses, the Moon appears darker red than others. Suggest what factor might affect how red the Moon appears. (Hint: think about what else might be in Earth’s atmosphere.)
8. Distance from brightness: A supernova in a distant galaxy appears 10,000 times fainter than an identical supernova in a nearby galaxy. If the nearby supernova is 10 Mpc away, how far is the distant galaxy?
9. Conceptual: Mars appears red from Earth. Is this because of Rayleigh scattering in Mars’s atmosphere, or something else? Explain.
10. Connection to L8: If hotter objects emit shorter-wavelength light (preview of L8), predict: would a red star or a blue star have the higher surface temperature?
Glossary
| Term | Definition |
|---|---|
| Electromagnetic wave | Self-propagating oscillation of electric and magnetic fields; light is an EM wave |
| Wavelength (\(\lambda\)) | Distance between consecutive wave crests |
| Frequency (\(\nu\)) | Number of wave crests passing a point per second (Hz) |
| Speed of light (\(c\)) | The speed of electromagnetic waves in vacuum: \(3 \times 10^8\) m/s |
| Electromagnetic spectrum | The full range of EM wavelengths, from radio to gamma rays |
| Rayleigh scattering | Scattering of light by particles smaller than the wavelength; scattering \(\propto 1/\lambda^4\) |
| Light-year | The distance light travels in one year; ~9.5 trillion km |
| Inverse-square law | Intensity decreases with distance squared: \(I \propto 1/r^2\). Same form as gravity (see L6). |
| Intensity (flux) | Power received per unit area; apparent brightness |
| Photon | A particle of light; the quantum of electromagnetic radiation |
- ◇ Atmospheric window
- A range of wavelengths that can pass through Earth's atmosphere without being absorbed. Visible and radio windows allow ground-based astronomy; other wavelengths require space telescopes.
- ★ Electromagnetic spectrum
- The full range of electromagnetic radiation, from radio waves (long wavelength) to gamma rays (short wavelength). Visible light is a tiny slice; most of the spectrum is invisible to human eyes.
- ◇ Gamma rays
- The highest-energy electromagnetic radiation, with wavelengths < 0.01 nm. Produced in extreme events: supernovae, pulsars, active galactic nuclei.
- ◇ Infrared (IR)
- Electromagnetic radiation between radio and visible, with wavelengths ~1 μm to 1 mm. Reveals warm dust and can penetrate through gas clouds that block visible light.
- ◇ Radio waves
- Electromagnetic radiation with the longest wavelengths (> 1 mm), used to study cold gas and cosmic backgrounds. Radio telescopes can observe day or night, through clouds.
- ◇ Rayleigh scattering
- The scattering of light by particles much smaller than the wavelength, with efficiency proportional to 1/λ⁴. Explains why the sky is blue (blue light scattered more than red) and sunsets are red.
- ◇ Ultraviolet (UV)
- Electromagnetic radiation between visible and X-rays, with wavelengths ~10–400 nm. Absorbed by Earth's ozone layer; requires space telescopes to observe.
- ◇ X-rays
- High-energy electromagnetic radiation with wavelengths ~0.01–10 nm. Emitted by hot gas (millions of K) around black holes and in galaxy clusters.