Lecture 19: Stellar Evolution
Life on the Main Sequence and Beyond
Astronomers cannot watch one ordinary star live from birth to death on a human timescale. Instead, they compare many stars, organize those observations with tools like the H-R diagram, and use physics to infer the life story that connects the snapshots.
This lecture asks one central question:
If stars live far longer than human lives, how can astronomers know that stars evolve at all?

What to notice: the red-giant stage is the structural turning point. Once the core fuel changes, the star leaves the main sequence, and mass determines which broad fate follows. (Credit: Illustration: A. Rosen (SVG))
By the end of this reading, you should be able to explain why stars can remain stable for so long, why massive stars die sooner than low-mass stars, why stars leave the main sequence, and how star clusters let astronomers test models of stellar evolution.
What do astronomers directly observe, what physical model do they use, and what can they infer from that model about stellar lives?
The Big Idea
A star can remain stable only while its internal pressure can continue balancing gravity. During most of its life, that balance is maintained while hydrogen fusion operates in the core. But once the core fuel changes, the balance changes too, and the star must adjust its structure.
For ASTR 101, the most important controlling idea is mass. A star’s mass strongly influences how hot its core becomes, how quickly it uses fuel, how long it remains on the main sequence, and what broad evolutionary path it follows afterward.
The H-R diagram is one of astronomy’s most useful reasoning tools because it connects observable properties such as temperature and luminosity to a physical model of stellar structure, which then lets us infer a star’s size and evolutionary stage.
A star’s life story is not random. Its mass largely determines how long it lives, how it changes, and what kind of object it eventually becomes.
If you are short on time, focus on four ideas:
- Hydrostatic equilibrium keeps a main-sequence star stable.
- More massive stars burn fuel much faster and therefore live shorter lives.
- Core hydrogen exhaustion drives the red-giant phase.
- Star clusters let astronomers test stellar-evolution models by using the main-sequence turnoff as a clock.
Best approach: read straight through once, but pause at each Check Yourself, Think First, or Pause and Predict prompt and make a prediction before reading on.
If you are short on time, focus on:
- The Big Idea above
- Hydrostatic Equilibrium - why a star does not collapse immediately
- Why Massive Stars Die Faster Than Low-Mass Stars - what sets stellar lifetime
- Post-Main-Sequence Evolution: The Red Giant Phase - what changes first when core fuel changes
- Deep Dive: The H-R Diagram and Stellar Clusters - how astronomers test stellar-evolution models
Stars Are Not Forever: The Opening Hook
If you could compare the night sky today with the night sky 100 million years ago, many familiar patterns would still be recognizable - but not all of them. Some bright stars visible now would not yet have formed, and some bright stars from that older sky would already be gone.
That tells us something profound: stars change over time.
But that creates a scientific problem. Human lifetimes are far too short to watch most stars evolve directly. So how do astronomers know stellar evolution is real?
They combine three kinds of reasoning:
- Observation: they observe many stars in many different states.
- Model: they use the physics of gravity, pressure, and fusion to understand how stars should change.
- Inference: they connect those observed populations into a coherent life story.
Observable: We see young stars, main-sequence stars, red giants, white dwarfs, and supernova remnants.
Model: Stellar-structure and fusion physics tell us how stars respond when core conditions change.
Inference: These populations represent different stages of stellar evolution, even though we do not watch one individual star live through them all.

What to notice: astronomers do not watch one star age from birth to death. They compare many stellar populations, organize those observations with the H-R diagram, and use stellar physics to infer a coherent life story. (Credit: Illustration: A. Rosen (Python/Matplotlib))
Betelgeuse is a good example. It is observed to be a red supergiant. From that observation, together with stellar models, astronomers infer that it is a massive star in a late stage of evolution. That does not mean it is certain to explode on a human timescale. It means only that its total lifetime is short compared with the Sun’s and that it is already far along in that shorter life.
Astronomers cannot watch one ordinary star age all the way from birth to death. What kind of evidence would still let them build a convincing model of stellar evolution?
A star’s color and brightness are not just descriptive facts. They are evidence. From them, astronomers can infer things about a star’s temperature, radius, energy source, and evolutionary state.
That brings us to the next question: why can a star remain stable at all?
Hydrostatic Equilibrium: The Physical Engine
Before we can understand how stars change, we need to understand why they do not collapse immediately.
The Battle Between Gravity and Pressure
A star is a sphere of hot gas. Gravity pulls every part of that gas inward, toward the center. If gravity were the only important effect, the star would collapse.
But stars do not simply collapse, because the gas inside them is hot and therefore exerts pressure. That pressure pushes outward.
A stable star is a star in which these two effects balance:
- gravity pulls inward
- pressure pushes outward
This balance is called hydrostatic equilibrium.
A star is in hydrostatic equilibrium when the inward pull of gravity is balanced by the outward push of pressure throughout the star.
For ASTR 101, the most important point is not the calculus form of the equation. It is the physical meaning:
- if pressure becomes too weak, gravity wins and the star contracts
- if pressure becomes too strong, the star expands
The Thermostat: Gravity’s Built-In Feedback
The deeper idea is that a main-sequence star is not just balanced - it is self-correcting.
Imagine the core of a star like the Sun. Suppose the core contracts a little. Then:
- The gas is compressed.
- The core gets hotter.
- The pressure increases.
- The extra pressure pushes back against gravity.
Now imagine the opposite: suppose the core expands a little. Then:
- The gas cools.
- The pressure drops.
- Gravity becomes relatively stronger.
- The core is pulled inward again.
So the star behaves like a thermostat. Small disturbances trigger restoring effects.
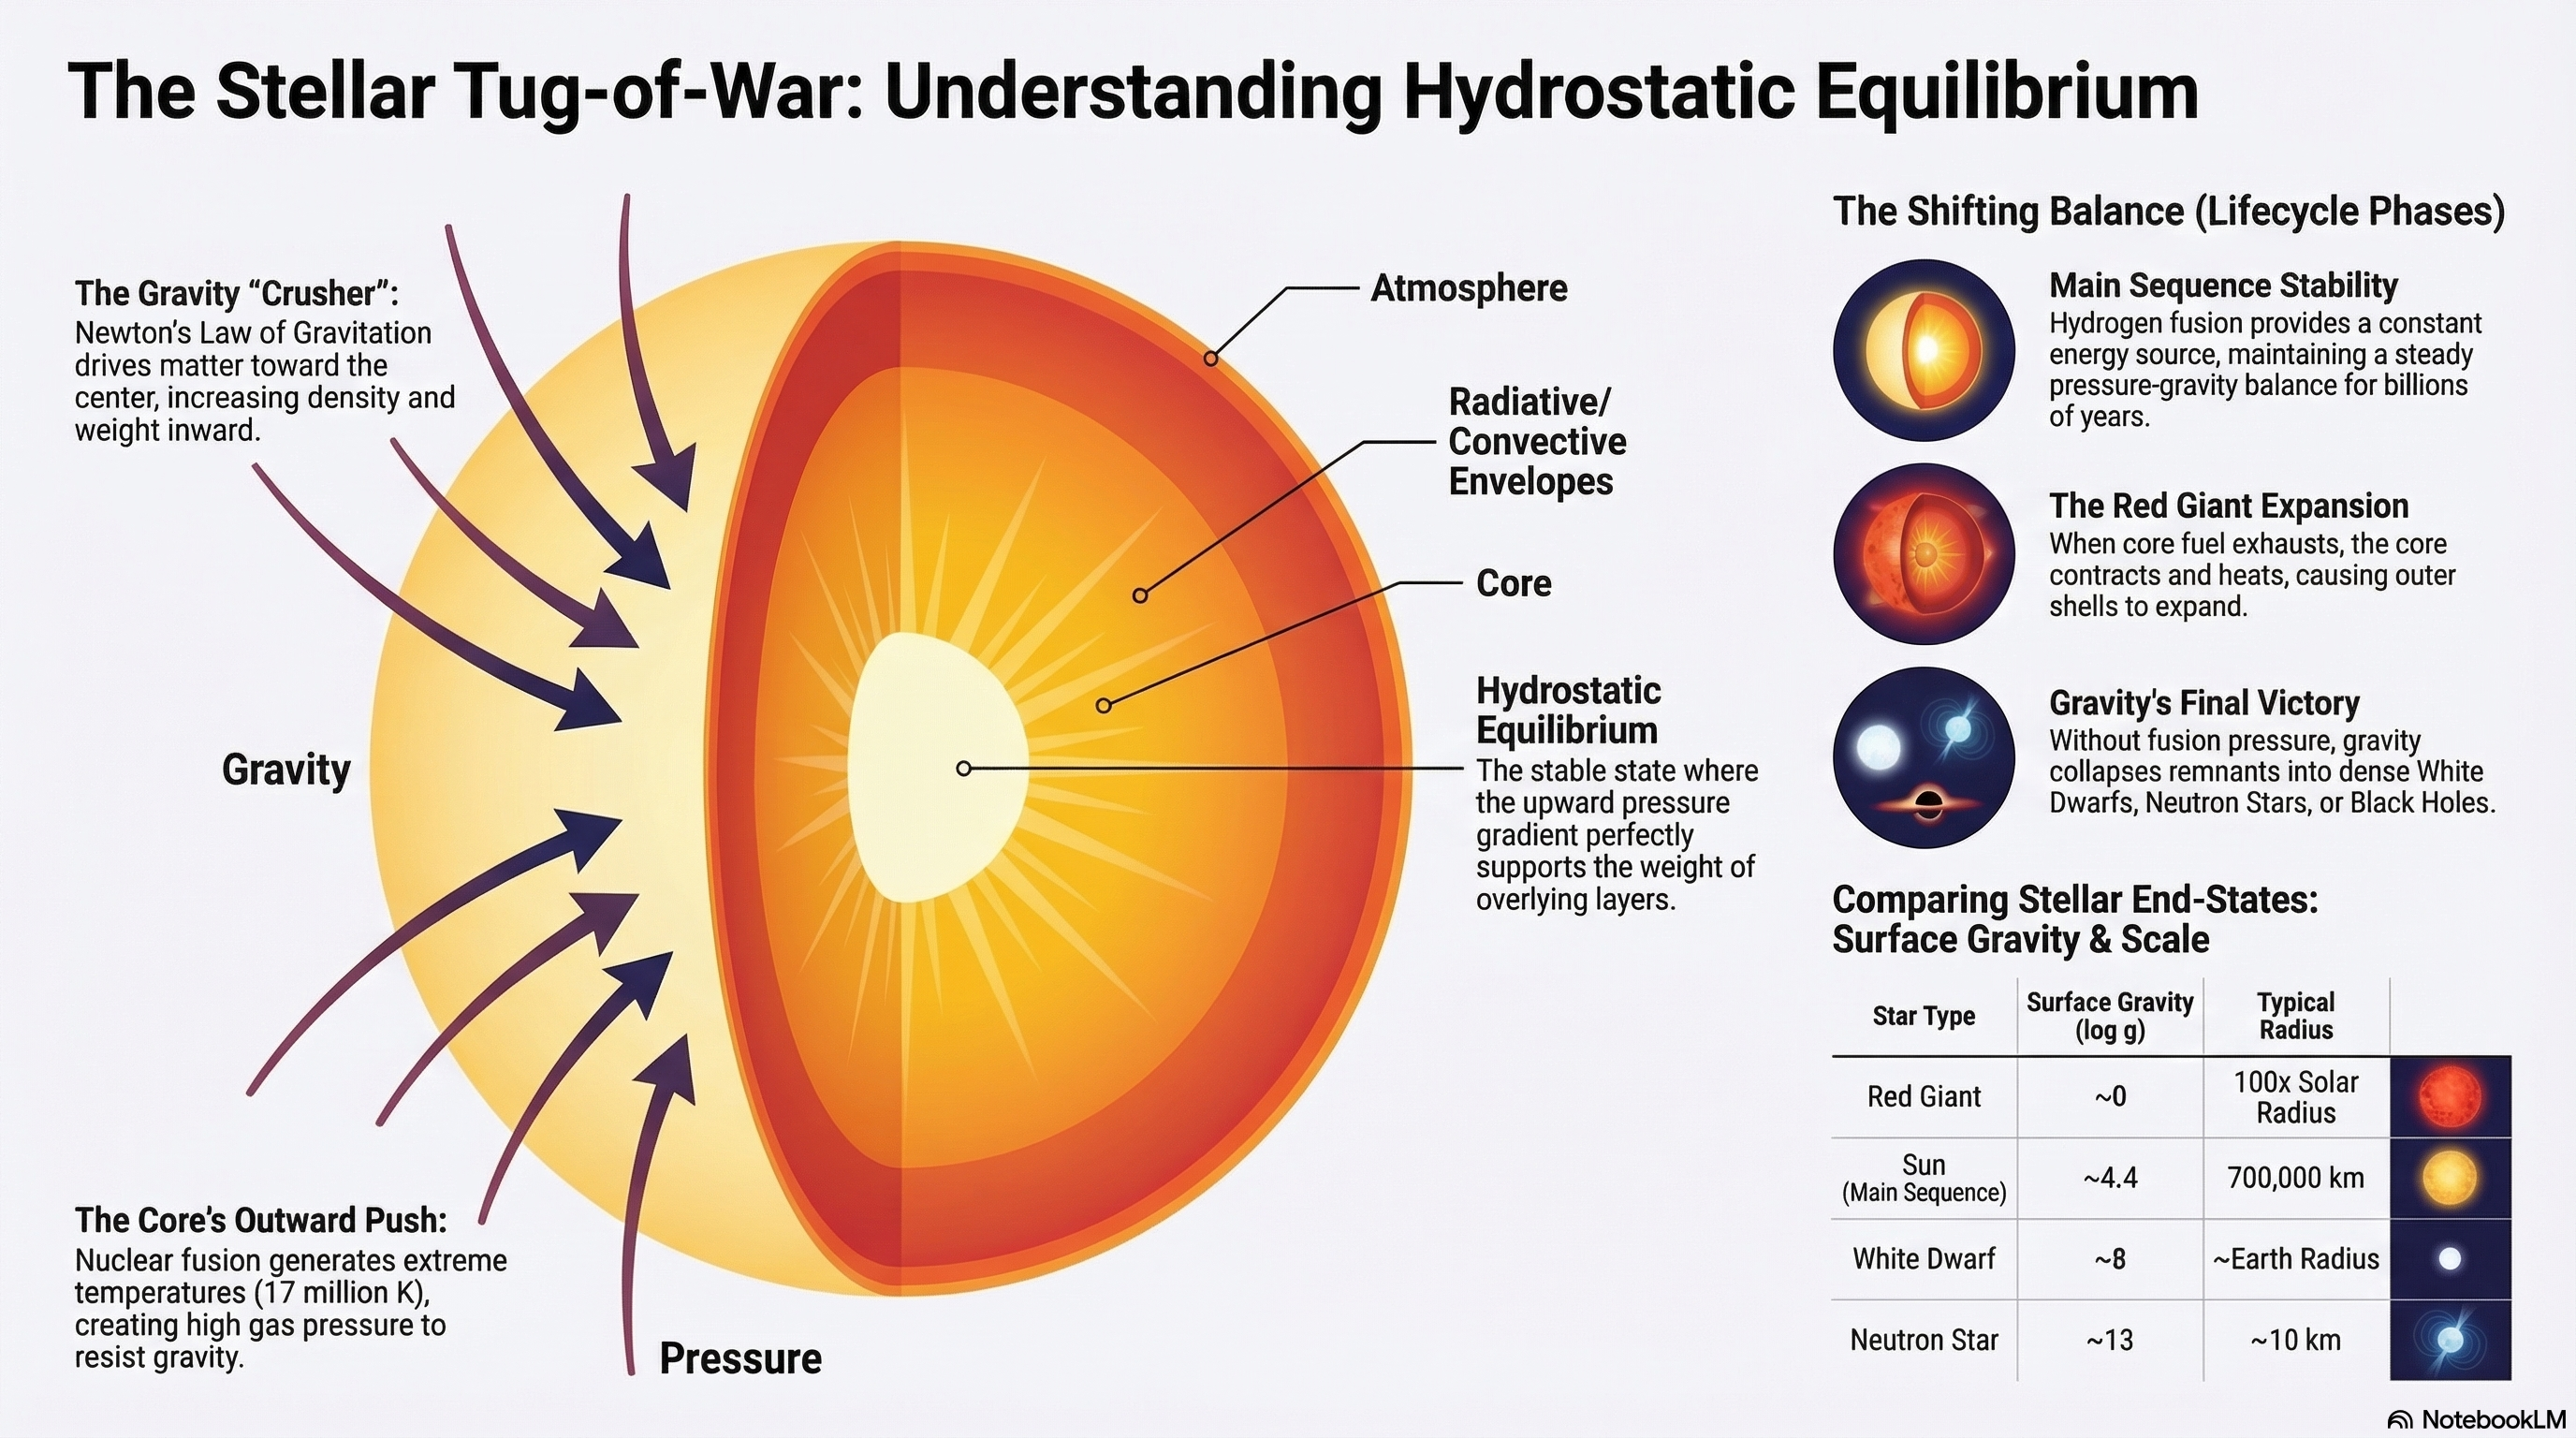
What to notice: hydrostatic equilibrium is a balance between inward gravity and outward pressure, not a frozen state. The same tug-of-war appears in the main sequence, red giant expansion, and the collapse to compact remnants.
Hydrostatic equilibrium does not mean “nothing is happening.” A stable star is full of ongoing physical processes. It stays stable because those processes are arranged in a self-regulating balance.
Misconception: A stable star is just sitting there unchanged.
Correction: A stable star is active internally. Gravity, pressure, and fusion are all operating continuously, but in a way that prevents runaway collapse or runaway expansion.
If fusion in the core suddenly weakened a little, would the core expand first or contract first? What would happen next to the temperature and pressure?
The Main Sequence: 90% of Stellar Life
A star spends most of its life on the main sequence, where it is fusing hydrogen into helium in its core. During this phase, the star remains in hydrostatic equilibrium and is structurally stable.
But not all main-sequence stars live equally long.
The Main Sequence Is a Phase, Not a Path
One common beginner mistake is to think the main sequence is the trail that one star slowly slides along as it ages.
That is not what the main sequence is.
The main sequence is a band on the H-R diagram containing stars of many different masses that are all doing the same basic thing: fusing hydrogen into helium in their cores.
A star’s mass determines where it sits on that band:
- more massive main-sequence stars are hotter and more luminous
- less massive main-sequence stars are cooler and less luminous
Misconception: “A star spends its life moving along the main sequence.”
Correction: A star spends most of its life on the main sequence in one general location set mostly by its mass. When core hydrogen is exhausted, it leaves that band.
Why Massive Stars Die Faster Than Low-Mass Stars
A star’s main-sequence lifetime depends on two competing ideas:
- how much fuel it has
- how fast it burns that fuel
A more massive star does contain more hydrogen, so it is reasonable to guess that it should live longer.
That guess is reasonable - but it is wrong.
Why? Because a more massive star also has a much hotter, denser core, so fusion runs much faster. The increase in burning rate beats the increase in fuel supply.
For many ordinary main-sequence stars, a useful rule of thumb is:
\[ L \propto M^{3.5}, \]
Here, \(L\) is luminosity and \(M\) is mass, both measured relative to the Sun.
This is not an exact law for all stars. It is a helpful intro-level scaling that captures the main trend: luminosity rises steeply with mass.
A simple lifetime argument is:
\[ t_{\rm MS} \propto \frac{\text{fuel supply}}{\text{burning rate}}, \]
Since fuel supply roughly scales with mass, and burning rate scales with luminosity, we get
\[ t_{\rm MS} \propto \frac{M}{L}. \]
Using the rough scaling above gives:
\[ t_{\rm MS} \propto M^{-2.5}. \]
You do not need to memorize the exponent. What matters is the physical conclusion:
More massive stars do have more fuel, but they burn through it much faster. That is why massive stars live shorter, not longer, lives.
A star with twice the Sun’s mass has more fuel than the Sun. Should it live longer, about the same amount of time, or much less time? Explain your reasoning in one sentence.
Worked Example: Main-Sequence Lifetimes
A common ASTR 101 estimate is:
\[ t_{\rm MS} \approx 10~\text{Gyr}\left(\frac{M}{M_\odot}\right)^{-2.5} \]
This is a rule of thumb, not an exact law. Its purpose is to show the trend clearly.
For a \(0.5\,M_\odot\) star:
\[ t_{\rm MS} \approx 10~\text{Gyr}\,(0.5)^{-2.5} \approx 57~\text{Gyr} \]
For a \(1\,M_\odot\) star:
\[ t_{\rm MS} \approx 10~\text{Gyr} \]
For a \(2\,M_\odot\) star:
\[ t_{\rm MS} \approx 10~\text{Gyr}\,(2)^{-2.5} \approx 1.8~\text{Gyr} \]
For a \(5\,M_\odot\) star:
\[ t_{\rm MS} \approx 10~\text{Gyr}\,(5)^{-2.5} \approx 0.18~\text{Gyr} = 180~\text{Myr} \]
| Mass | Approximate main-sequence lifetime | What to notice |
|---|---|---|
| \(0.5\,M_\odot\) | \(57~\text{Gyr}\) | Longer than the present age of the universe |
| \(1\,M_\odot\) | \(10~\text{Gyr}\) | Sun-like lifetime |
| \(2\,M_\odot\) | \(1.8~\text{Gyr}\) | A modest mass increase gives a much shorter life |
| \(5\,M_\odot\) | \(180~\text{Myr}\) | Massive stars live very briefly |
Misconception: If a star has more mass, it should automatically live longer because it has more fuel.
Correction: Fuel supply does increase with mass, but the fusion rate rises even faster. The faster burning rate wins.
Betelgeuse likely began with a mass of roughly \(15\)-\(20\,M_\odot\). If we use \(16\,M_\odot\) as a rough estimate,
\[ t_{\rm MS} \approx 10(16)^{-2.5}\ \text{Gyr} \approx 0.01\ \text{Gyr} = 10\ \text{Myr} \]
That does not mean Betelgeuse will explode this year or this century. It tells us only that very massive stars live extraordinarily short lives compared with stars like the Sun.
The Universe Is Frozen in Time for Low-Mass Stars
The universe is about \(13.8~\text{Gyr}\) old. That is younger than the main-sequence lifetime of many low-mass stars.
So when astronomers observe very low-mass stars today, they are usually seeing stars that are still in the long hydrogen-burning phase of life. In that sense, the universe is not yet old enough for us to have watched the smallest ordinary stars complete their full evolution.
For many low-mass stars, stellar evolution is a story we infer from physics and populations - not one we can yet confirm by seeing the entire life cycle completed in the age of the universe so far.
Post-Main-Sequence Evolution: The Red Giant Phase
What changes first when a Sun-like star runs out of hydrogen in its core?
The crucial change happens deep inside the star, not at the surface.
The Core Exhaustion Crisis
During the main sequence, hydrogen fusion in the core helps maintain the star’s internal structure. But once the core hydrogen is exhausted, the center becomes mostly helium and no longer produces much energy from hydrogen fusion.
That triggers a chain of changes:
The core contracts.
Without core hydrogen fusion to support it, the central region shrinks.The contracting core heats up.
Gravitational contraction raises the temperature of the core and nearby layers.A hydrogen-burning shell turns on.
There is still hydrogen outside the helium-rich core. As that layer is heated, hydrogen fusion begins in a thin shell around the core.The outer envelope expands.
The star’s outer layers swell dramatically, producing a much larger radius.
The result is a red giant: a star with a very large radius, a cooler surface, and a much higher luminosity than it had on the main sequence.

What to notice: the red-giant phase is not just ‘the star got old.’ It is the structural consequence of core hydrogen exhaustion, core contraction, shell burning, and envelope expansion. (Credit: Illustration: A. Rosen (SVG)) 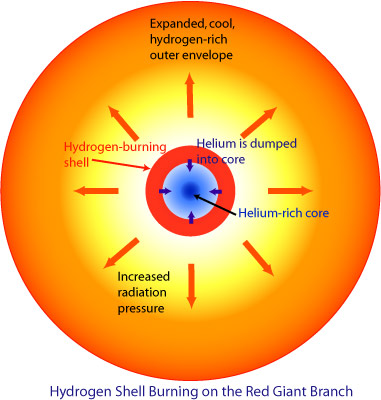
What to notice: once core hydrogen fusion ends, the action moves into a thin hydrogen-burning shell around an inert helium core. That shell produces enough energy to puff up the outer envelope and make the star a red giant.
Once core hydrogen fusion ends, the main energy-producing region shifts from the core to a shell around the core. That structural change is what drives the star toward the red-giant phase.
Why might a star’s surface get cooler even while the deep interior becomes hotter?
The surface gets cooler while the interior problem gets hotter. A red giant is not a star whose whole interior cooled down. Its core contracts and heats up, while its outer layers expand and cool.
To see why red giants are bright, we use the Stefan-Boltzmann law:
\[ L = 4\pi R^2 \sigma T^4 \tag{1}\]
Stefan-Boltzmann law
What it predicts
Given \(R\) and \(T\), it predicts the luminosity \(L\).
What it depends on
Scales as \(L \propto R^2 T^4\).
What it's saying
Luminosity depends on surface area (\(R^2\)) and temperature (\(T^4\)). Double the temperature, get 16× the luminosity.
Assumptions
- Blackbody radiation
- Spherical, uniformly radiating surface
- Effective surface temperature
See: the equation
For ASTR 101, the key idea is the proportional form:
\[ L \propto R^2 T^4 \]
This tells us that luminosity depends on both surface temperature and surface area. Even if the temperature drops, the luminosity can still rise if the radius becomes large enough.
That is why red giants sit in the upper-right part of the H-R diagram: they are cool at the surface but very luminous because they are so large.

What to notice: if two stars have the same surface temperature, the more luminous one must have the larger radius. That is the key inference behind why red giants can be cool but bright. (Credit: Illustration: A. Rosen (Python/Matplotlib))
If two stars have the same surface temperature, the more luminous one must have the larger radius.
Misconception: A cooler surface means the whole star has cooled down.
Correction: In a red giant, the outer layers cool as they expand, but the core itself becomes hotter as it contracts.
Red Giant
A red giant is an evolved star whose outer layers have expanded after core hydrogen is exhausted. In the first red-giant phase, the star is powered mainly by hydrogen shell burning around a helium-rich core.
In everyday classroom language, you may sometimes hear “giant” used broadly for cool, expanded evolved stars. But in more careful stellar classification, red giants and red supergiants are not the same mass regime. A Sun-like star becomes a red giant; a much more massive star can become a red supergiant.
The Asymptotic Giant Branch (AGB)
Later, after helium burning in the core has ended, a low- or intermediate-mass star can expand again into a second giant phase called the asymptotic giant branch.
For ASTR 101, the exact label matters less than the physical picture: fusion is no longer happening in the core itself, but in shells around a compact core. The star becomes very luminous, unstable, and can lose a great deal of mass.
Eventually, the hot core left behind becomes a white dwarf.
The H-R Diagram As An Evolutionary Map
The H-R diagram is not just a catalog of star types. It is also a map of stellar evolution.
For a Sun-like star, the first major move after the main sequence is toward the upper right of the diagram:
- upward, because the star becomes more luminous
- to the right, because the surface becomes cooler
That motion corresponds to the red-giant phase.
On an H-R diagram:
- farther left means hotter
- farther right means cooler
- higher up means more luminous
- lower down means less luminous
It is a graph of stellar properties, not a map of where stars are located in space.
A star’s full evolutionary track depends primarily on its mass. Composition and binary interactions can matter too, but for ASTR 101 the main control knob is mass.
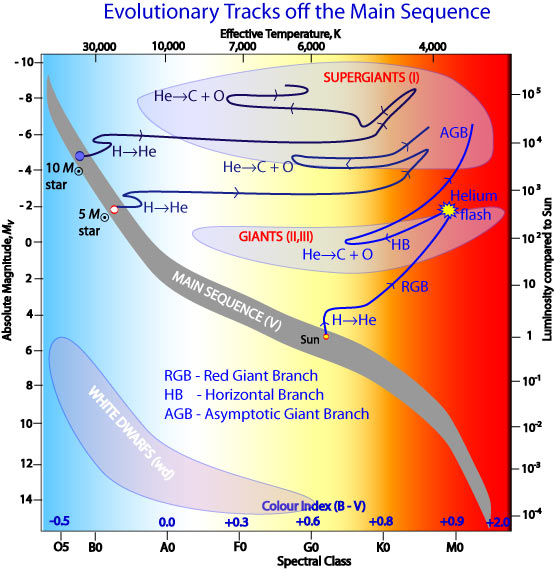
What to notice: once a Sun-like star exhausts core hydrogen, it does not drift gently. It leaves the main sequence, climbs the red giant branch, flashes helium, and later returns to the upper right on the asymptotic giant branch.
Once a Sun-like star exhausts core hydrogen, it does not drift gently along the main sequence. It leaves that band and moves into new regions of the H-R diagram because its structure has changed.
When reading an H-R diagram, always ask three questions in order:
- Is the star hotter or cooler than the Sun?
- Is it more luminous or less luminous than the Sun?
- Given those two answers, what does that suggest about its radius and evolutionary stage?
Figure Reading Check
A star lies farther right than the Sun on an H-R diagram, but much higher up.
Before reading further, answer:
- Is its surface hotter or cooler than the Sun’s?
- Is it more luminous or less luminous than the Sun?
- Must its radius be larger or smaller than the Sun’s?
Observable: A star appears cool but very luminous, so it sits in the upper-right part of the H-R diagram.
Model: The Stefan-Boltzmann law says a cool star can be very luminous only if its radius is large. Stellar-structure models then tell us that such a large star is usually in an evolved stage with shell burning and an expanded envelope.
Inference: The star is likely a giant or supergiant, not an ordinary main-sequence star.
What makes the H-R diagram powerful is that it lets astronomers move from what we observe to what we infer about the star’s internal physics.
This short video works well here because it asks students to read the H-R diagram as an evolutionary map rather than as a static classification chart. Watch for the same ideas we just used: the diagonal main-sequence band is a population pattern, and stars peel away from it in different directions as they evolve.
Caption: Use this as a guided figure-reading pause. The goal is not to memorize labels; it is to practice reading the H-R diagram as evidence about stellar size, temperature, and evolutionary change.
How Low-, Intermediate-, and Massive Stars Diverge After the Main Sequence
Once stars leave the main sequence, mass still controls what happens next.
For ASTR 101, the most important point is not every stage name. The key point is that stars of different masses do not follow the same post-main-sequence path.
For the big-picture fate map in this lecture, it helps to separate three broad regimes:
- low-mass stars: roughly below \(3\,M_\odot\)
- intermediate-mass stars: roughly \(3\)-\(8\,M_\odot\)
- massive stars: greater than about \(8\,M_\odot\)
These boundaries are approximate, not exact. Real stars depend on composition and internal structure. Also, the boundary for helium flash physics is lower than the boundary for becoming a truly massive star, so different questions can involve different approximate cutoffs.
Low-Mass Stars (roughly below \(3\,M_\odot\))
In low-mass red giants, the helium core can become extremely dense. Under those conditions, electron degeneracy pressure becomes important.
For ASTR 101, the essential idea is this: in ordinary hot gas, higher temperature usually means higher pressure, so heating causes expansion and helps stabilize the gas. In degenerate matter, pressure depends much less on temperature, so that usual thermostat effect is weakened.
When helium fusion first begins in such a dense core, it can turn on suddenly in an event called the helium flash.
Misconception: “Helium flash” means the whole star explodes like a supernova.
Correction: The helium flash is a dramatic event in the core physics, not the destruction of the star.
After that, the star settles into a quieter helium-burning stage. Later, it sheds its outer layers, and the hot compact core left behind becomes a white dwarf.
A white dwarf is not powered by core fusion. It is the compact leftover core of a low- or intermediate-mass star, supported mainly by electron degeneracy pressure.
Intermediate-Mass Stars (roughly \(3\)-\(8\,M_\odot\))
Intermediate-mass stars are more massive than Sun-like stars, but they are not the same thing as truly massive stars. Their cores are usually not as strongly degenerate when helium ignition begins, so helium fusion starts more smoothly.
After helium is exhausted, they can pass through later giant stages and lose a great deal of mass. But they do not usually continue all the way to iron-core collapse. Their broad fate is still to shed outer layers and leave behind a white dwarf.
Massive Stars (\(> 8\,M_\odot\))
These are the stars that truly follow the high-mass end of stellar evolution. After helium is exhausted, they can keep igniting heavier fuels in the core and in shells. They become supergiants and eventually enter the dramatic core-collapse end stages discussed in the next lecture.
After the main sequence, stellar lives diverge because different masses produce different core conditions. Intermediate-mass stars are not yet the same as truly massive stars, and the broad supernova boundary lies above about \(8\,M_\odot\).
Worked Example: Interpreting Two Red Giants
You observe two stars in the upper-right part of the H-R diagram. Star A is more luminous than Star B. Both are clearly cooler than the Sun.
What can you say with confidence?
What you can infer:
- Both stars are large, evolved stars.
- Their cool temperatures and high luminosities place them in the giant region.
- Neither is an ordinary main-sequence star.
What you can probably infer:
- Since Star A is more luminous than Star B and both are cool, Star A is likely larger in radius.
What you cannot infer from the H-R diagram alone:
- their exact masses
- their exact ages
- their full detailed evolutionary histories
Different stars can pass through the giant region at different times and with different masses. The H-R diagram is powerful, but not every stellar property can be read directly from one plotted point.
From temperature and luminosity, you can often infer radius and broad evolutionary stage. But you usually need more information - such as spectra, cluster membership, or stellar models - to infer mass or age well.
Common Misconceptions About Stellar Evolution
Correction: The main sequence is a band of stars with different masses that are all in the same basic phase: hydrogen fusion in the core. A star does not spend its life crawling along that band. When core hydrogen is exhausted, it leaves the main sequence.
Correction: A red giant is an evolutionary phase, not a separate species of star. A star that is a red giant today was once a main-sequence star.
Correction: Temperature alone does not determine luminosity. A star can be cool but still very luminous if its radius is large enough.
Correction: The H-R diagram is a graph of stellar properties - usually temperature and luminosity - not a picture of physical positions.
Correction: When the Sun becomes a red giant, the outer layers expand and cool, but the core becomes hotter as it contracts.
Deep Dive: The H-R Diagram and Stellar Clusters
Star clusters are especially useful because their stars formed at about the same time and are at about the same distance from us. That means differences in their H-R diagram mostly reflect differences in stellar mass and evolution, not large distance differences from star to star.
As a cluster ages, its most massive stars leave the main sequence first. The point where stars are just beginning to peel away is called the main-sequence turnoff.
That gives astronomers a clock.
- In a young cluster, the turnoff is high and to the left because even massive hot stars are still on the main sequence.
- In an older cluster, the turnoff is lower and farther to the right because only lower-mass stars remain on the main sequence.
So the turnoff tells us the lifetime of the most massive stars still surviving in the hydrogen-burning phase, and that gives the cluster’s age.
Observable: The cluster H-R diagram shows where the main sequence ends.
Model: More-massive stars have shorter main-sequence lifetimes.
Inference: The turnoff mass gives the cluster’s age.
This short Hubble visualization is worth watching because it shows the exact move astronomers make in this section: start with a star-cluster image, sort stars by color and brightness, and reveal the H-R diagram hidden inside the picture.

What to notice: as a cluster ages, the main-sequence turnoff moves downward and to the right. That shift lets astronomers estimate the cluster’s age. (Credit: Illustration: A. Rosen (Python/Matplotlib))
As a cluster ages, the main-sequence turnoff moves downward and to the right. That shift is the reason the turnoff works as an age indicator.
This animation is especially useful after the turnoff figure because it makes the age logic visible. As the stellar population ages, the upper main sequence empties out first, and the turnoff slides downward and to the right.
Caption: A cluster-evolution animation that helps students see why turnoff works as a clock: the most massive main-sequence stars disappear first, while lower-mass stars remain.
Misconception: A cluster age comes from measuring one star’s exact birthday.
Correction: Cluster age is inferred from the population pattern - especially the turnoff point - together with stellar lifetime models.
Worked Example: Estimating a Cluster Age
Suppose a cluster has a main-sequence turnoff near spectral type F, with temperature about \(6500\ \text{K}\) and luminosity about \(4\,L_\odot\).
A star near that turnoff has a mass of about \(1.4\,M_\odot\).
Using the rough lifetime relation,
\[ t_{\rm MS} \approx 10\left(\frac{M}{M_\odot}\right)^{-2.5}\ \text{Gyr}, \]
we get
\[ t_{\rm MS} \approx 10(1.4)^{-2.5}\ \text{Gyr} \approx 4.3\ \text{Gyr}. \]
So the cluster age is about \(4~\text{Gyr}\).
The exact age would come from more detailed stellar models, but even this rough estimate already tells the main physical story: the cluster is old enough that stars somewhat more massive than the Sun have already evolved off the main sequence.
Why does the turnoff point act more like a clock than a random detail of the diagram?
Summary
Stars are not eternal. They are born with a finite fuel supply, and the rate at which they use that fuel depends strongly on mass.
A main-sequence star remains stable because it is in hydrostatic equilibrium: gravity pulls inward while pressure pushes outward. This balance is self-correcting, which is why stars can remain stable for such long times.
More massive stars have more fuel, but they burn it much faster. That is why massive stars have shorter main-sequence lifetimes than low-mass stars.
When core hydrogen is exhausted, the star’s structure changes. The core contracts, the region around it heats up, hydrogen fusion continues in a shell, and the outer layers expand. The star becomes a red giant: cool at the surface, but large and luminous overall.
The H-R diagram lets astronomers connect what they observe - temperature and luminosity - to what they infer about a star’s size, internal structure, and evolutionary stage.
Star clusters are especially powerful because their stars formed at roughly the same time. Their main-sequence turnoff acts like a clock, allowing astronomers to estimate cluster ages and test models of stellar evolution.
Stellar evolution is not a list of labels to memorize. It is a physical story about how stars respond when their core conditions change - and mass is the main factor that determines how that story unfolds.
Self-Assessment Checklist
After reading this lecture, you should be able to say yes to each of the following:
Practice Problems
Solutions are available in the Lecture 19 Solutions.
Core Problems
Problem 1: Main-Sequence Lifetime Calculation
A star has a mass of \(3\,M_\odot\).
- Use \[ t_{\rm MS} \approx 10~\text{Gyr}\left(\frac{M}{M_\odot}\right)^{-2.5} \] to estimate its main-sequence lifetime.
- If the star formed at the same time as the Sun, about \(4.6~\text{Gyr}\) ago, would it still be on the main sequence today?
- If not, what broad conclusion can you draw about its present evolutionary state?
Problem 2: The Red-Giant Sun
In about \(5\) billion years, the Sun will exhaust its core hydrogen and become a red giant.
Suppose its luminosity becomes \(2000\,L_\odot\) and its surface temperature drops to \(3500~\text{K}\).
Use the ratio form of the Stefan-Boltzmann law:
\[ \frac{L_{\rm future}}{L_\odot} = \left(\frac{R_{\rm future}}{R_\odot}\right)^2 \left(\frac{T_{\rm future}}{T_\odot}\right)^4 \]
- Estimate the Sun’s future radius in units of \(R_\odot\).
- Explain in words why the radius must become so large.
Problem 3: Interpreting An H-R Diagram
You observe a star that is cooler than the Sun (farther right on the H-R diagram) but has the same luminosity as the Sun, about \(1\,L_\odot\).
- Using \(L \propto R^2 T^4\), is this star larger or smaller than the Sun?
- What can you infer confidently from temperature and luminosity alone?
- What can you not determine from the H-R diagram alone?
Problem 4: Cluster Age from Main-Sequence Turnoff
An open cluster shows a main-sequence turnoff near spectral type F, with temperature about \(6500~\text{K}\) and luminosity about \(4\,L_\odot\).
- Estimate the mass of the turnoff star.
- Use \[ t_{\rm MS} \approx 10~\text{Gyr}\left(\frac{M}{M_\odot}\right)^{-2.5} \] to estimate the cluster age.
- In one sentence, explain why the turnoff point acts like a clock.
Problem 5: Two Stars, Same Cluster
A young cluster contains both a \(50\,M_\odot\) star and a \(1\,M_\odot\) star, formed at the same time.
- Which star will leave the main sequence first?
- About how long will the \(1\,M_\odot\) star remain on the main sequence?
- What does this tell you about why clusters can contain stars in very different evolutionary stages at the same time?
Challenge Problems
Challenge 1: Gravity As An Energy Source
A star contracts slightly under gravity.
- What happens to its gravitational potential energy?
- What happens to its thermal energy and temperature?
- Why does that help explain the thermostat behavior of a star?
Challenge 2: A Very Old Universe
Imagine the universe \(1\) trillion years from now.
- Which kinds of stars would still remain on the main sequence?
- Where would the main-sequence turnoff lie on the H-R diagram?
- Why would that make the turnoff harder to observe?
Challenge 3: Reasoning From Populations
Suppose you observed \(10{,}000\) red giants across the sky.
- Would that mean the red-giant phase lasts forever?
- What would the large number of red giants actually tell you about stellar populations and evolutionary timescales?
- Why are population snapshots so important in astronomy?
Glossary
- ★ Asymptotic Giant Branch (AGB)
- A late evolutionary phase of low- and intermediate-mass stars in which hydrogen and helium burn in shells around a compact core. The star becomes very luminous, unstable, and loses mass through a strong wind.
- ★ Degenerate Matter
- Matter so dense that it is supported by quantum effects (electron degeneracy pressure) rather than thermal pressure. Found in white dwarfs and low-mass red giant cores.
- ★ Evolutionary Track
- The path a star traces on the H-R diagram as it evolves through different stages of its life (main sequence → red giant → white dwarf, etc.). Different masses follow different tracks.
- ★ Helium Flash
- A thermonuclear runaway in the degenerate helium core of a low-mass red giant. The energy release is enormous, but it mainly restructures the core rather than producing a dramatic visible explosion of the star.
- ★ Horizontal Branch
- A phase of stable helium-core burning that follows the red-giant phase in many low-mass stars. In some stellar populations, similar helium-burning stars appear as the red clump.
- ★ Hydrostatic Equilibrium
- The balance between the outward pressure force and the inward gravitational force that keeps a star from collapsing or exploding. A stable star is in hydrostatic equilibrium.
- ★ Isochrone
- A curve on the H-R diagram representing all stars of the same age but different masses. Isochrone fitting compares observed clusters to theoretical models to determine age.
- ★ Main Sequence
- The diagonal band on an H-R diagram where ~90% of stars lie and ~90% of stellar lifetimes are spent. All main-sequence stars are burning hydrogen in their cores.
- ★ Main-Sequence Lifetime
- The total time a star spends burning hydrogen in its core, given by \(t_{\text{MS}} \propto M^{-2.5}\). Massive stars have short lifetimes; low-mass stars have long lifetimes.
- ★ Red Giant
- An evolved star whose outer layers have expanded after core hydrogen is exhausted. Red giants have cool surfaces, large radii, and high luminosities, and are powered mainly by shell burning around a compact core.
- ★ Red Giant Branch (RGB)
- The region of the H-R diagram (upper right) where red giants lie. Stars move from the main sequence to the red giant branch when core hydrogen is exhausted.
- ★ Shell Burning
- Nuclear fusion occurring in a thin shell surrounding an inert core, rather than in the core itself. Shell-burning luminosity can exceed core-burning luminosity.
- ★ Stefan-Boltzmann Law
- \(L = 4\pi R^2 \sigma T^4\), relating luminosity to radius and surface temperature. Shows that cooler, larger stars can be as luminous as hotter, smaller stars.
- ★ Supergiant
- A massive, evolved star with enormous radius (>100 \(R_\odot\)) and high luminosity. High-mass stars become supergiants before exploding as supernovae.
- ★ Thermostat (Stellar)
- The self-regulating feedback mechanism in a star: if the core contracts and heats up, pressure increases and pushes back; if it expands and cools, gravity wins again. This keeps main-sequence stars stable.
- ★ Turnoff Point
- On the H-R diagram of a star cluster, the point where the main sequence ends — the most massive stars still burning hydrogen in their cores. Because massive stars leave the main sequence first, the turnoff point can be used to estimate cluster age.
- ★ White Dwarf
- The compact remnant left behind after a low- or intermediate-mass star loses its outer layers. A white dwarf is small, dense, and no longer powered by core fusion; it is supported mainly by electron degeneracy pressure.
This reading is designed to support the Observable \(\rightarrow\) Model \(\rightarrow\) Inference pedagogy of ASTR 101. As you move through the lecture and problem sets, ask yourself: What do I observe in the night sky and in H-R diagrams? What physical models explain those observations? What can I infer about stellar lives, ages, and fates?
For further exploration, see OpenStax Chapter 22 (Stars from Adolescence to Old Age) and the companion interactive demo on the Cosmic Playground.