Lecture 1: Galaxies as Ecosystems
Gas, dust, stars, feedback, and the baryon cycle
Learning Objectives
After completing this reading, you should be able to:
- Describe galaxies as evolving systems made of stars, gas, dust, remnants, dark matter, and feedback.
- Identify which physical components are revealed by optical, infrared, radio, and high-energy observations.
- Explain why cold dense gas is the raw material for star formation.
- Connect stellar evolution to galaxy evolution through mass loss, supernovae, metal enrichment, and feedback.
- Infer whether a galaxy is actively forming stars, being disturbed, or running low on star-forming fuel from observable clues.
Concept Throughline
A galaxy is not a container of stars. A galaxy is an ecosystem. Gas falls in, cools, forms stars, gets heated, stirred, enriched, and sometimes expelled. Stars are not just inhabitants of galaxies; they reshape the future of the galaxy that made them.
This is the first reading in the final module of ASTR 201. We are zooming out from individual stars to the environments that make stars possible. The same course method still applies: observe → model → infer. We observe light at many wavelengths. We model which physical component produces that light. Then we infer what the galaxy is doing now and what it has been doing over cosmic time.
Track A (Core, ~30 min): Read Parts 1–7 in order, including the Quick Checks, the dynamical-timescale checkpoint, and the exit ticket. This gives you the galaxy-as-ecosystem model you need for class.
Track B (Full, ~40 min): Read everything in Track A, then linger on the Rubin video and each figure long enough to write one observable clue from it. This deeper pass is especially useful if galaxy images feel like pictures rather than evidence yet.
Both tracks cover the learning objectives. Track B adds practice turning visual structure into physical history.
Watch the Rubin/LSST zoom-out before you read the rest of the lesson. As you watch, notice the observable diversity: smooth blobs, spirals, interacting systems, color differences, and sheer number density. The point is not to classify everything yet; it is to make galaxy diversity the evidence.
Part 1: The Observable Is Diversity
The first thing to notice is that galaxies are not all the same. Some are blue and clumpy. Some are smooth and yellow-red. Some have grand spiral arms; others look disturbed, stretched, or shredded by interaction. Some are bright in the infrared because dust is being heated by young stars. Some have faint outer halos that are easier to miss than their spectacular centers.
That diversity is not decoration. It is evidence.
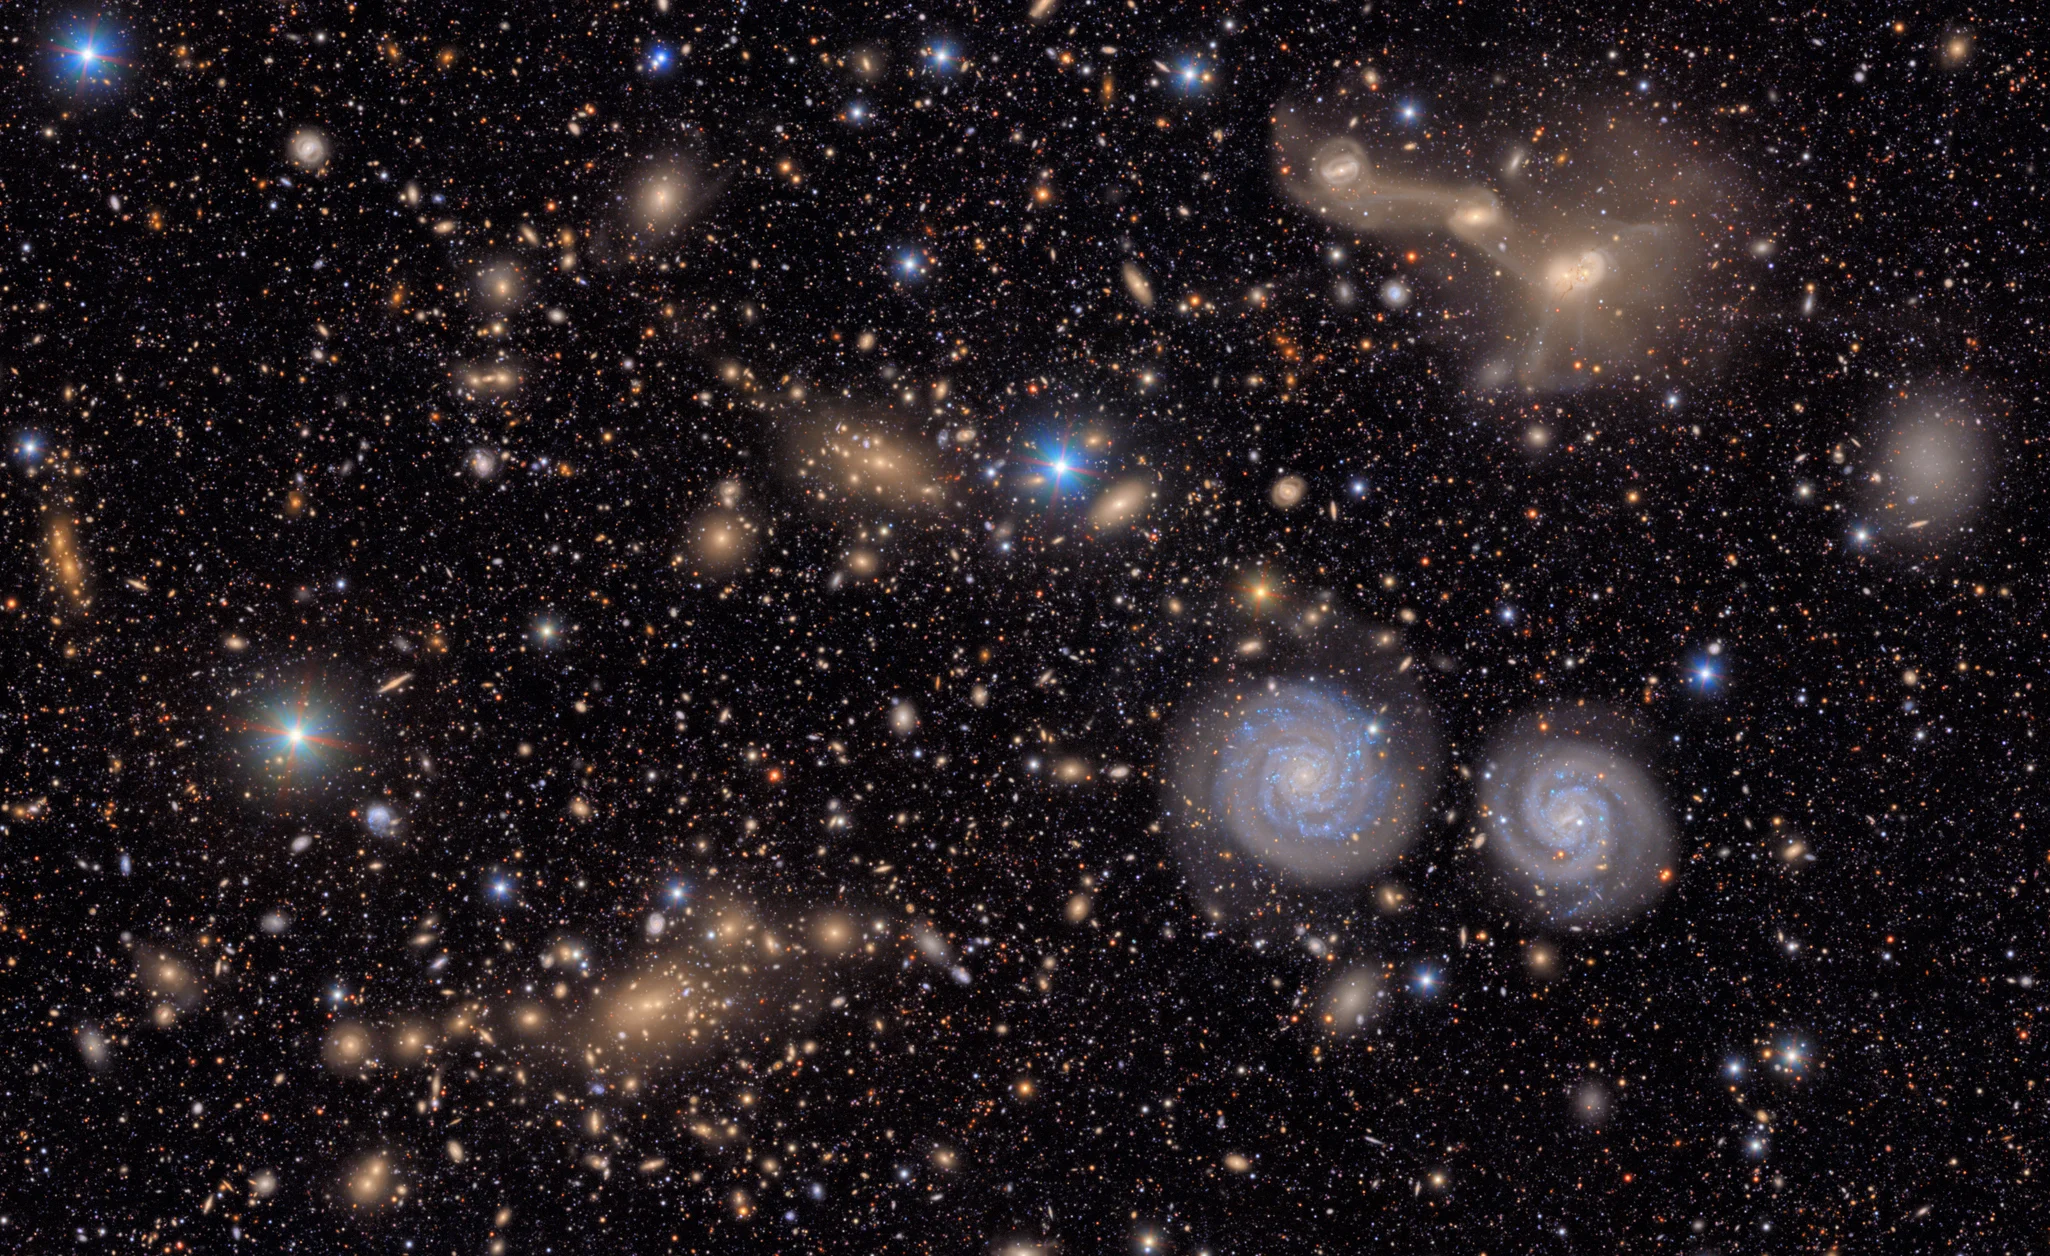
What to notice: A deep Rubin/LSST field is a galaxy census, not just a pretty picture. The field contains many galaxy colors, shapes, sizes, and distances at once. (Credit: NSF-DOE Vera C. Rubin Observatory)
When you look at a deep field, you are seeing many galaxies at once, but not all at the same distance or the same age. Some are nearby enough that their structure is clear. Others are so far away that their light has been traveling for billions of years. In one image, astronomy gives us a mixed archive: different shapes, different colors, different distances, and different moments in cosmic history.
This is where our course throughline matters. If we stopped at observation, we would have only a catalog: spiral, elliptical, irregular, peculiar. Useful, but not enough. To turn the catalog into astrophysics, we need a model for why these differences exist.
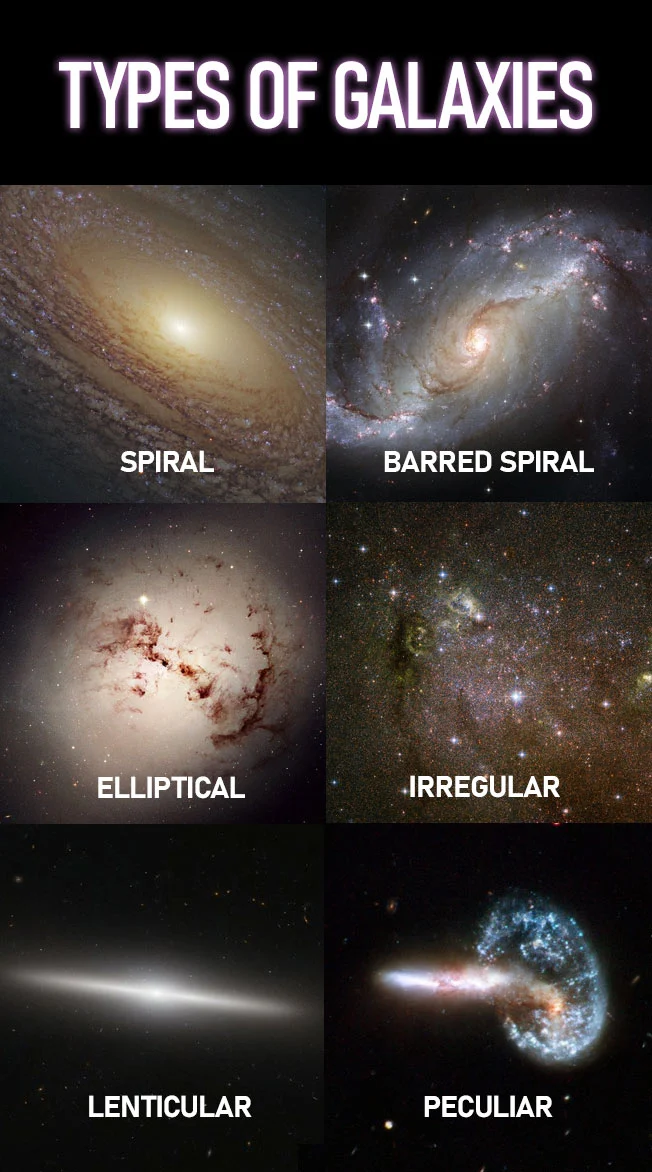
What to notice: Galaxy diversity is visible before we explain it. Spirals, ellipticals, irregulars, and peculiar systems point to different gas contents, star-formation histories, and dynamical histories.
Galaxy morphology is a first pass at organizing the evidence. Spiral galaxies often contain cold gas, dust, and ongoing star formation. Elliptical galaxies are often smoother, redder, and poorer in cold gas. Irregular and peculiar galaxies often carry the signatures of disturbance: gravitational interactions, recent star formation, or disrupted structure. These are tendencies, not laws of nature. The point is not to memorize a taxonomy. The point is to ask: What history would produce this appearance?
Rubin Observatory will not just give astronomers prettier galaxy images. Its power comes from scale and repetition: wide fields, many objects, and repeated observations. That changes the question from “What kind of galaxy is this?” to “How do galaxy populations vary across environment and time?” In other words, Rubin turns diversity into statistics.
Observable: color, shape, dust lanes, clumps, tidal features, and brightness patterns.
Model: galaxies are systems where gas, stars, dust, and gravity interact over time.
Inference: galaxy appearance can reveal star-formation history, gas supply, mergers, and feedback.
Two galaxies have the same total brightness. One is smooth and yellow-red; the other is blue, patchy, and dusty. Which one is more likely to be forming stars right now, and what observable clues support that inference?
The blue, patchy, dusty galaxy is more likely to be actively forming stars. Blue light points to hot, massive, short-lived stars, which means recent star formation. Patchy structure and dust often mark gas-rich regions where stars are forming or have recently formed.
Part 2: The Milky Way Is Our Close-Up Laboratory
The Milky Way is the galaxy we know best and the one we know most awkwardly. We live inside its disk, which means we cannot simply step outside and take a clean photograph of the whole structure. Instead, we infer the Milky Way’s anatomy from star counts, gas maps, dust extinction, stellar motions, and multiwavelength observations.
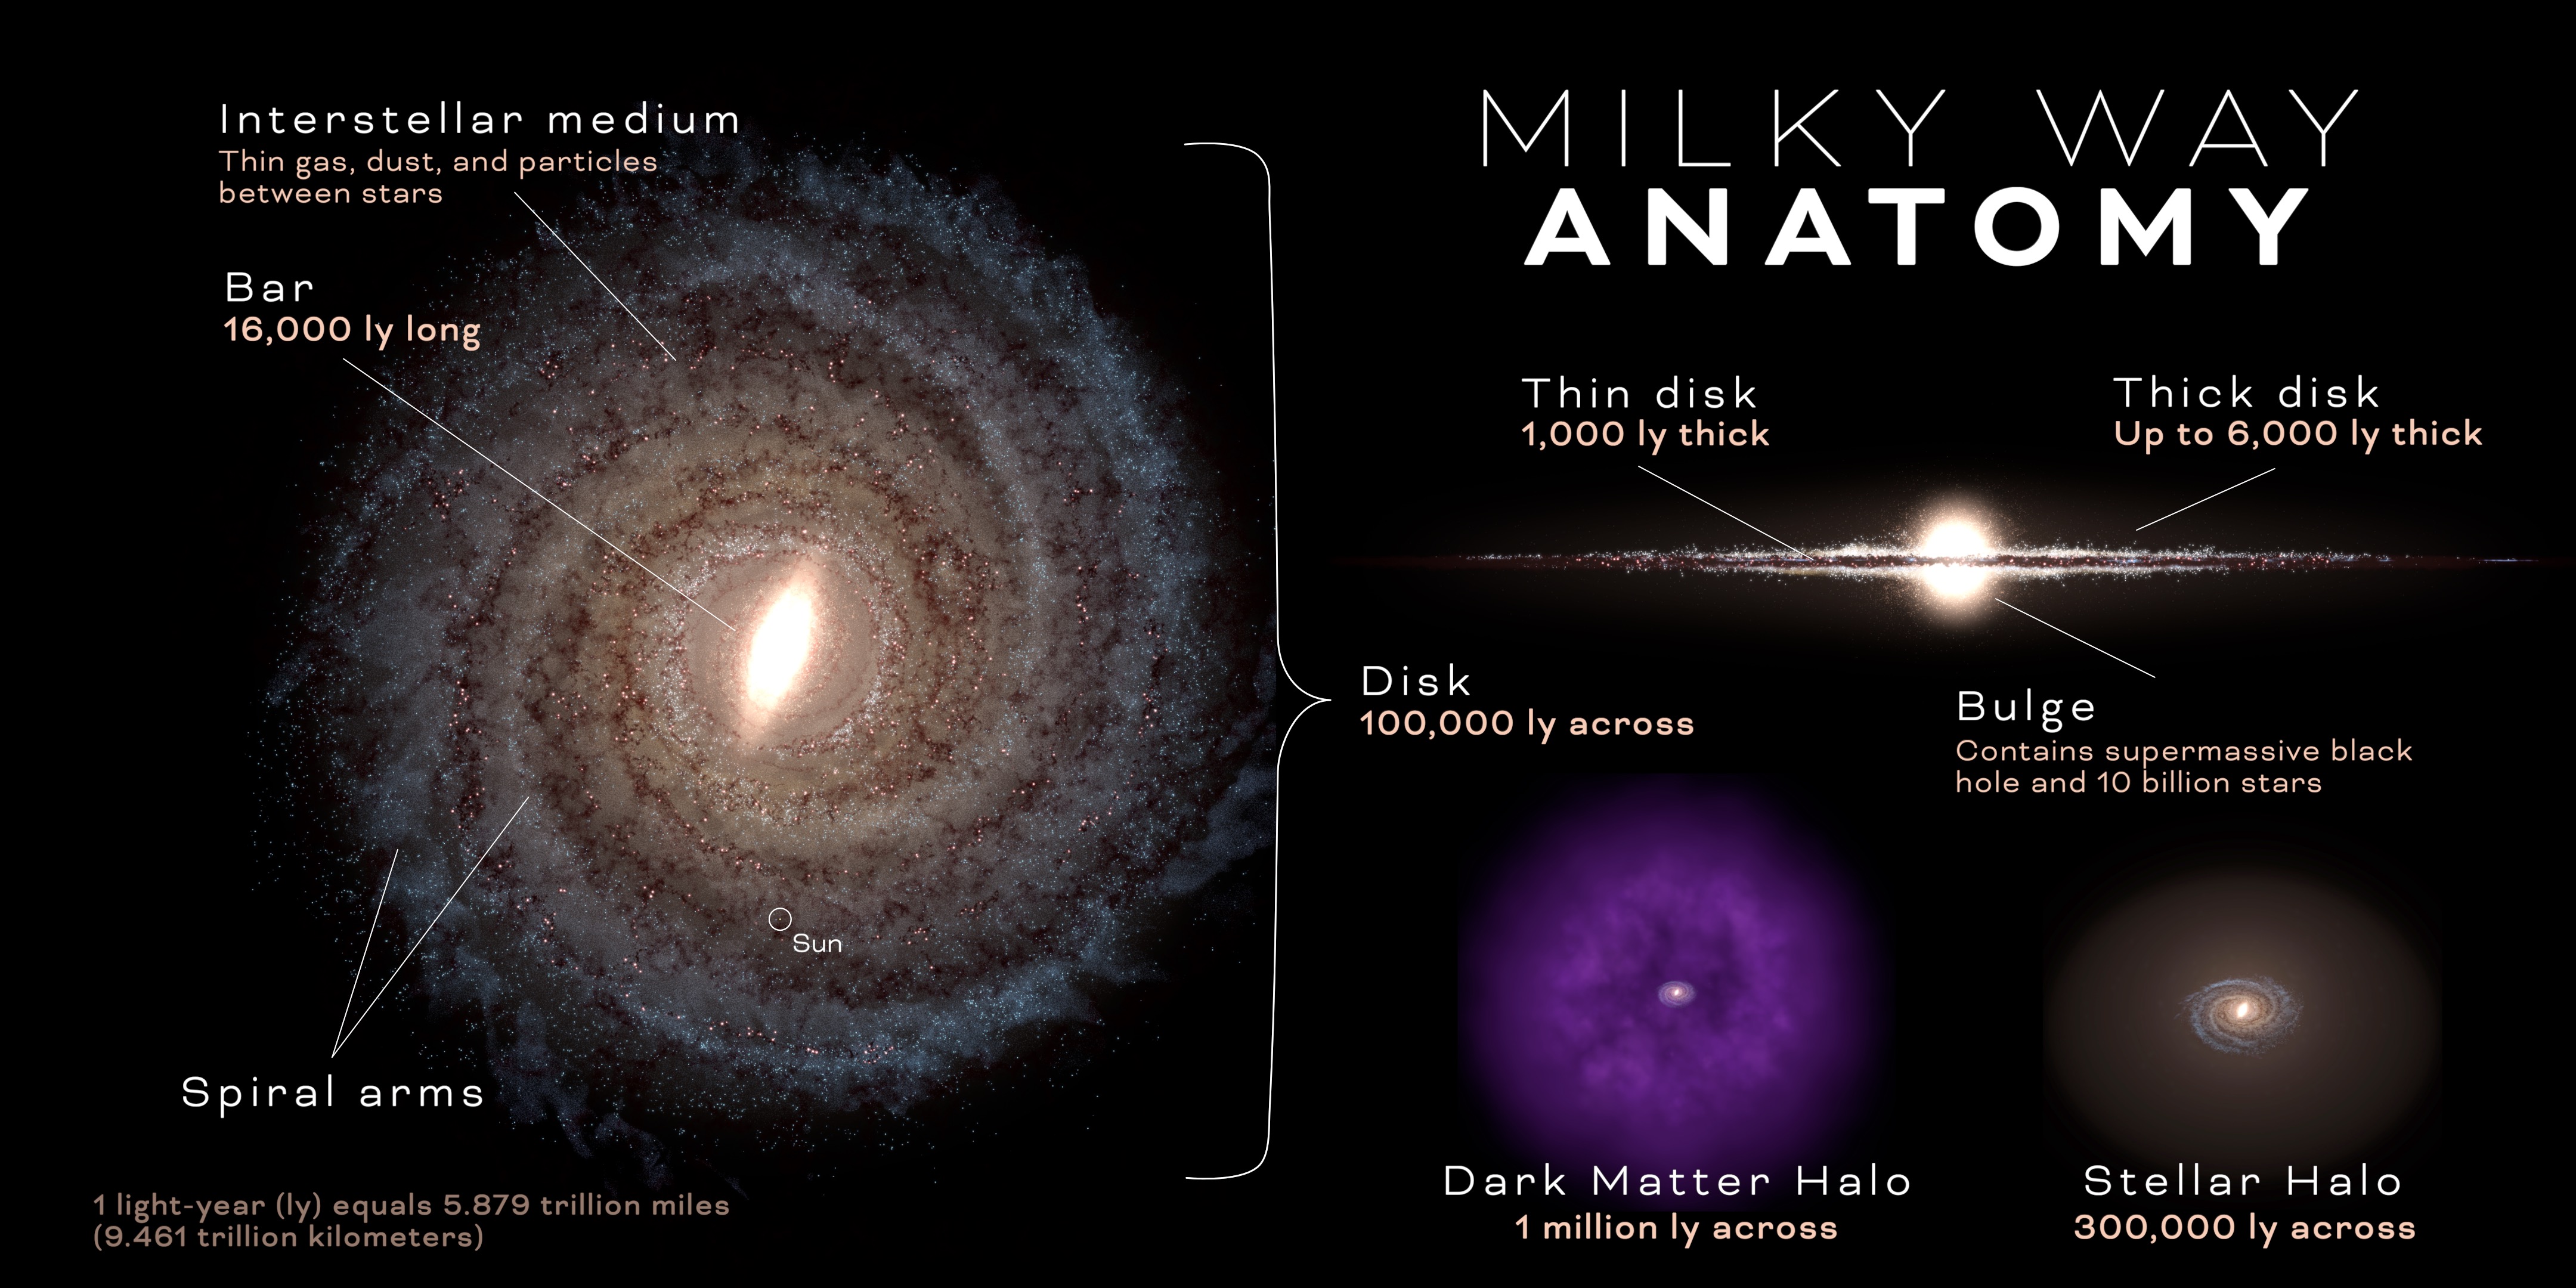
What to notice: The Milky Way has multiple components — disk, bulge, bar, spiral arms, halo, dark matter halo, and central black hole. We infer this structure by combining star counts, gas maps, dust corrections, and stellar motions from inside the disk.
This figure is useful, but it can also mislead if we read it as a static object. A labeled galaxy diagram can make the Milky Way look like a machine with fixed parts: disk, bulge, bar, spiral arms, halo. A better reading is that these are components of an evolving system. The disk contains gas and young stars. The bulge and halo contain older stellar populations. The spiral arms are not rigid material arms like the blades of a fan; they are patterns where gas and stars respond to gravity. The dark matter halo does not shine, but it matters because it contributes most of the galaxy’s gravitating mass.
We should also be honest about the challenge: the Milky Way is partly hidden from us by its own dust. Optical light cannot pass cleanly through the Galactic plane. That means visible-light maps alone are incomplete. To map a galaxy from the inside, we need wavelengths that reveal components optical light misses.
Why is the Milky Way both our best-studied galaxy and one of the hardest galaxies to map cleanly?
It is best-studied because we can measure individual stars, gas clouds, and motions from inside it. It is hard to map because we are embedded in its dusty disk, so optical light gives an incomplete view of the full structure.
Part 3: Different Wavelengths Reveal Different Ingredients
In Module 1, we learned that light is information. Here that idea becomes practical. A galaxy looks different at different wavelengths because different physical components emit, absorb, or scatter different kinds of light.
Radio observations are especially powerful for mapping cold neutral hydrogen. Hydrogen is the most abundant element in the universe, and neutral hydrogen emits a famous radio line at a wavelength of 21 cm. That line passes through much of the dust that blocks visible light, letting astronomers map gas across the Milky Way.
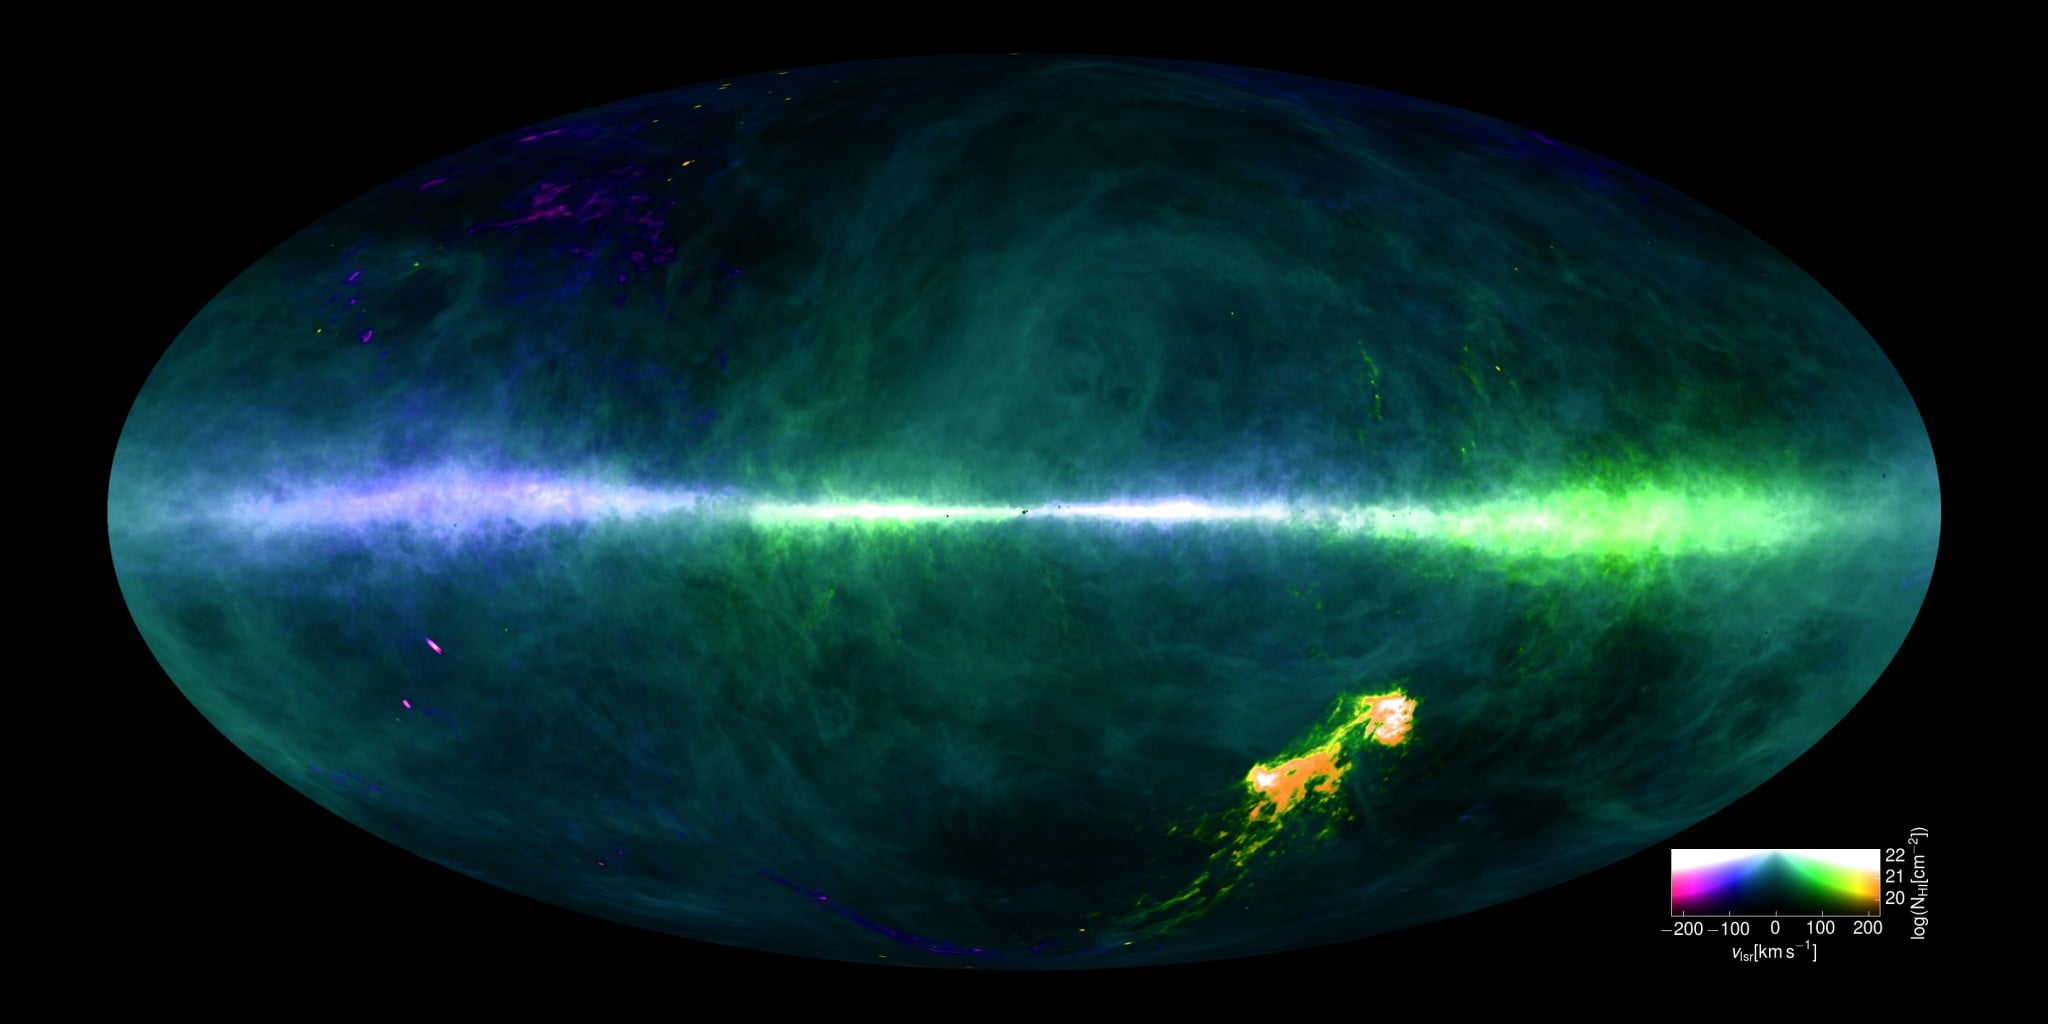
What to notice: Radio maps of neutral hydrogen trace gas across the whole Milky Way, including regions hidden by dust in visible light. A wavelength can be a mapmaking tool. (Credit: HI4PI Collaboration)
The key inference is not simply “radio sees gas.” The deeper point is that a wavelength can be a physical filter. If you choose the right wavelength, you can isolate a component of the galaxy that would otherwise be hidden. Radio gives one kind of map. Infrared gives another. X-rays give another. Each map is partial; together they become a model.
The Galactic center is the perfect example. In visible light, dust makes the center of the Milky Way difficult to see. In infrared, stars behind the dust become visible. In X-rays and other high-energy bands, hot gas and energetic processes stand out. The same region becomes several different physical stories, depending on the wavelength we use to ask the question.
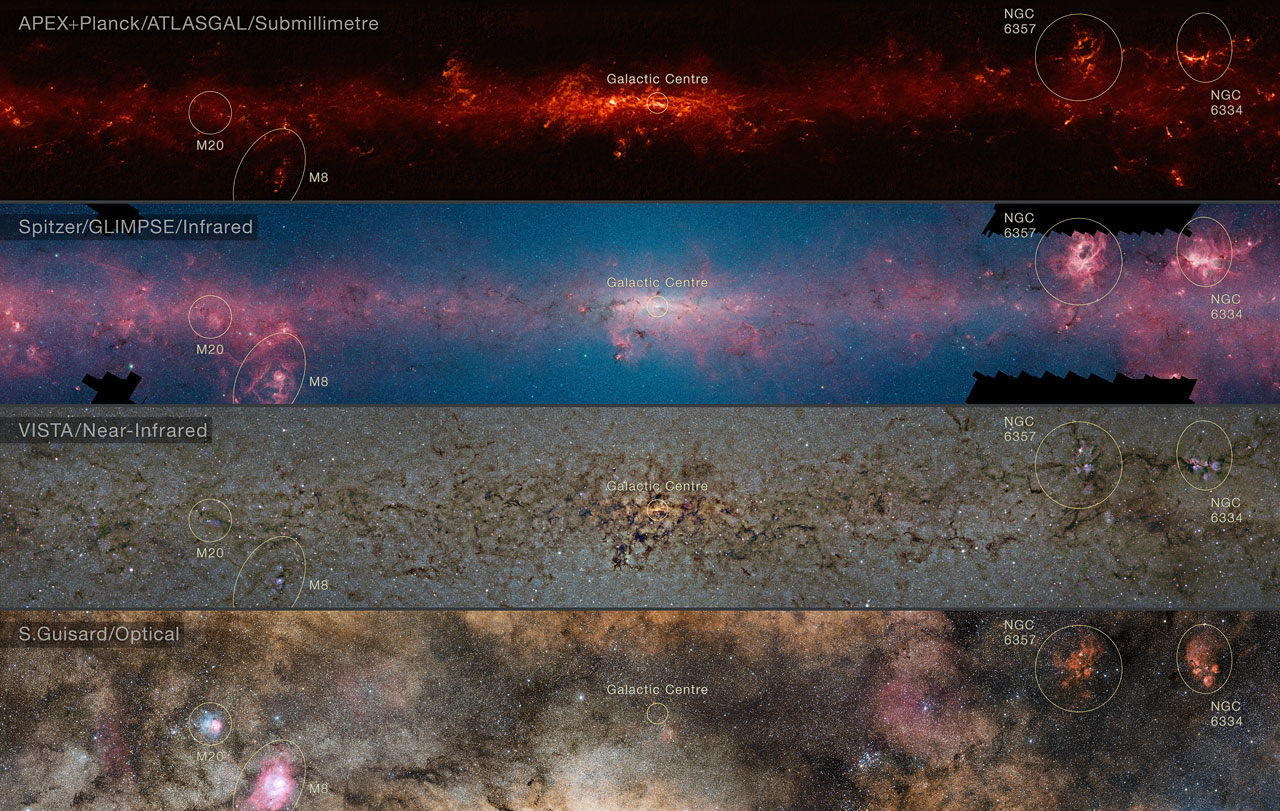
What to notice: The Galactic center changes with wavelength because each band selects different physics: cool dust and stars in infrared, hot plasma in X-rays, and gas structures at longer wavelengths. (Credit: ESO/NASA/JPL-Caltech/ESA)
Nearby galaxies let us connect the inside-out Milky Way view to a more external perspective. Andromeda is close enough that we can study structure across its disk, but far enough that we can see the disk as a galaxy. It is a bridge between “our galaxy from the inside” and “galaxies as a population.”
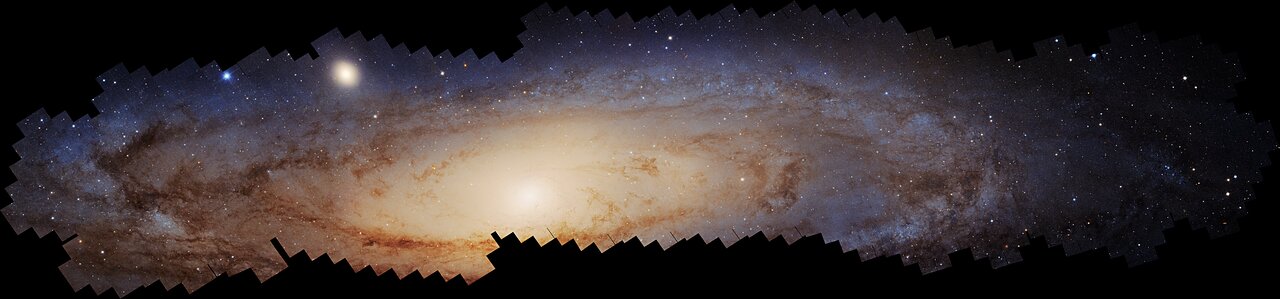
What to notice: Andromeda is close enough for Hubble to resolve structure across its disk. Nearby galaxies let us connect individual stars and gas structures to galaxy-scale history. (Credit: NASA/ESA/Hubble)
Why is a radio map of neutral hydrogen not just a lower-resolution version of an optical image?
Because it is mapping a different physical component. Optical light is mostly starlight plus emission or absorption from gas and dust. A 21-cm radio map traces neutral hydrogen gas directly, including gas hidden behind dust or extending beyond the bright stellar disk.
Part 4: Star Formation Is a Local Failure of Support
Stars form when part of a gas cloud becomes dense and cold enough for gravity to win locally. That sentence is short, but it contains the central physics. Gas has pressure, turbulence, magnetic fields, and radiation acting against collapse. Gravity has to overcome those forms of support. Cooling helps because cooler gas has lower thermal pressure. Higher density helps because gravity becomes more effective when more mass is packed into a smaller region.
One compact way to express gravity’s clock is the dynamical timescale:
\[ \tau_\text{dyn} \sim \frac{1}{\sqrt{G\bar{\rho}}} \tag{1}\]
What it predicts
Given mean density \(\bar{\rho}\), it predicts the timescale for gravitational rearrangement.
What it depends on
Scales as \(\tau_\text{dyn} \propto \bar{\rho}^{-1/2}\). Denser objects respond faster.
What it’s saying
If pressure support were removed, gravity would rearrange or collapse a self-gravitating object in roughly this time. The Sun’s dynamical time is ~50 minutes.
Assumptions
- Uniform density approximation (order-of-magnitude estimate)
- Free-fall timescale — actual collapse is modified by pressure response
See: the equation
Here \(\tau_{\text{dyn}}\) is an order-of-magnitude collapse or rearrangement time, \(G\) is the gravitational constant, and \(\bar{\rho}\) is the average density of the region. The equation says that denser regions have shorter gravitational response times. It is not a promise that every dense clump will form stars, because pressure, turbulence, magnetic fields, radiation, and feedback can slow or stop collapse. It is a way to read the competition: density helps gravity act faster.
In cgs units, \(G\) has units of \(\mathrm{cm^3\,g^{-1}\,s^{-2}}\) and density has units of \(\mathrm{g\,cm^{-3}}\):
\[ G\bar{\rho} \sim \left(\mathrm{cm^3\,g^{-1}\,s^{-2}}\right) \left(\mathrm{g\,cm^{-3}}\right) = \mathrm{s^{-2}} \]
Taking the square root gives \(\mathrm{s^{-1}}\), so \(1/\sqrt{G\bar{\rho}}\) has units of seconds. The equation really does predict a timescale.
This is why star formation is not spread smoothly through a galaxy. It is concentrated in clouds, filaments, shells, and clumps. The interstellar medium — the gas and dust between stars — is structured. It is not an empty background.
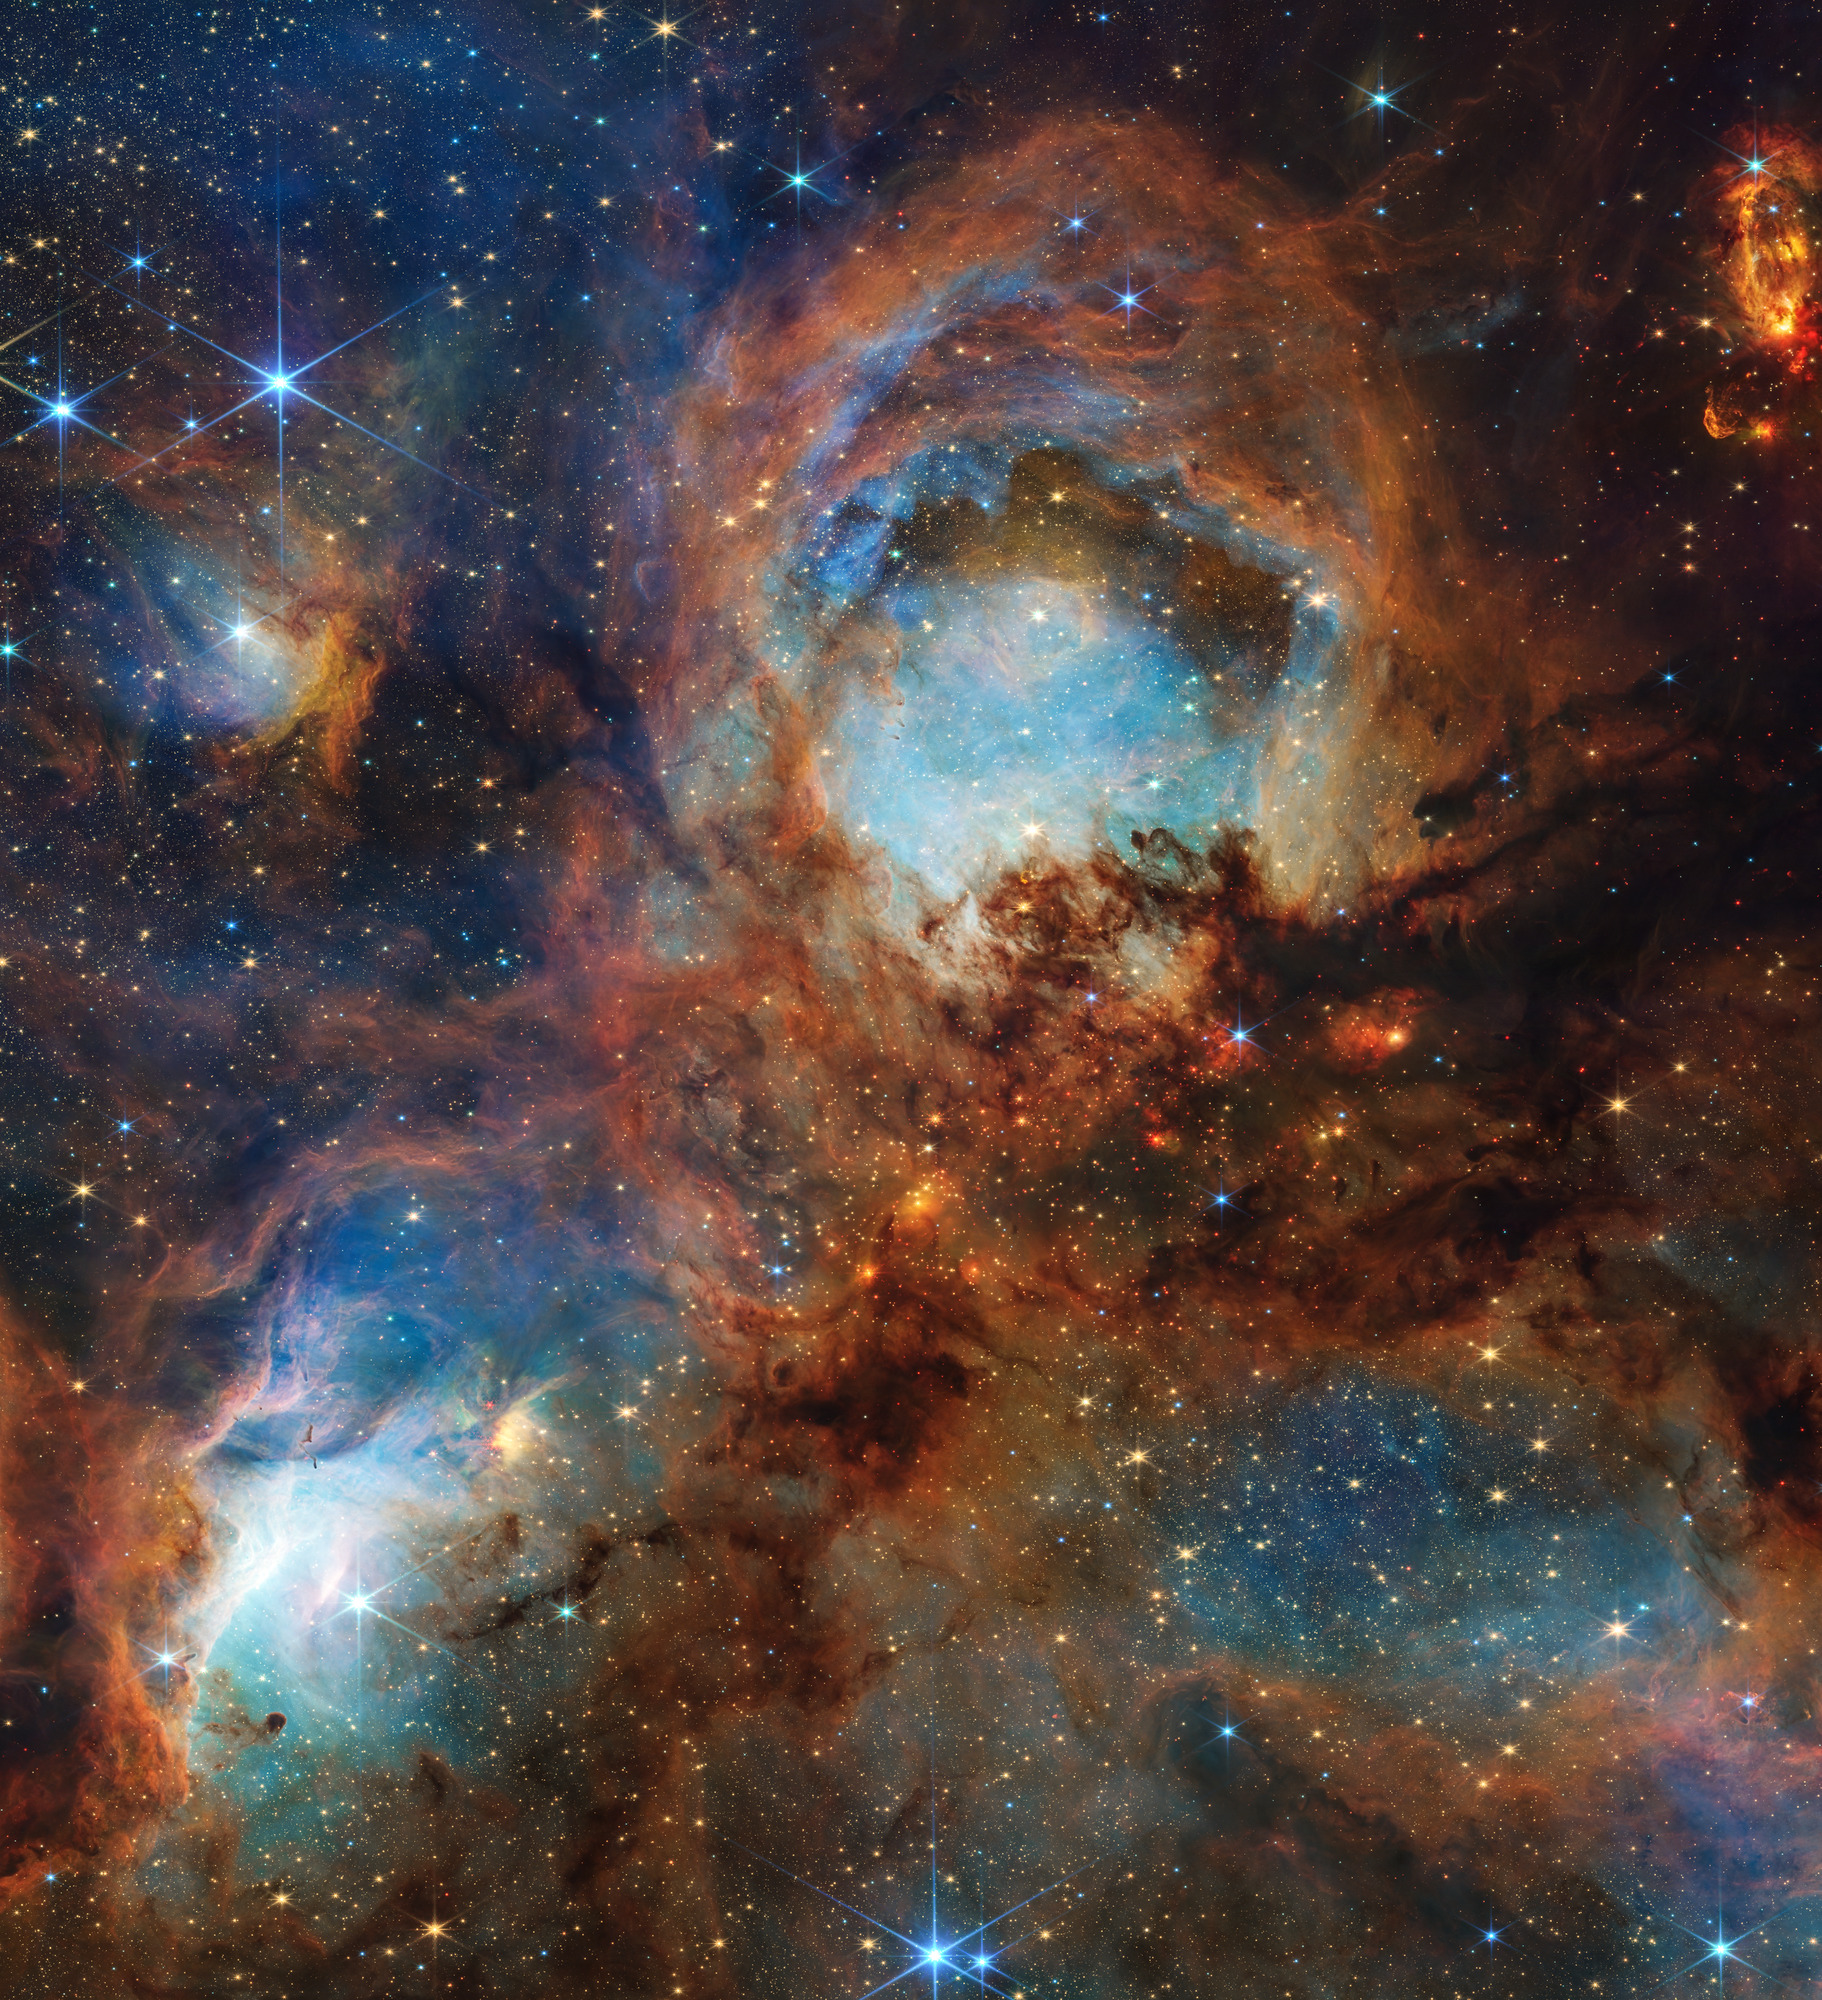
What to notice: Star formation happens inside structured gas and dust, not in empty space. Infrared light reveals embedded young stars and heated dust that visible light can miss. (Credit: NASA/ESA/CSA/STScI)
Infrared images of star-forming regions are especially revealing because young stars are often born inside dusty clouds. Visible light from those stars may be blocked or scattered, while infrared light can escape more easily. When we see embedded infrared sources, glowing dust, and sculpted cavities, we are seeing the early stages of the baryon cycle: gas collecting, collapsing, forming stars, and being reshaped by the stars it just made.
The word baryon means ordinary matter made mostly of protons and neutrons: gas, stars, planets, dust, and people. In galaxy evolution, the baryon cycle is the movement of ordinary matter through different phases. Gas can cool into molecular clouds. Molecular clouds can form stars. Stars return mass through winds and supernovae. Some gas is heated, some is expelled, some cools again, and some gets locked into long-lived stars and remnants.
That cycle connects Module 3 directly to Module 4. A massive star does not only live and die for itself. Its radiation, winds, and supernova enrich the surrounding gas with heavy elements and inject energy into the galaxy. A galaxy’s future star formation depends partly on what its previous stars have done.
Which change would make gravity act faster in the dynamical-timescale estimate?
If a cloud is bright in infrared but partly hidden in visible light, what does that suggest about the material around young stars?
It suggests that young stars are embedded in dusty gas. Dust blocks or scatters much of the visible light, while infrared light can escape more easily and can also trace warm dust heated by young stars.
Part 5: Interactions Rearrange the Fuel
Galaxies are not isolated islands. They tug on one another through gravity. When galaxies pass near each other or merge, their stars mostly pass by without colliding because stars are tiny compared with the spaces between them. Gas behaves differently. Gas can shock, compress, cool, and flow. That makes interactions especially important for star formation.
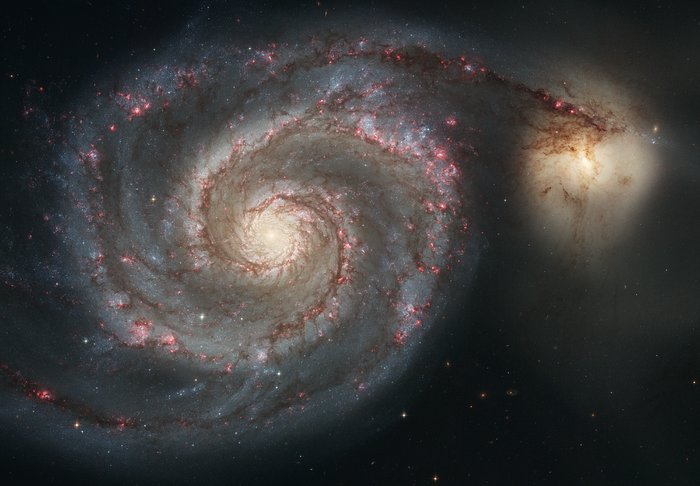
What to notice: Interactions can reshape spiral structure and trigger star formation. The Whirlpool Galaxy’s companion is not just nearby; it is part of the system’s dynamical story. (Credit: NASA/ESA/Hubble)
The Whirlpool Galaxy shows this idea in a form you can see. Its spiral pattern is not just a pretty shape. The companion galaxy is part of the gravitational story. Tidal interactions can pull out streams, reshape disks, and compress gas in ways that alter where stars form.
The Antennae galaxies show a more dramatic case. Two galaxies in the middle of a merger contain enormous reservoirs of gas and dust. Where gas is compressed, star formation can surge. This is why mergers can produce starbursts: short-lived episodes where the star-formation rate is much higher than usual.
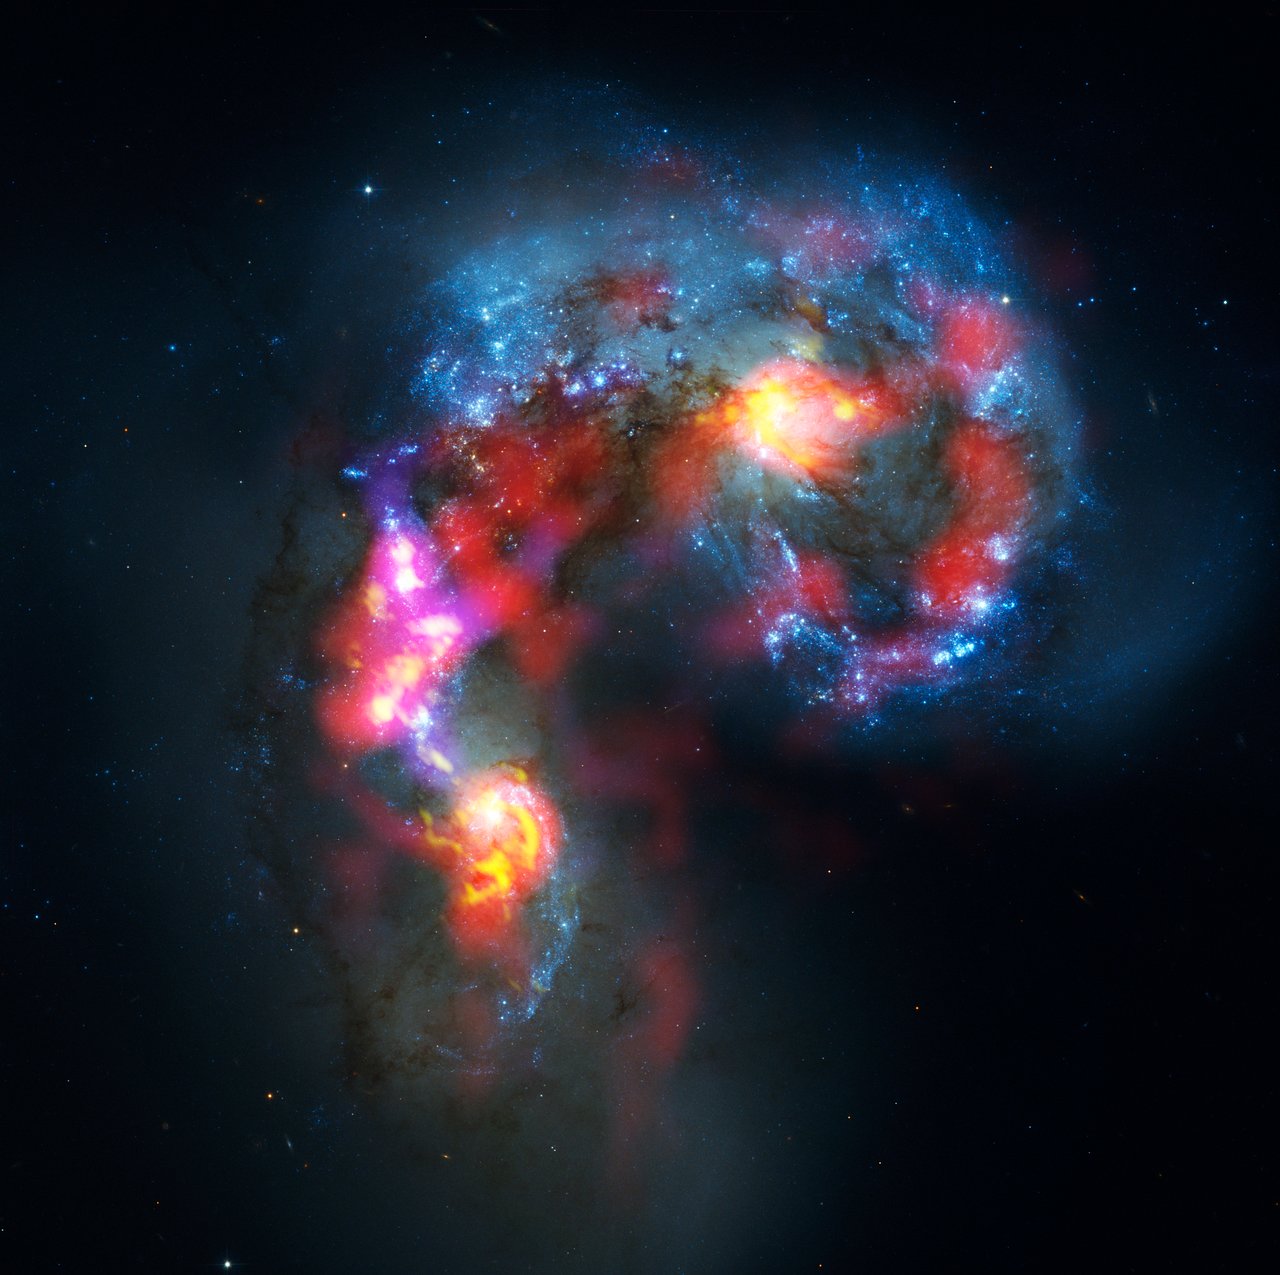
What to notice: Galaxy interactions rearrange gas. The Antennae galaxies show how mergers can compress molecular gas and trigger intense star formation. (Credit: ALMA/ESO/NAOJ/NRAO/NASA/ESA/Hubble)
Multiwavelength observations matter here because stars and gas do not always occupy the same places. A visible-light image emphasizes stars and dust lanes. Millimeter and radio observations can trace molecular gas — the dense cold material out of which stars form. If we want to know where future stars may form, we need to find the fuel, not just the stars that already exist.
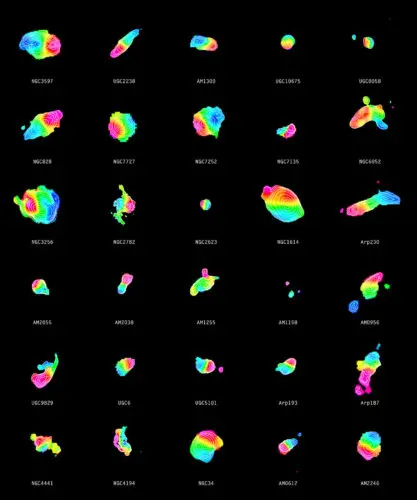
What to notice: Molecular gas is the raw material for star formation. Comparing many merging galaxies shows where gravity has concentrated that fuel.
Why can a galaxy interaction trigger star formation even though individual stars almost never collide?
Because the gas is extended and collisional in a way stars are not. During an interaction, gravity can compress gas, drive gas flows, and create shocks. Dense compressed gas is more likely to cool and collapse into stars.
Part 6: Feedback Makes the Ecosystem Self-Regulating
Star formation does not simply continue forever once it begins. Young massive stars produce ultraviolet radiation, powerful winds, and supernova explosions. These processes inject energy and momentum into surrounding gas. Sometimes that feedback compresses nearby gas and helps trigger more star formation. Sometimes it heats or expels gas and suppresses star formation. Both outcomes can happen in the same galaxy.
M82 is a vivid example of feedback on galaxy scales. Its central starburst drives material out of the disk in a wind. That outflow carries gas, dust, and heavy elements away from the regions where they formed.
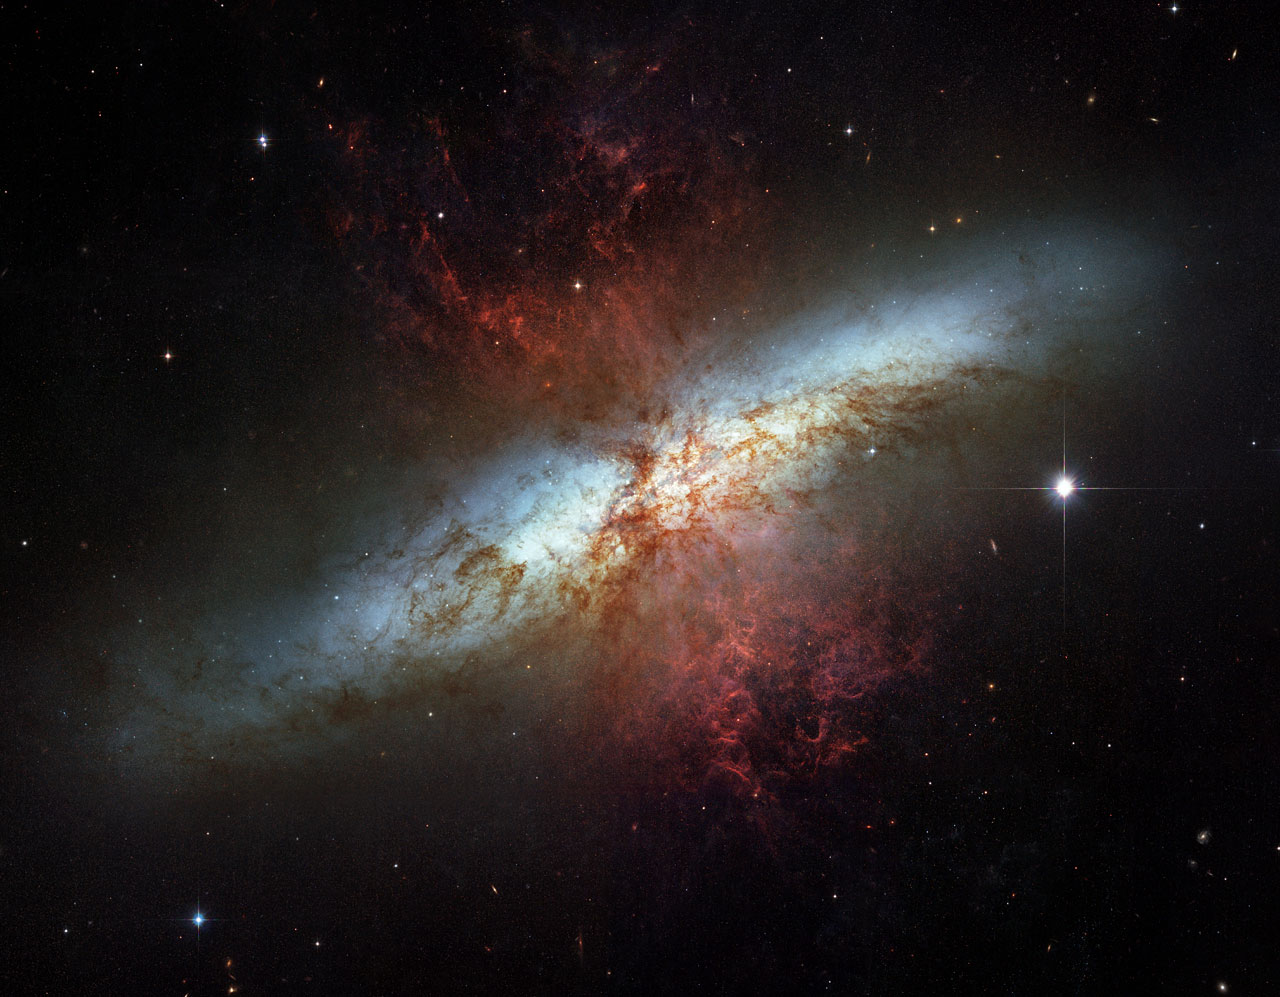
What to notice: Feedback can drive material out of a galaxy. In M82, intense star formation powers an outflow that carries gas, metals, and energy away from the disk. (Credit: NASA/ESA/Hubble)
This is the moment where the ecosystem metaphor earns its keep. A forest is not just trees. It includes soil, water, climate, fire, decay, and regrowth. A galaxy is not just stars. It includes gas reservoirs, dust, radiation fields, gravity, shocks, outflows, accretion, and recycling. Feedback is one of the processes that keeps the system from being a one-way collapse of gas into stars.
The classification schemes we use for galaxies are therefore only the first layer of explanation. A tuning fork diagram can help us describe what we see, but a galaxy’s physical story requires us to ask about gas supply, stellar populations, environment, and history.
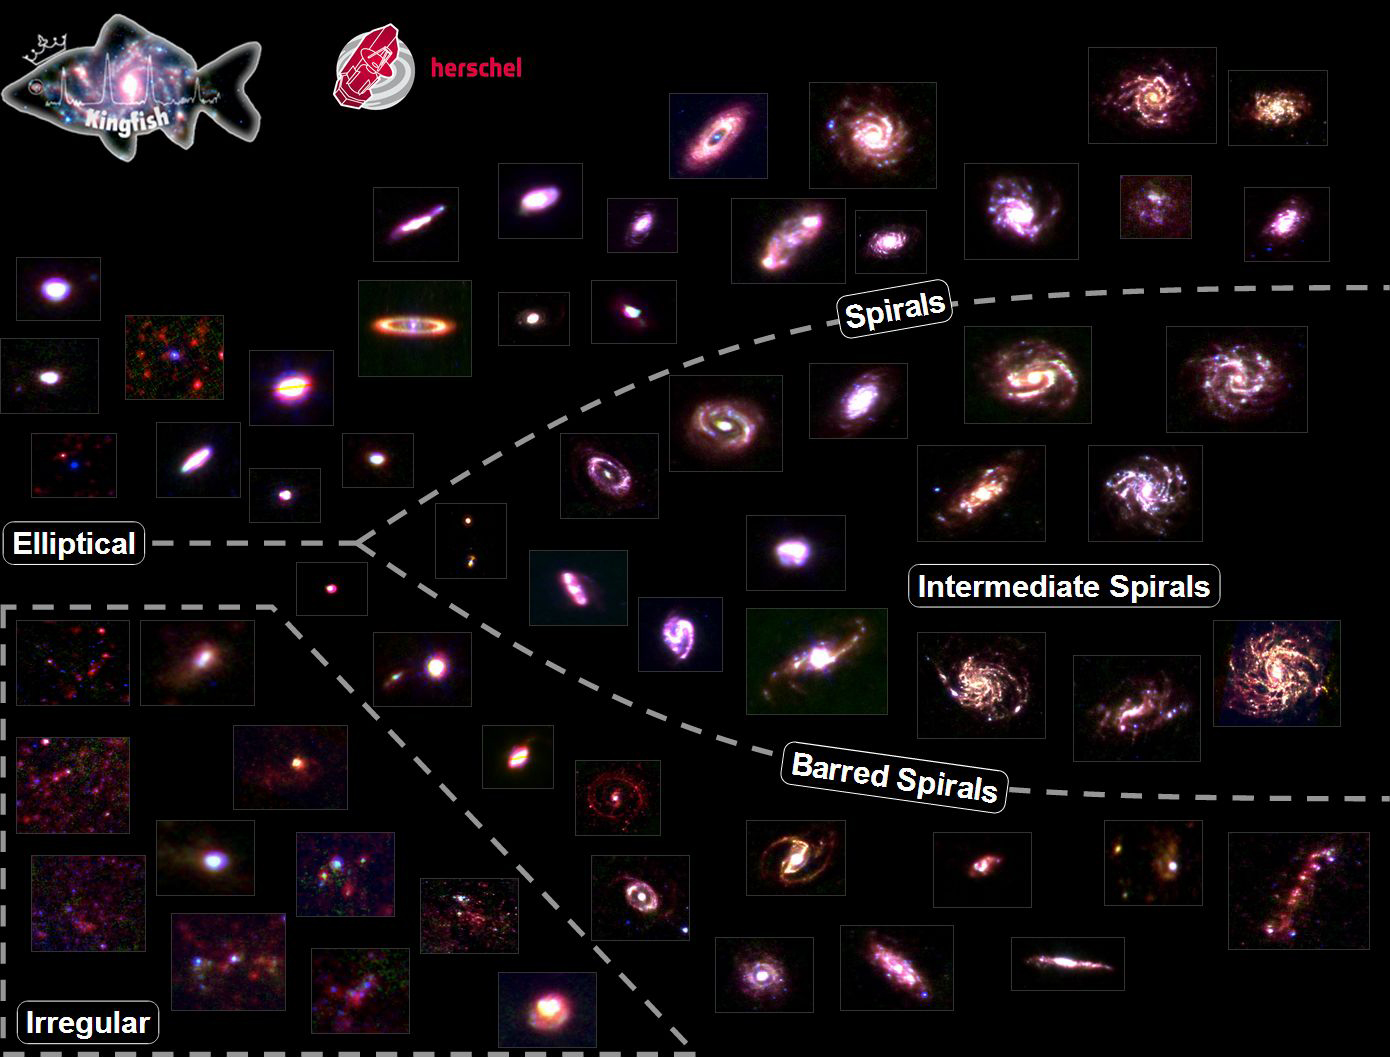
What to notice: Galaxy morphology is an observational classification, not an explanation by itself. Shapes point us toward histories involving gas content, star formation, rotation, and mergers.
The Hubble tuning fork is a classification diagram, not a time sequence. It organizes galaxies by appearance, but it does not say that ellipticals naturally turn into spirals or that spirals slide along the diagram into ellipticals. To infer evolution, we need physical evidence: gas supply, star-formation rate, stellar populations, environment, feedback, and interaction history.
Why is feedback not simply “stars stopping star formation”?
Feedback can suppress star formation by heating or expelling gas, but it can also compress nearby gas and help trigger collapse. The effect depends on the local environment, timing, and how much gas is available.
Part 7: The Universe Has a Star-Formation History
If we zoom out from individual galaxies to the whole observable universe, we find that star formation itself has a history. The universe did not form stars at a constant rate. The global star-formation rate rose, peaked billions of years ago, and then declined toward the present.
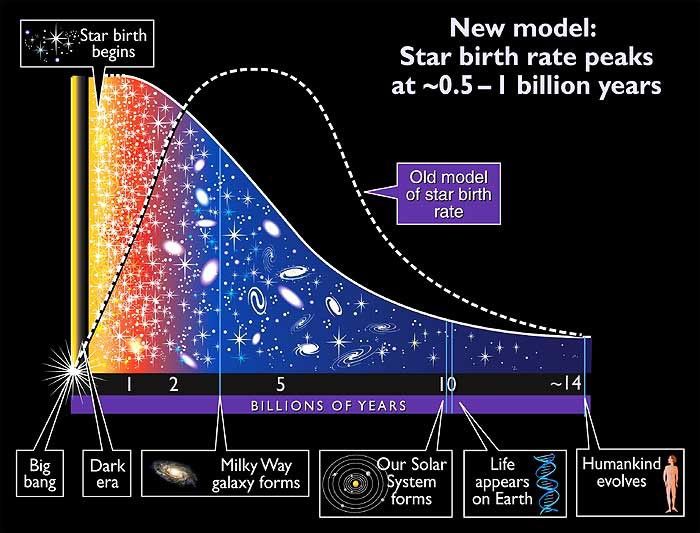
What to notice: The universe did not form stars at a constant rate. Star formation rose to a peak billions of years ago and then declined toward the present. (Credit: NASA)
This trend is one of the cleanest ways to end the first reading. It tells us that galaxies evolve, and they evolve together with the universe around them. Early galaxies had more gas available for rapid star formation. Over time, gas was consumed, heated, expelled, locked into long-lived stars, or rearranged by environment. The cosmic star-formation history is the population-level version of the baryon cycle.
If the cosmic star-formation rate was higher in the past than it is today, what does that suggest about the average gas supply and galaxy conditions at earlier cosmic times?
It suggests that earlier galaxies, on average, had more available cold gas or more conditions that drove gas into star-forming regions. Over time, gas can be consumed, heated, expelled, or locked into long-lived stars and remnants.
This sets up the next reading. If galaxies are ecosystems, then the next question is: what organizes the ecosystem? The answer is gravity. Gravity collects gas, binds galaxies, drives mergers, shapes clusters, and reveals dark matter through motion. In the next reading, we will use dynamics to weigh what light cannot show.
Practice Problems
Use these values and ideas unless a problem states otherwise:
- Star-forming regions are usually traced by young blue stars, ionized gas, infrared dust emission, and cold gas reservoirs.
- Neutral hydrogen is commonly mapped with the 21-cm radio line.
- The dynamical timescale scales as \(\tau_{\text{dyn}} \sim 1/\sqrt{G\bar{\rho}}\).
- A galaxy’s appearance is an observable clue, not a complete history by itself.
Conceptual
- ⭐ Reading a galaxy image as evidence. A galaxy is blue, patchy, and crossed by dust lanes.
- What observables are you using?
- What model connects those observables to the galaxy’s gas and stellar populations?
- What can you infer about recent star formation?
- ⭐ The tuning fork trap. A student says, “The Hubble tuning fork shows ellipticals evolving into spirals.”
- What is wrong with that statement?
- What does the tuning fork actually organize?
- What additional evidence would you need to make an evolutionary claim?
- ⭐⭐ Multiwavelength galaxies. Explain why optical, infrared, and radio images of the same galaxy can look different without any of them being “wrong.”
Calculation
- ⭐⭐ Density and the gravity clock. Two gas clouds have average densities \(\bar{\rho}_A\) and \(\bar{\rho}_B = 100\bar{\rho}_A\).
- Use \(\tau_{\text{dyn}} \sim 1/\sqrt{G\bar{\rho}}\) to find \(\tau_B/\tau_A\).
- Which cloud responds to gravity faster?
- Explain why this does not guarantee that every dense cloud forms stars.
- ⭐ Gas consumption as a first estimate. A galaxy contains \(5 \times 10^9\,M_\odot\) of cold gas and forms stars at \(2\,M_\odot\,\mathrm{yr^{-1}}\).
- Estimate the gas consumption time if no gas enters or leaves.
- Is that estimate a complete model of galaxy evolution?
- Name two processes that could make the real history different.
Synthesis
- ⭐⭐ Merger evidence. You observe a galaxy pair with tidal tails, compressed dust lanes, bright infrared emission, and many blue star clusters.
- Identify two direct observables.
- Build an observe → model → infer chain for why the interaction may be triggering star formation.
- Explain why the stars themselves mostly do not collide.
- ⭐⭐ Feedback is not one-way. In 3–5 sentences, explain why stellar feedback can both suppress and trigger star formation. Your answer should mention gas heating or expulsion and gas compression.
- ⭐⭐⭐ The baryon cycle as a story. Write a short paragraph following one parcel of gas through the baryon cycle: cold gas, star formation, stellar feedback, enrichment, and possible recycling into later star formation.
Glossary
Baryon cycle: The movement of ordinary matter through gas, stars, dust, remnants, outflows, inflows, and later generations of star formation.
Cold gas: Gas with low enough thermal pressure that gravity can more easily compress it into dense star-forming regions.
Dust: Tiny solid grains in interstellar space that absorb, scatter, and re-emit light, especially important for interpreting optical and infrared observations.
Feedback: Energy and momentum returned to surrounding gas by stars, supernovae, stellar winds, radiation, or accreting black holes.
Galaxy morphology: The observed shape or structure of a galaxy, such as spiral, elliptical, irregular, or peculiar.
Interstellar medium: The gas and dust between stars inside a galaxy.
Metal enrichment: The process by which stars and stellar explosions add elements heavier than helium to the surrounding gas.
Neutral hydrogen: Hydrogen atoms that are not ionized. Neutral hydrogen can be mapped using the 21-cm radio line.
Starburst: A short-lived episode in which a galaxy forms stars much faster than its long-term average rate.
Tidal interaction: Gravitational distortion caused by a close passage or merger between galaxies.
Summary
Galaxies are evolving systems, not static collections of stars. We observe them through many wavelength windows because each window reveals a different ingredient: stars, dust, neutral gas, molecular gas, hot plasma, and energetic feedback. By modeling how gas cools, collapses, forms stars, and is reshaped by stellar feedback, we can infer galaxy histories from present-day observations. The same stars we studied in Module 3 now become agents of galaxy evolution.
Choose one figure from this reading. In one sentence each, write:
- What is directly observed?
- What model translates the observation?
- What physical history can we infer?