Lecture 2: The Dynamical Universe
Gravity turns motion into mass, halos, clusters, and the cosmic web
Learning Objectives
After completing this reading, you should be able to:
- Use orbital speed and radius to infer enclosed mass.
- Explain why Solar-System-like rotation is not what we observe in spiral galaxies.
- Interpret flat galaxy rotation curves as evidence for extended dark matter halos.
- Describe how S-star orbits reveal the supermassive black hole at the Galactic center.
- Explain why the Bullet Cluster and the cosmic web provide evidence beyond individual galaxy rotation curves.
Concept Throughline
Gravity is the universe’s scale. If something moves in an orbit, its motion tells us what mass is pulling on it. When the motion does not match the light, the universe is telling us that light is not the whole mass budget.
This reading is about dynamics: how motion reveals mass. You already know the core idea from binaries and orbits. In Module 2, binary stars let us measure stellar masses. In Module 3, gravity battled pressure inside stars. Now the same gravitational reasoning moves outward to galaxies, clusters, and the cosmic web.
The method is still observe → model → infer. We observe positions, velocities, redshifts, or lensing patterns. We model them with gravity. Then we infer masses, dark matter, compact objects, and the architecture of large-scale structure.

What to notice: The same reasoning pattern appears at every scale: identify an observable, choose the gravitational model that connects it to mass, and infer the mass distribution required by the data. (Credit: Course illustration (A. Rosen))
Track A (Core, ~30 min): Read Parts 1–6 in order, including the enclosed-mass equation, Quick Checks, and exit ticket. This gives you the gravitational inference chain for galaxies, black holes, clusters, and the cosmic web.
Track B (Full, ~40 min): Read everything in Track A, then pause at each figure and ask, “What motion, lensing, or spatial pattern is being used as the mass measurement?” This deeper pass is the best preparation for class discussion.
Both tracks cover the learning objectives. Track B adds more practice separating luminous matter from gravitating matter.
Part 1: The Milky Way Is Not Alone
Before we weigh a galaxy, we should place it in context. The Milky Way is one member of the Local Group, a gravitationally bound collection of galaxies that includes Andromeda, Triangulum, and many dwarf galaxies. This matters because galaxies are not isolated test particles in empty space. They live in environments, and gravity links those environments together.
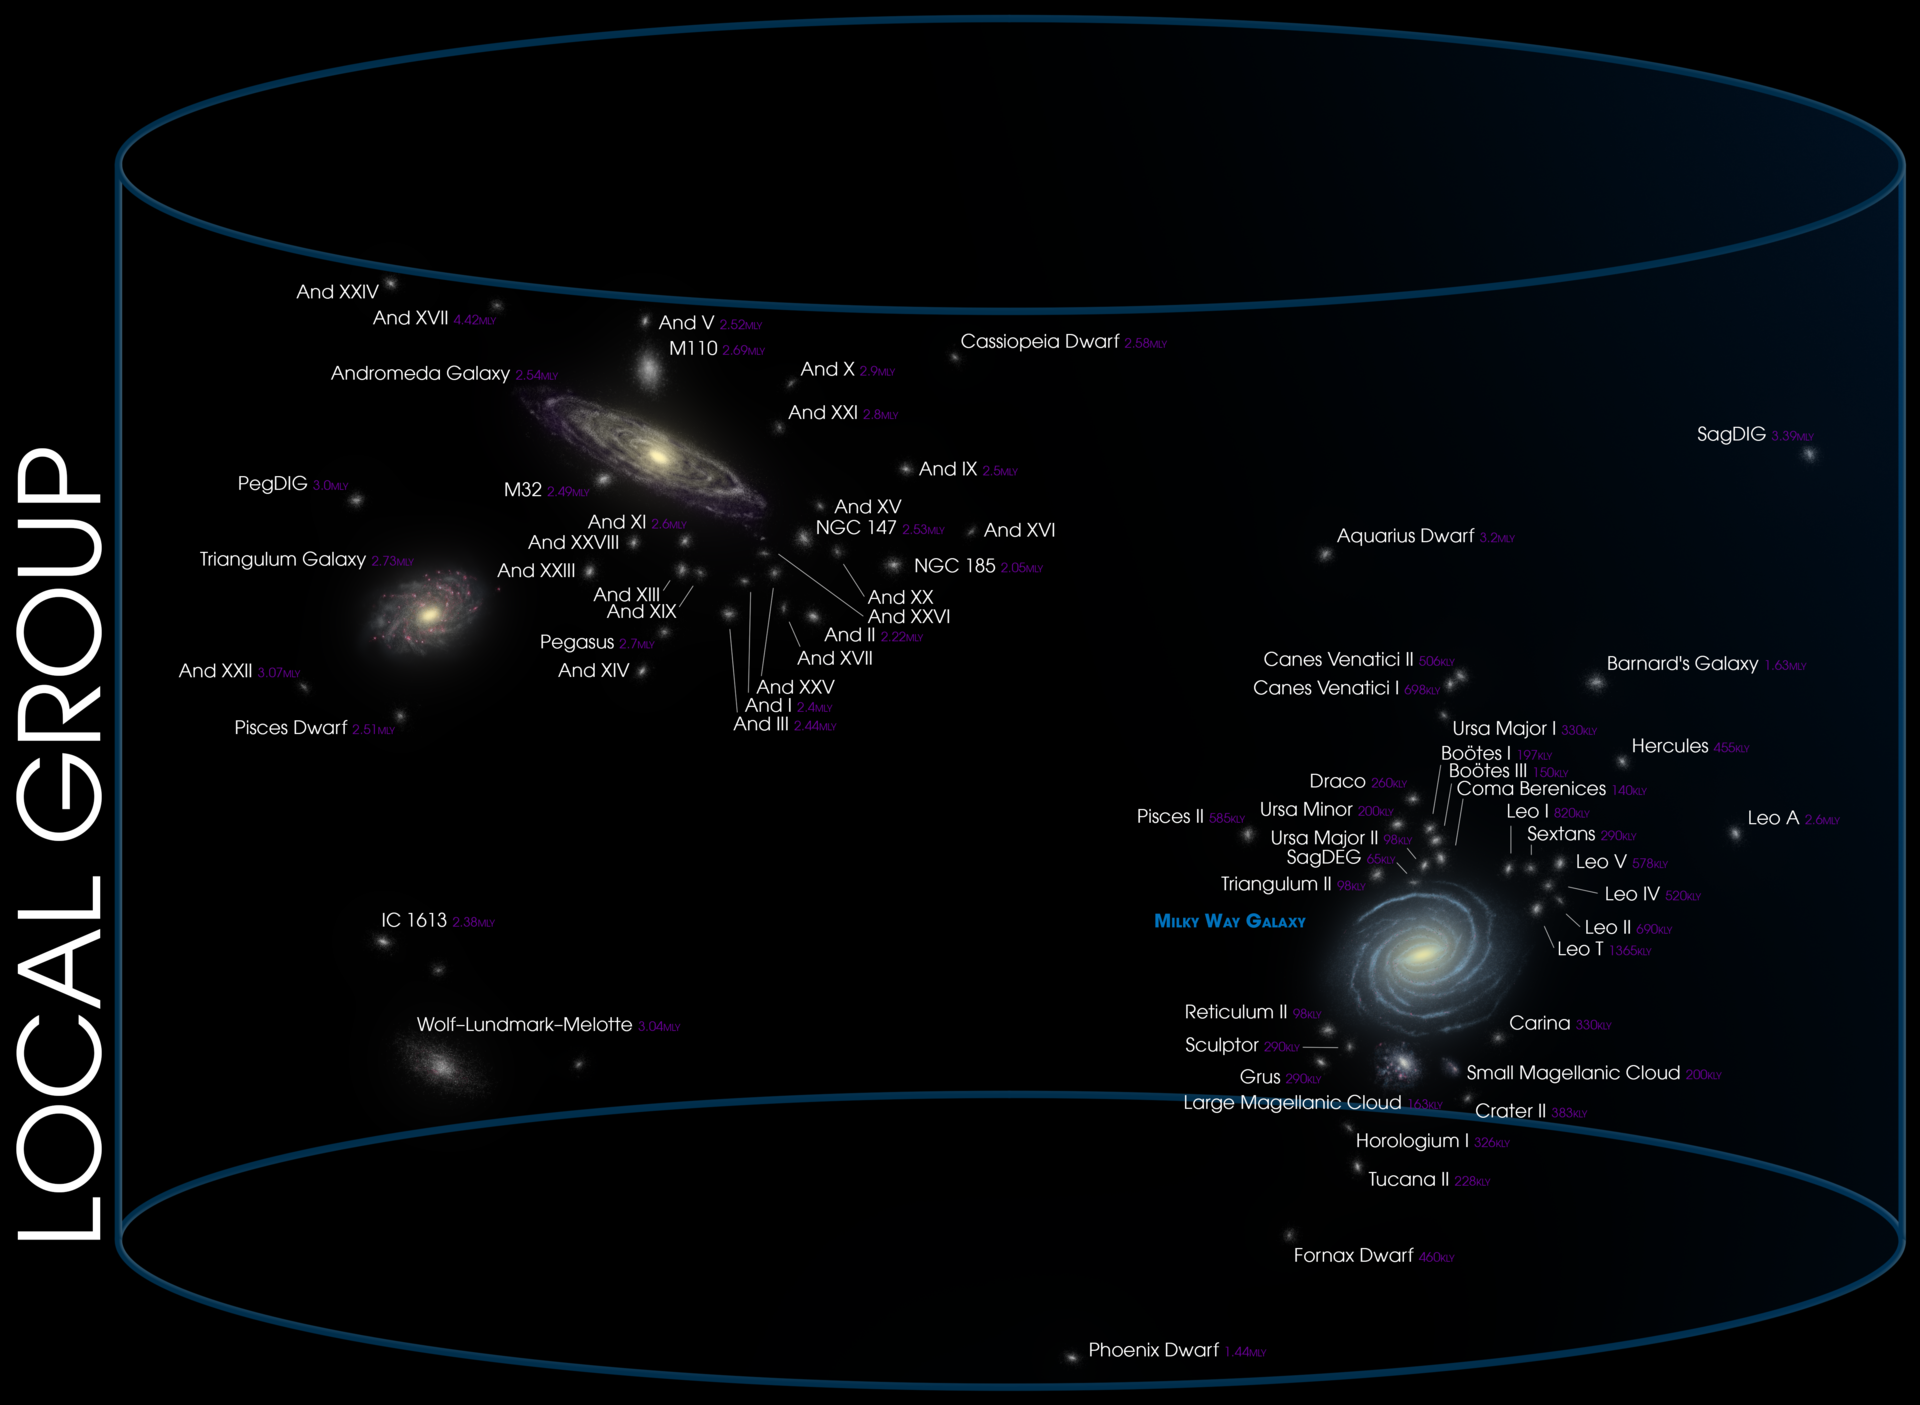
What to notice: The Milky Way is not isolated. It belongs to the Local Group, where gravity binds galaxies into a small cosmic neighborhood.
The Local Group is already a lesson in scale and hierarchy. The Milky Way and Andromeda dominate the visible stellar mass, but the group contains many smaller galaxies. Dwarf galaxies are easy to miss because they are faint, diffuse, and often low in surface brightness. Yet they are important: they trace the gravitational environment and help reveal how galaxies assemble over time.
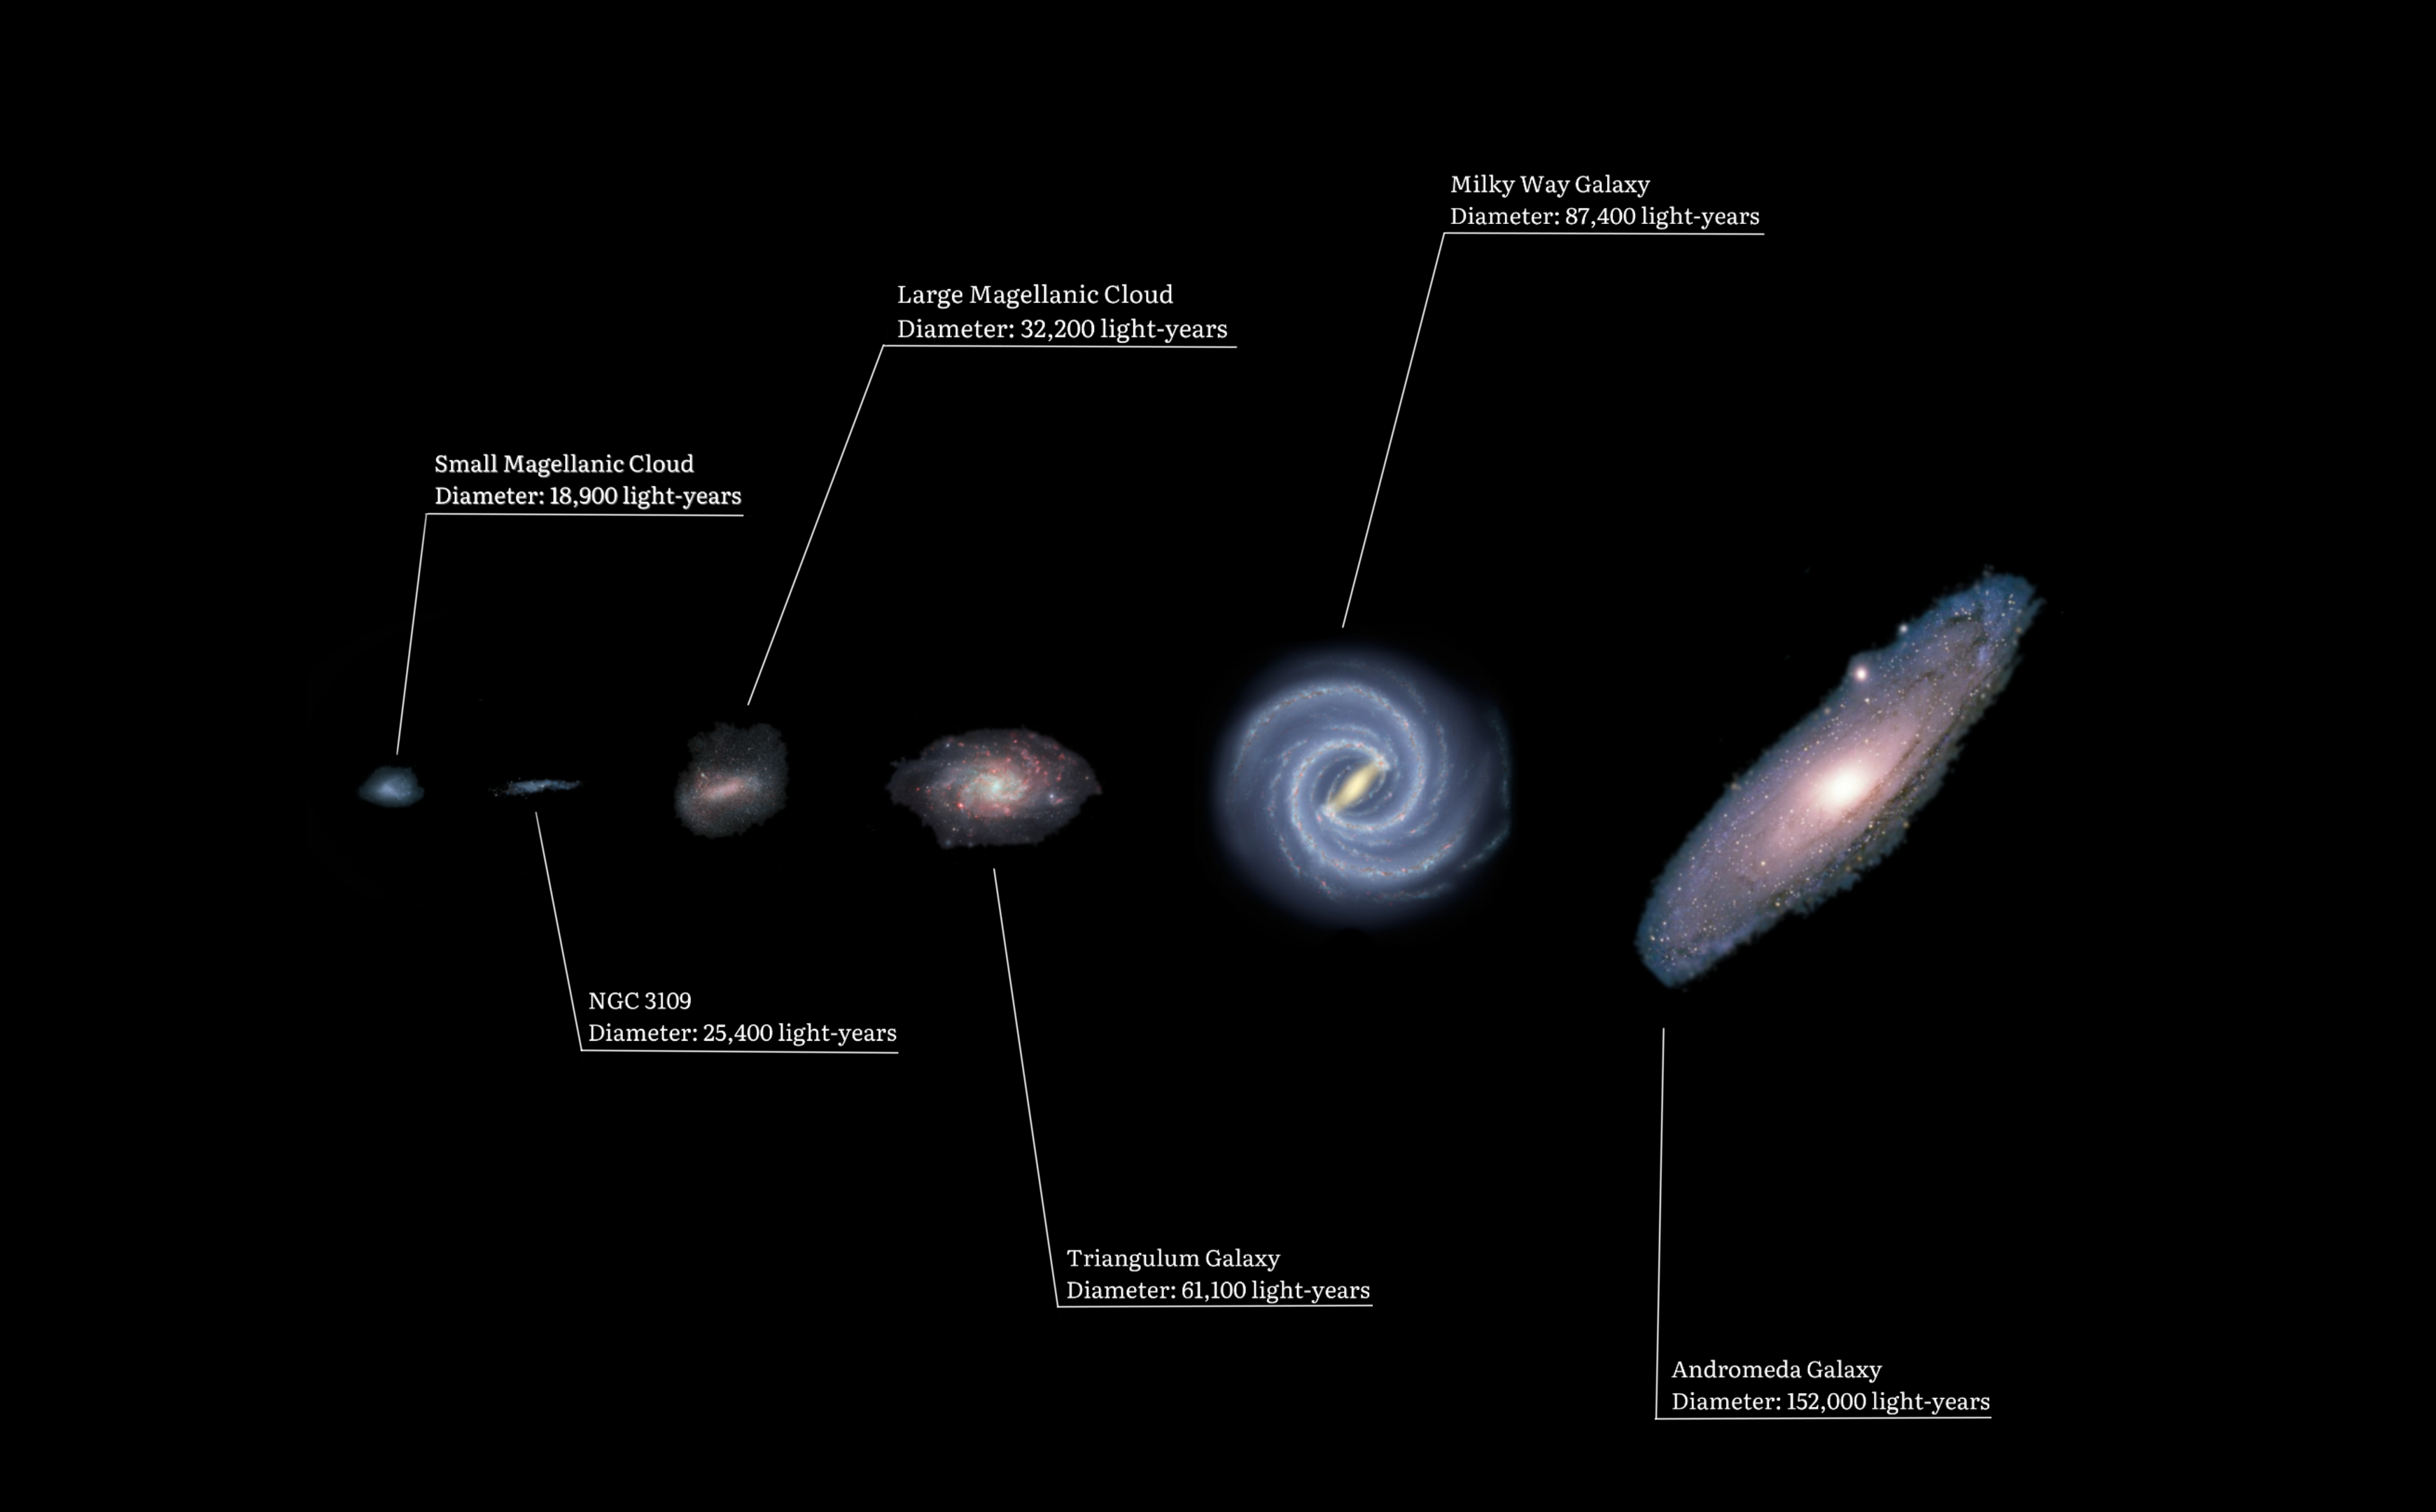
What to notice: Galaxy masses and sizes span a huge range even within the Local Group. The Milky Way and Andromeda dominate, while dwarf galaxies are numerous and faint.
The word “group” should remind you of something from earlier in the course: when objects are gravitationally bound, their motions carry information about mass. The Local Group is not expanding with the Hubble flow in the simple way distant galaxies do. Local gravity matters more than cosmic expansion here. That distinction will become important in the cosmology reading.
Why should we be careful about applying Hubble’s law to the Milky Way and Andromeda?
Because the Milky Way and Andromeda are in a gravitationally bound local system. Hubble expansion describes the large-scale average expansion of the universe, but nearby bound systems can have motions dominated by local gravity.
Part 2: Motion Weighs What Light Cannot Show
The central equation for this reading comes from circular motion. Imagine a small object orbiting at radius \(r\) with speed \(v\). If gravity is the force bending that motion into a circle, then the inward gravitational acceleration must match the inward acceleration required for circular motion.
For a roughly spherical mass distribution, the gravitational acceleration at radius \(r\) depends on the mass enclosed inside that radius:
\[ a_{\text{grav}} = \frac{G M(<r)}{r^2}. \]
The centripetal acceleration needed to keep an object moving in a circle is
\[ a_{\text{cent}} = \frac{v^2}{r}. \]
For a circular orbit supported by gravity, these accelerations are equal:
\[ a_{\text{grav}} = a_{\text{cent}}. \]
Substitute the two expressions:
\[ \frac{G M(<r)}{r^2} = \frac{v^2}{r}. \]
Now multiply both sides by \(r^2\):
\[ G M(<r) = r v^2. \]
Finally, divide both sides by \(G\):
\[ M(<r) = \frac{r v^2}{G} \tag{1}\]
What it predicts
Given circular speed \(v\) at radius \(r\), it predicts the mass \(M(<r)\) enclosed inside that orbit.
What it depends on
Scales as \(M(<r) \propto r v^2\). At fixed speed, enclosing larger radii requires more mass.
What it’s saying
Orbital motion weighs galaxies. If speeds stay high at large radius, the enclosed mass must keep increasing even where the visible light fades.
Assumptions
- Approximately circular orbit
- Gravity supplies the centripetal acceleration
- Spherical or effectively enclosed mass approximation; real galaxy disks need more detailed modeling
See: the equation
Let’s read this equation like a sentence. \(M(<r)\) is the mass enclosed inside radius \(r\). The speed \(v\) is the orbital speed at that radius, and \(G\) is the gravitational constant. The equation says that if you measure an orbital speed at some radius, you can infer how much mass must lie inside that orbit.
The scaling is the important part. The equality sign in \(M(<r) = r v^2/G\) belongs to the idealized circular-orbit model. The approximately-equal sign, \(\approx\), is what we should reach for when applying the model to real systems that are close to, but not exactly, ideal. The proportionality sign, \(\propto\), is for scaling arguments where we care about how one quantity changes when another changes.
For this equation,
\[ M(<r) \propto r v^2. \]
At fixed radius, increasing the speed increases the mass as \(v^2\). At fixed speed, increasing the radius increases the enclosed mass in proportion to \(r\). That one scaling statement is the key to galaxy rotation curves.

What to notice: The enclosed-mass equation comes from an acceleration balance. Gravity supplies the inward acceleration needed for circular motion, and solving that balance gives \(M(<r)=rv^2/G\). (Credit: Course illustration (A. Rosen))
This equation is cleanest when the orbit is approximately circular, gravity supplies the inward acceleration, and the mass distribution is spherical enough that the enclosed-mass approximation is useful.
Real galaxy disks are not spherical, and detailed models separate disks, bulges, gas, and halos. The equation is still powerful because it captures the essential inference: fast motion at large radius requires substantial gravitating mass at large radius.
The right side has units:
\[ \frac{r v^2}{G} \sim \frac{\mathrm{cm}\,(\mathrm{cm^2\,s^{-2}})} {\mathrm{cm^3\,g^{-1}\,s^{-2}}} = \mathrm{g} \]
The result has units of mass, so the equation passes the dimensional check.
Now apply the same idea to the center of the Milky Way. Near the Galactic center, astronomers track individual stars orbiting an invisible compact object. These are the S-stars. Their orbits are small, fast, and curved around a common focus.
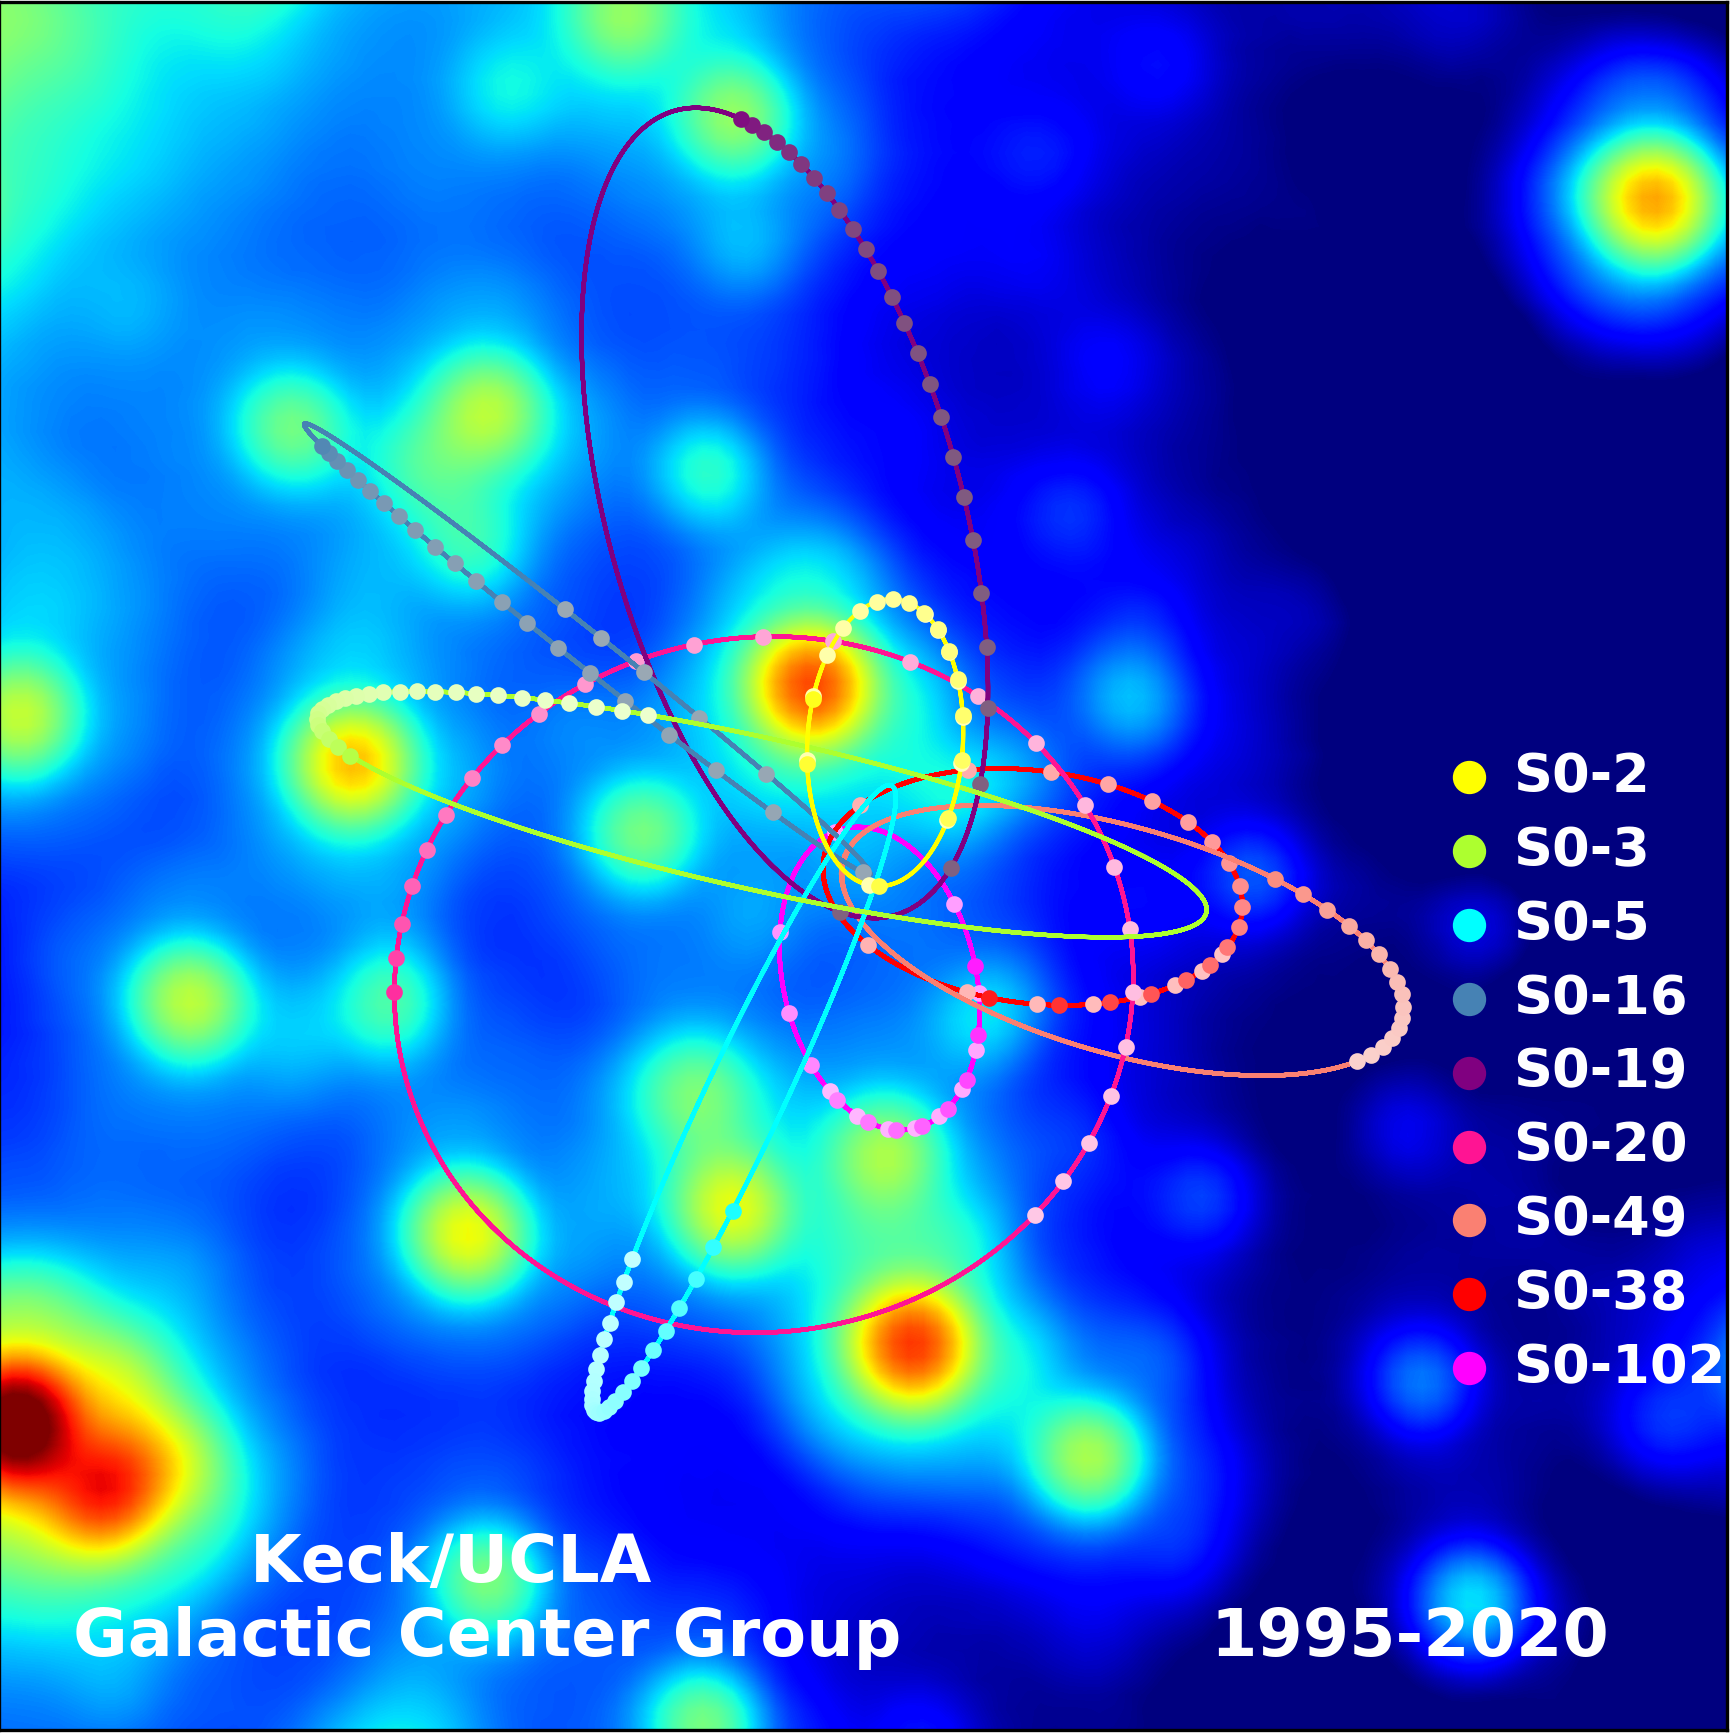
What to notice: Stars orbiting the Galactic center act like test particles. Their small, fast orbits require a compact mass of about four million solar masses: Sagittarius A*.
The observation is motion. The model is gravity. The inference is mass. The S-star orbits require about four million solar masses packed into a region far smaller than a normal star cluster could occupy stably. That compact mass is Sagittarius A*, the Milky Way’s central supermassive black hole.
The simple circular-speed equation is not how the final S-star mass is measured. Real S-star orbits are elliptical, and the best fits use the full orbital shape, timing, and, for the closest stars, relativistic corrections. The transferable idea is the gravitational principle: faster motion close to a common focus requires a large compact enclosed mass.
The Event Horizon Telescope gives a different kind of evidence. It does not replace the orbital argument; it complements it by imaging plasma near the event-horizon scale.
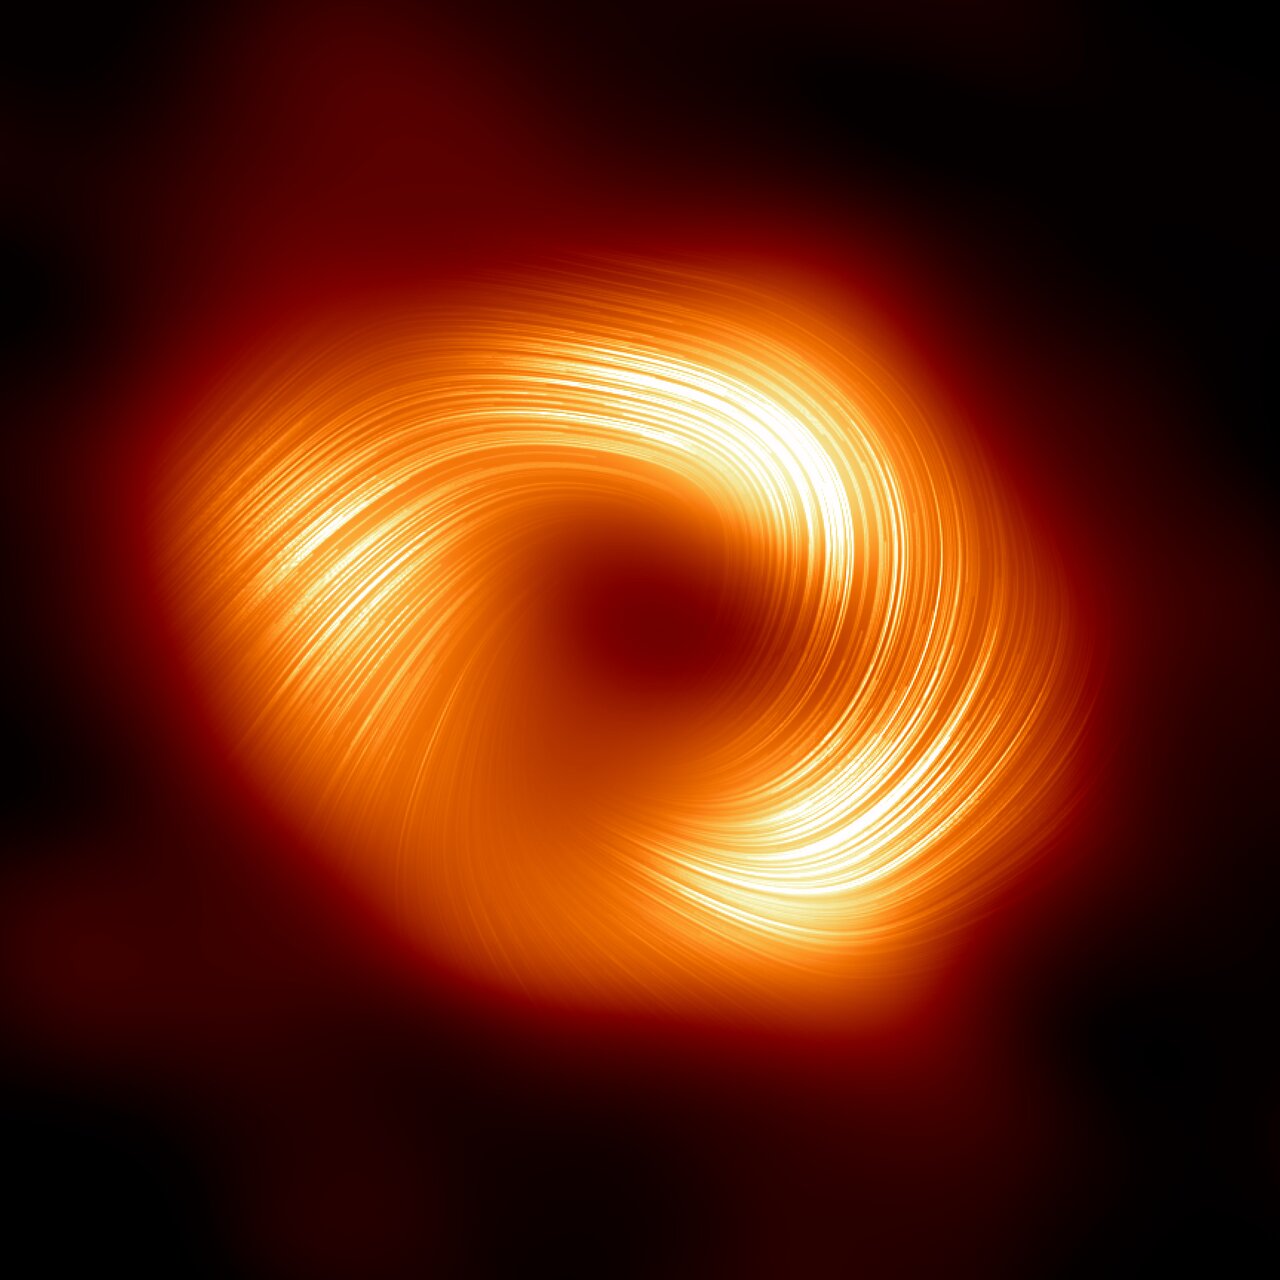
What to notice: The Event Horizon Telescope image of Sgr A* traces emission near the event-horizon scale. The object inferred from stellar orbits is also visible through horizon-scale plasma. (Credit: EHT Collaboration)
This is a good example of how astronomy builds confidence. One observation rarely carries the whole story. Stellar orbits, radio emission, infrared observations, and horizon-scale imaging all point toward the same physical model: a supermassive black hole at the center of the Milky Way.
What is the observable in the S-star argument, and what is the inference?
The observable is the motion of stars orbiting near the Galactic center. The model is gravity, and the inference is that a very large mass must be packed into a very small region: Sagittarius A*, the Milky Way’s central supermassive black hole.
Part 3: The Rotation-Curve Surprise
Now move from the central black hole to the entire disk of a galaxy. The Solar System gives us a useful expectation. Nearly all of the Solar System’s mass is in the Sun. As you move outward from the Sun, the enclosed mass barely changes. The orbital speed therefore decreases with distance.
You can see that directly from the same equation. Start with
\[ M(<r) = \frac{r v^2}{G}. \]
Solve for \(v^2\):
\[ v^2 = \frac{G M(<r)}{r}. \]
For the Solar System outside the Sun, the enclosed mass is approximately constant:
\[ M(<r) \approx M_\odot. \]
That means
\[ v^2 \propto \frac{1}{r}, \]
so
\[ v \propto r^{-1/2}. \]
In a central-mass system, larger-radius orbits move more slowly.

What to notice: In a central-mass system like the Solar System, orbital speed falls with distance. This is the prediction that fails for the outer parts of spiral galaxies. (Credit: Course illustration (A. Rosen))
That falling curve is what we would expect if most of a galaxy’s mass were concentrated where most of its light is. Spiral galaxies have bright stellar disks. If the visible disk contained most of the mass, then stars and gas far from the center should orbit more slowly, much like outer planets orbit the Sun more slowly than inner planets.

What to notice: A central mass gives falling speeds, visible matter alone cannot sustain high outer speeds, and adding an extended halo produces the approximately flat outer rotation curve we observe. (Credit: Course illustration (A. Rosen))
But that is not what we observe.
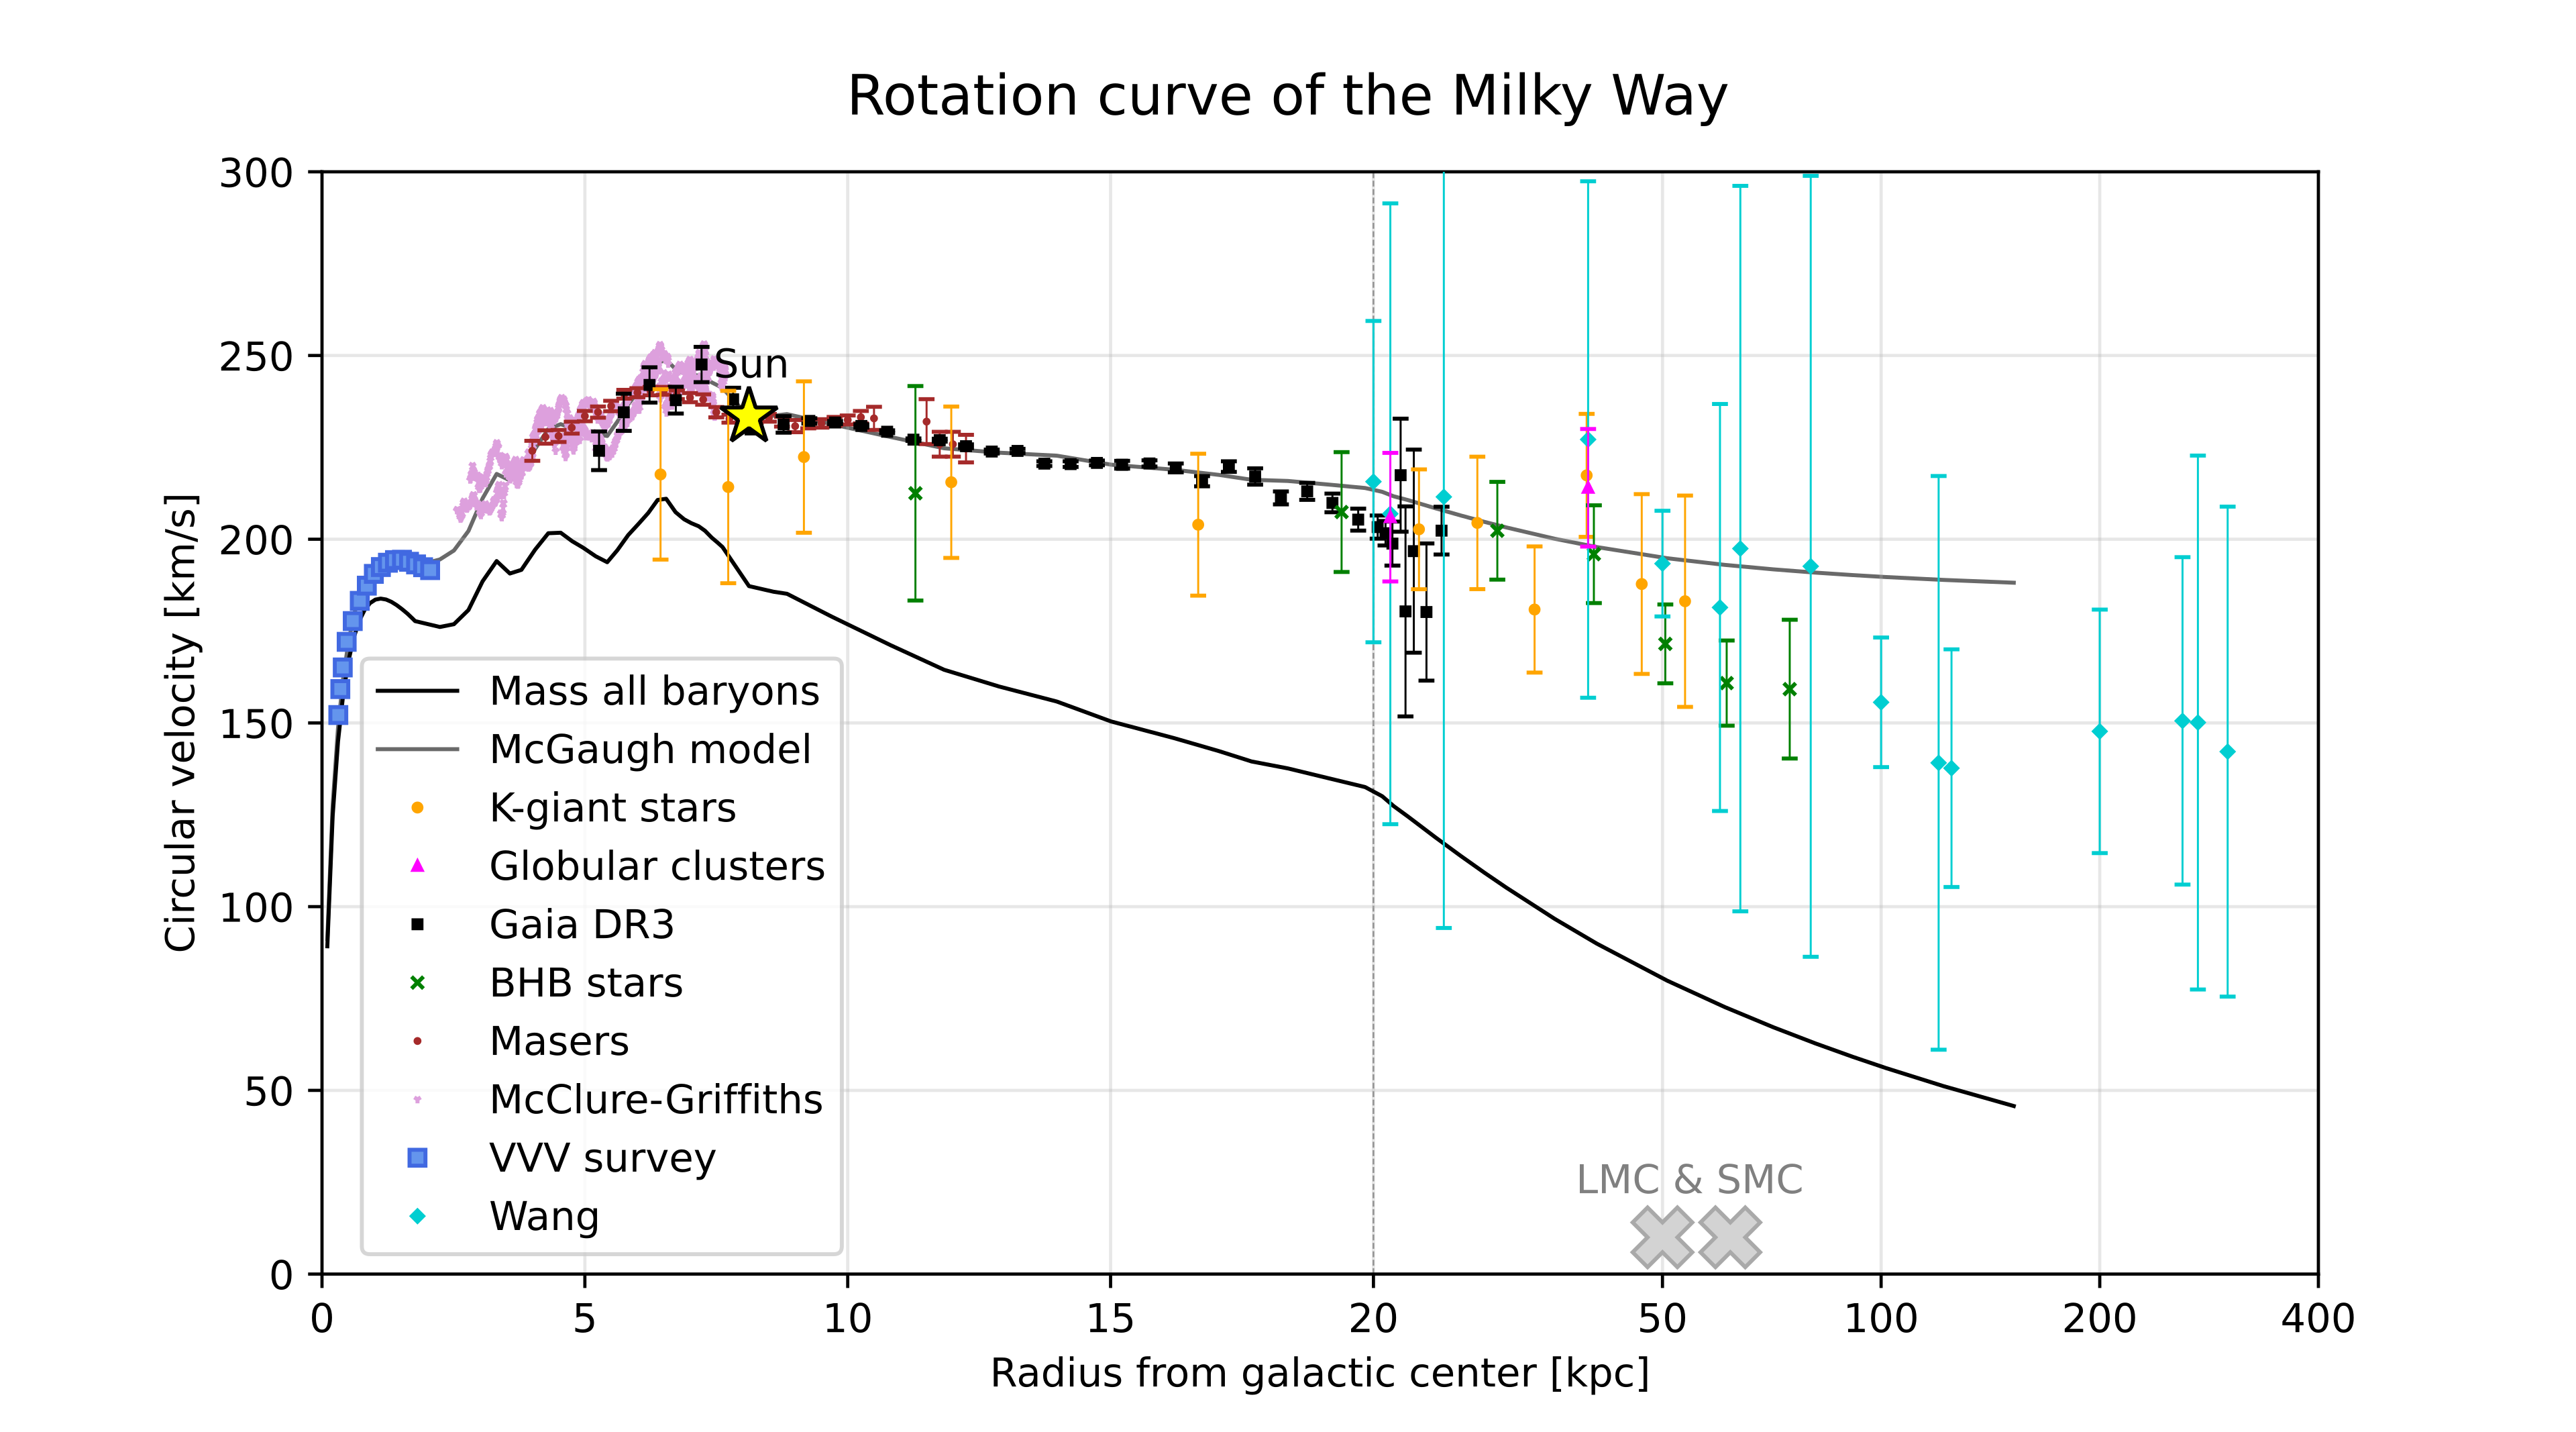
What to notice: The Milky Way’s rotation curve stays roughly flat instead of falling like a Solar-System curve. The simplest inference is that mass keeps increasing with radius even where there is little visible light.
The Milky Way’s rotation curve stays roughly flat over a large range of radius. Gas and stars far from the Galactic center orbit faster than the visible matter alone would predict. The simplest interpretation is that the enclosed mass keeps increasing with radius, even where the visible light becomes faint.
Here the word “flat” needs careful math grammar. A flat rotation curve means the speed is approximately constant:
\[ v(r) \approx \text{constant}. \]
Put that into the enclosed-mass scaling:
\[ M(<r) \propto r v^2. \]
If \(v\) is approximately constant, then \(v^2\) is also approximately constant, so
\[ M(<r) \propto r. \]
The speed curve is flat, but the enclosed-mass curve rises.

What to notice: A flat speed curve is not a flat mass curve. If orbital speed stays approximately constant while radius increases, then the enclosed mass must keep rising roughly in proportion to radius. (Credit: Course illustration (A. Rosen))
The circular-speed equation is a first-pass dynamical inference, not a full galaxy model. Real rotation-curve fits include the stellar disk, central bulge, gas, dark halo, viewing angle, and possible non-circular motions.
The robust qualitative point survives those complications: if measured orbital speeds stay high at large radius, the gravitating mass cannot be confined only to the bright inner galaxy.
External galaxies show the same pattern.
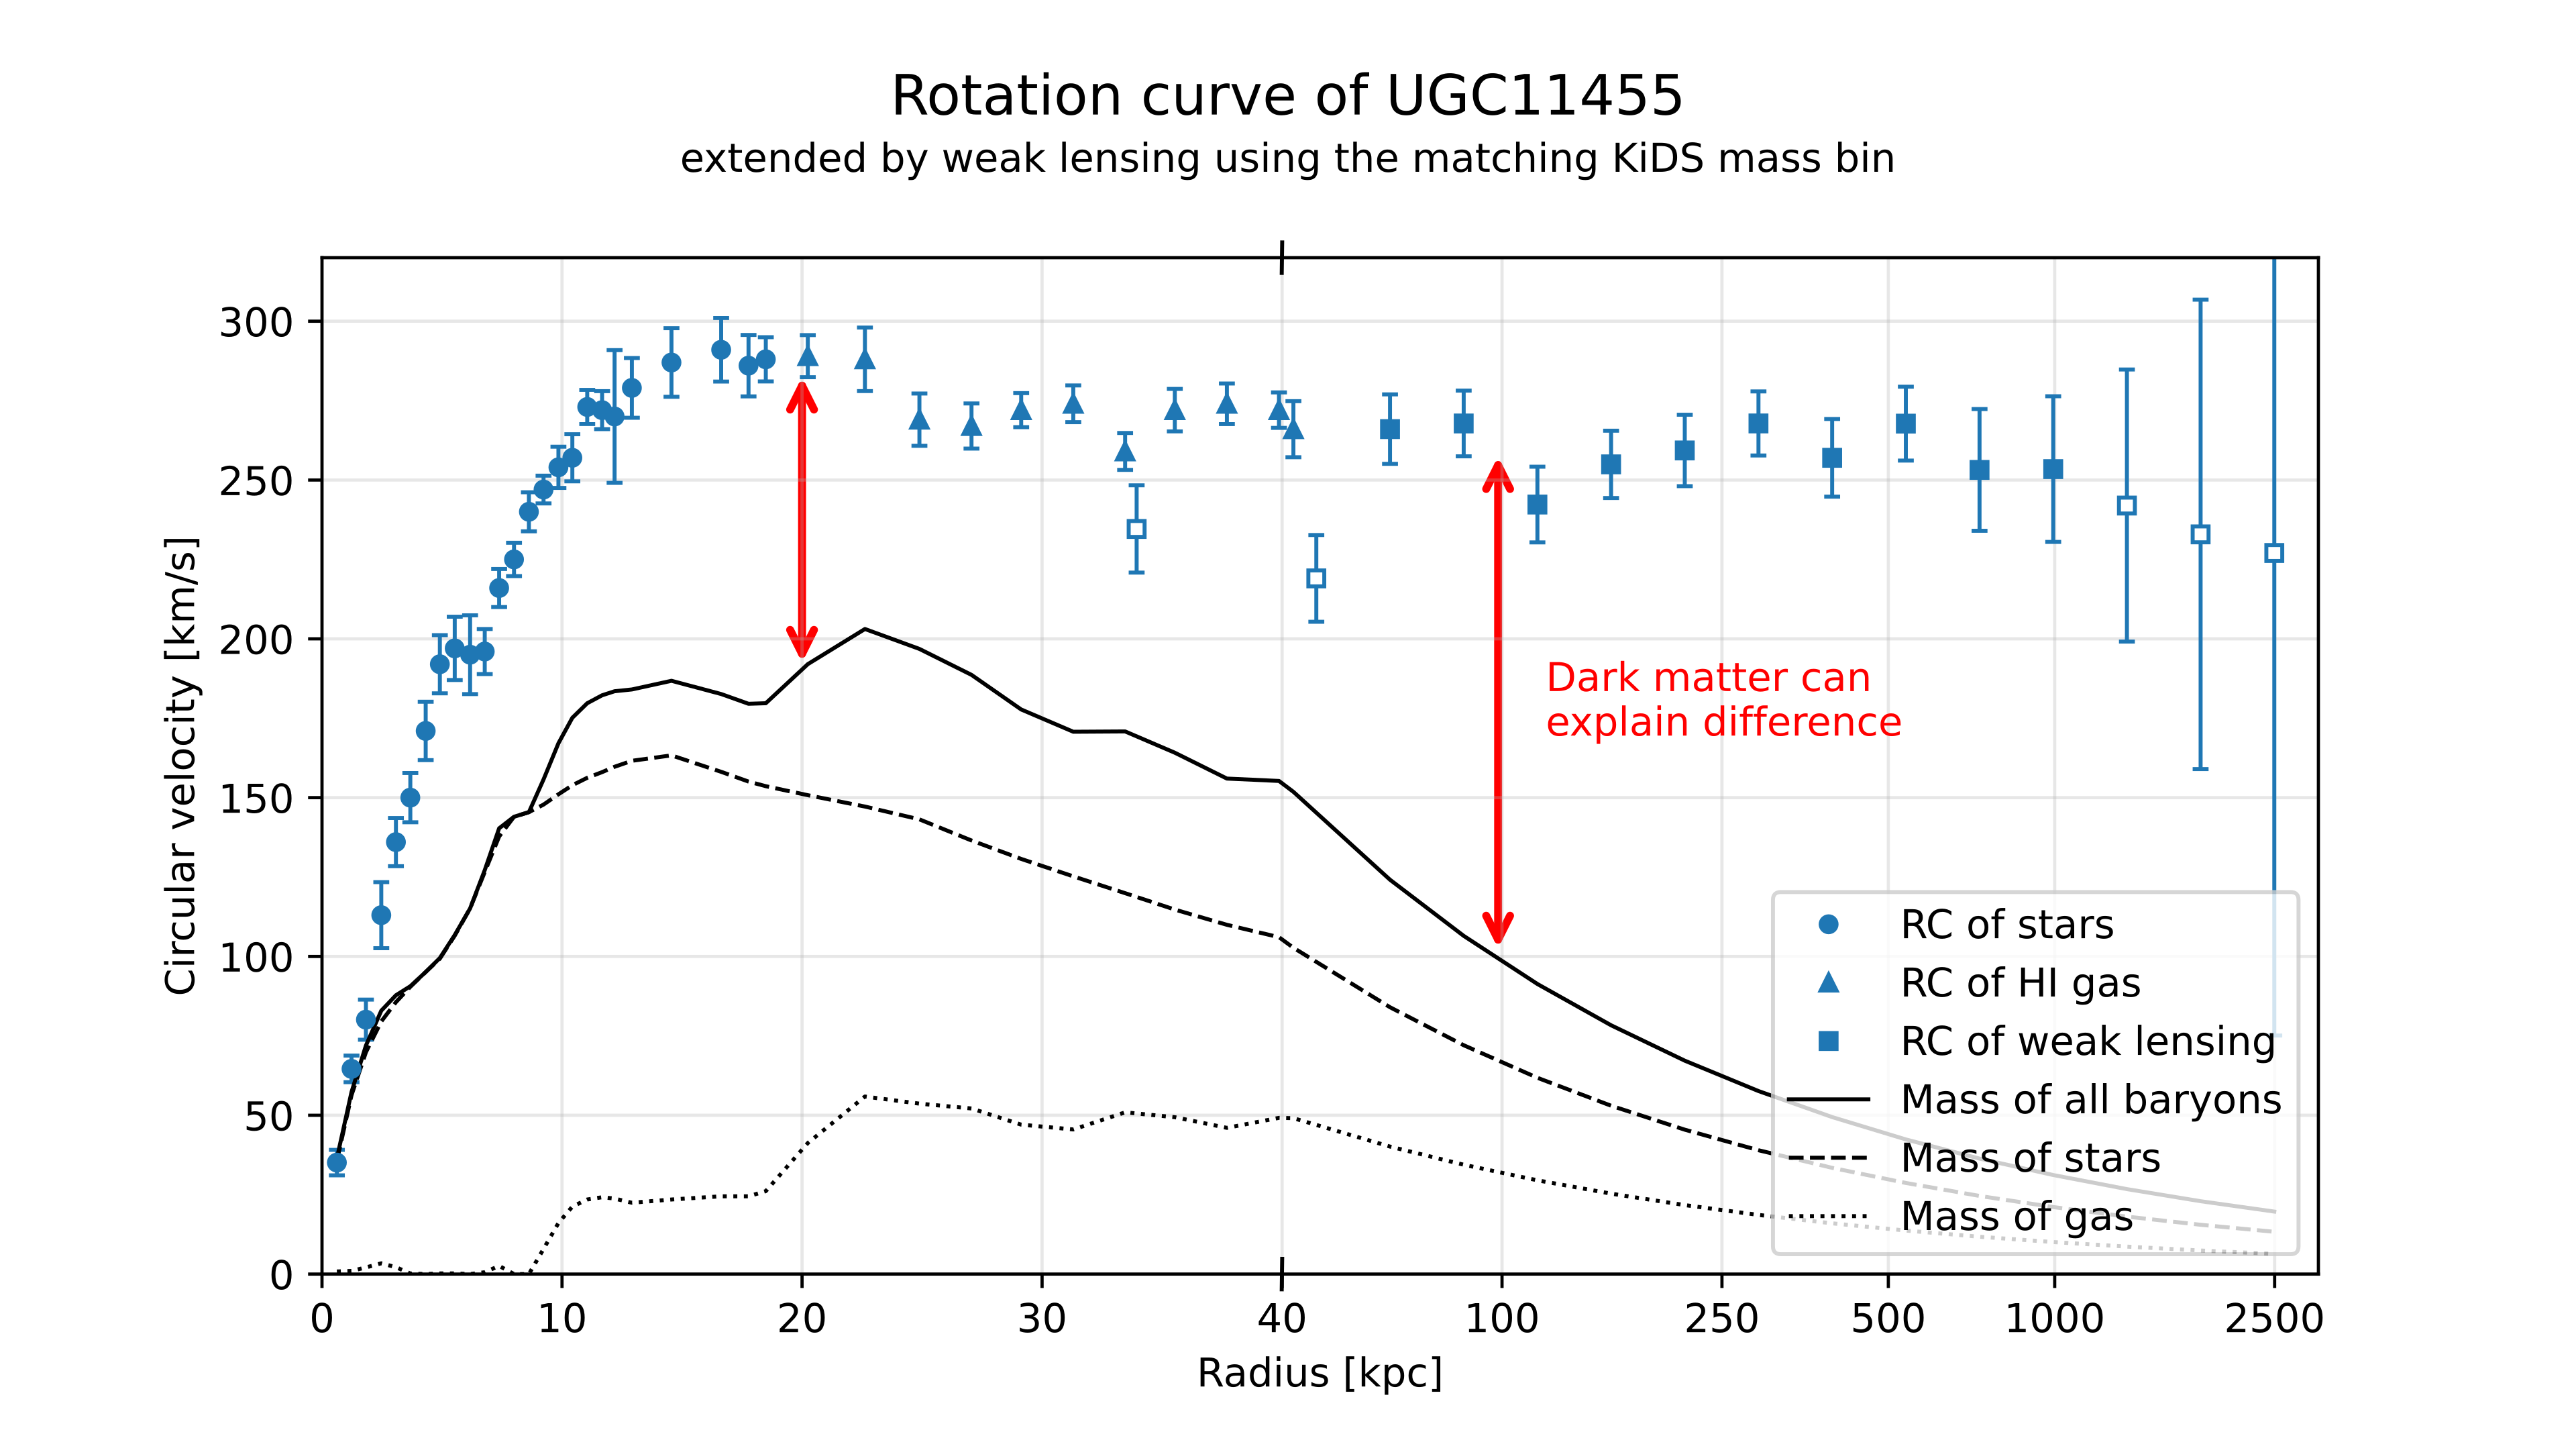
What to notice: External galaxy rotation curves show the same pattern: measured speeds remain high far from the bright disk. This makes dark matter a population-level inference, not a one-galaxy oddity.
This matters because it turns dark matter from a one-galaxy oddity into a population-level inference. If many spiral galaxies show flat rotation curves, then the problem is not that we made one bad map of the Milky Way. The pattern is telling us something general about galaxy mass distributions.
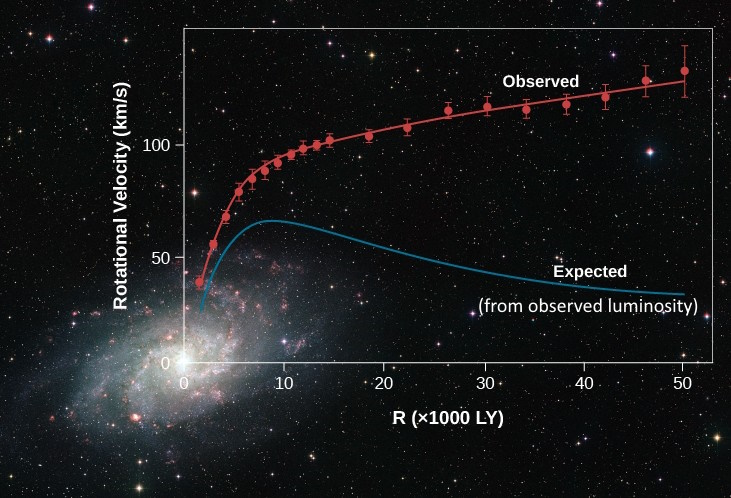
What to notice: The observed rotation curve stays flat while the curve predicted from visible matter declines. The gap is the evidence a dark matter halo is meant to explain.
The term dark matter is a name for the inferred gravitating component that does not emit, absorb, or scatter enough light for us to see directly. The word “dark” does not mean mysterious magic. It means electromagnetically dark: visible through gravity, not through ordinary light. We infer it because the gravitational model requires more mass than the luminous matter provides.
“Flat” describes the speed curve, not the mass curve. If \(v\) stays approximately constant while \(r\) increases, then
\[ M(<r) = \frac{rv^2}{G} \]
keeps increasing with radius. The surprise is not that the outer galaxy is motionless. The surprise is that objects far from the bright disk still orbit quickly, which means gravitating mass extends well beyond the light.
If a spiral galaxy has a flat rotation curve far beyond its bright stellar disk, what is the most direct inference from \(M(<r) = rv^2/G\)?
Suppose a galaxy’s rotation speed stays about constant as radius doubles. According to \(M(<r) = r v^2/G\), what happens to the enclosed mass?
If \(v\) stays constant and \(r\) doubles, then \(M(<r)\) roughly doubles. A flat rotation curve means the enclosed mass keeps growing with radius.
Part 4: Compact Engines Inside Galaxies
Supermassive black holes are not dark matter, but they are part of the dynamical story of galaxies. The Milky Way’s central black hole is relatively quiet today. In other galaxies, gas falling onto a supermassive black hole can release enormous energy before crossing the event horizon. Such a system is called an active galactic nucleus, or AGN.
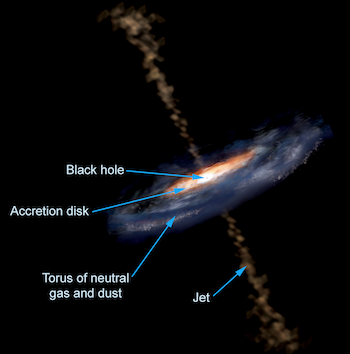
What to notice: An active galactic nucleus is powered by accretion onto a supermassive black hole. The disk, dusty torus, and jets make the same central engine look different from different viewing angles.
The engine is accretion. Gas loses gravitational potential energy as it spirals inward. Much of that energy becomes heat, radiation, and sometimes jets. The black hole itself is dark, but the material falling toward it can be among the brightest sources in the universe.
The geometry matters. A disk, dusty torus, broad-line region, and jets can look very different depending on viewing angle. That is why AGN classification can be complicated: the same underlying engine may present different observational faces.
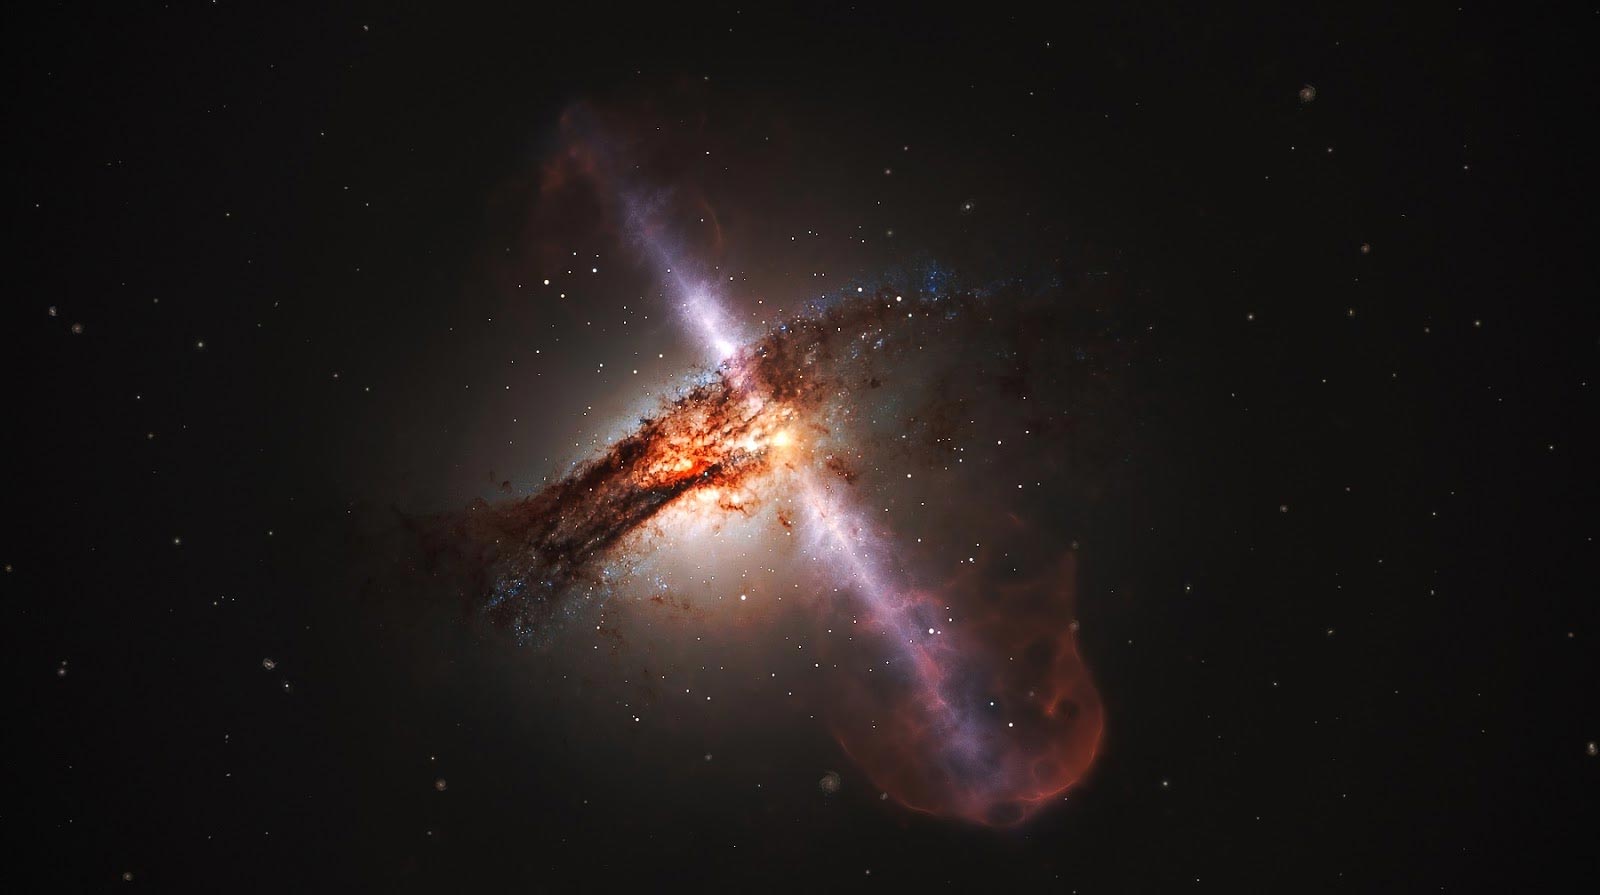
What to notice: AGN feedback is a galaxy-scale energy source. Jets and outflows show that a central black hole can affect gas far beyond the event horizon. (Credit: ESO)
AGN matter for galaxy evolution because they can inject energy into surrounding gas. A jet or outflow can heat gas, stir it, or push it out of the galaxy. This connects back to the ecosystem model from the previous reading. Stars provide feedback; supermassive black holes can provide feedback too. Both change the gas supply that future star formation depends on.
Why is an AGN not simply “a bright black hole”?
The black hole itself emits no light from inside the event horizon. The brightness comes from matter outside the horizon — especially gas in the accretion disk and sometimes jets — releasing gravitational energy as it falls inward.
Part 5: Dark Matter Beyond Spiral Galaxies
Rotation curves are powerful, but they are not the only evidence for dark matter. A different kind of test comes from galaxy clusters.
A galaxy cluster is a large gravitationally bound system containing many galaxies, a huge reservoir of hot diffuse gas, and dark matter. The galaxies are the easiest component to see in optical light, but they are not most of the cluster’s ordinary matter. Much of the ordinary matter is hot intracluster gas, which emits X-rays. The total gravitating mass can be mapped through gravitational lensing, which measures how mass bends the paths of light from background galaxies.
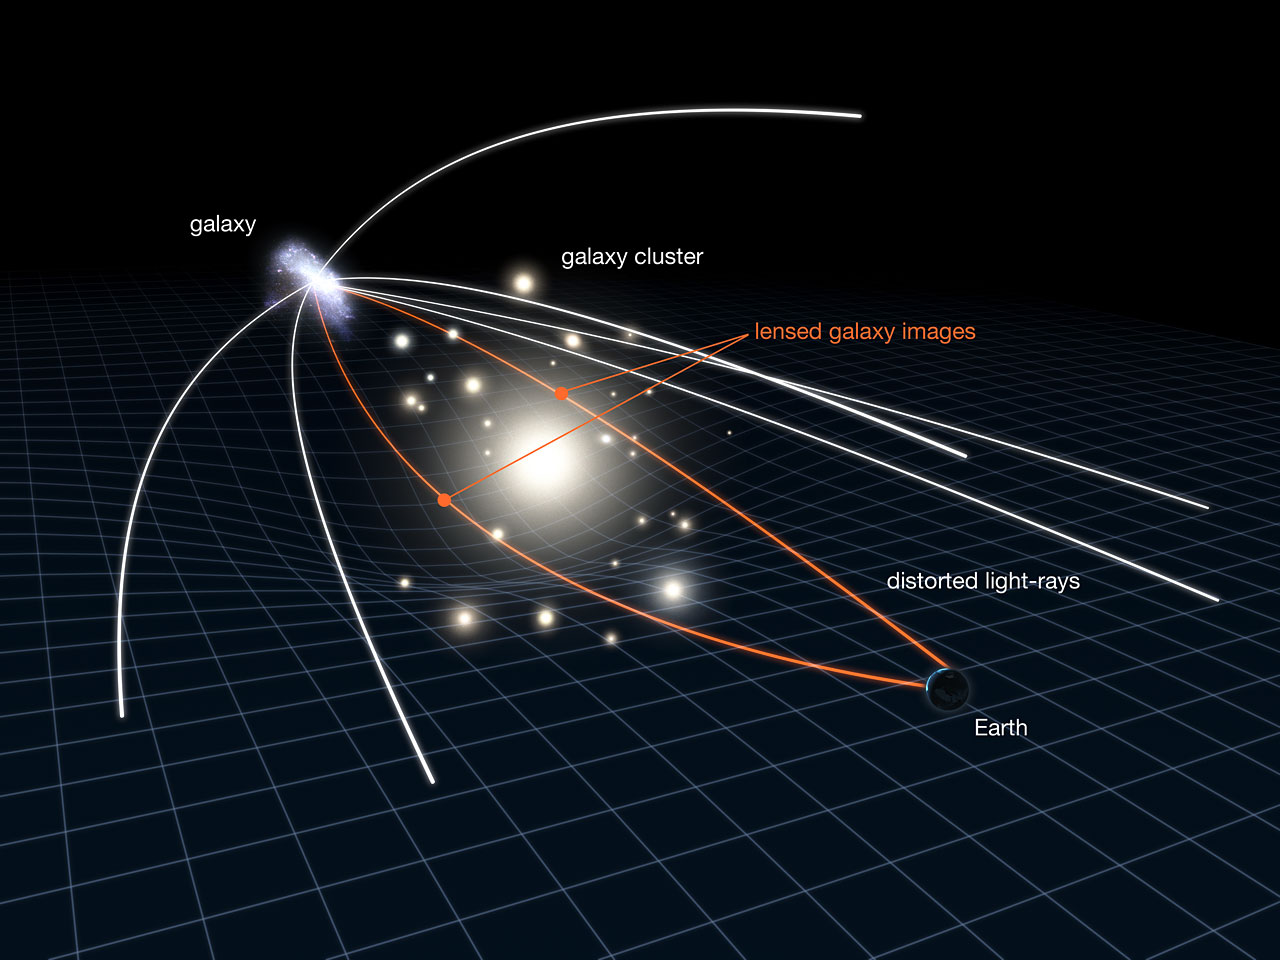
What to notice: A galaxy cluster acts like a gravitational lens. The cluster’s mass bends light from a more distant background galaxy, so one source can appear as multiple stretched or distorted images. (Credit: User-provided course asset)
Real cluster images show the same idea in a less schematic way. The cluster galaxies act together as a lens, distorting more distant background galaxies into arcs and streaks.
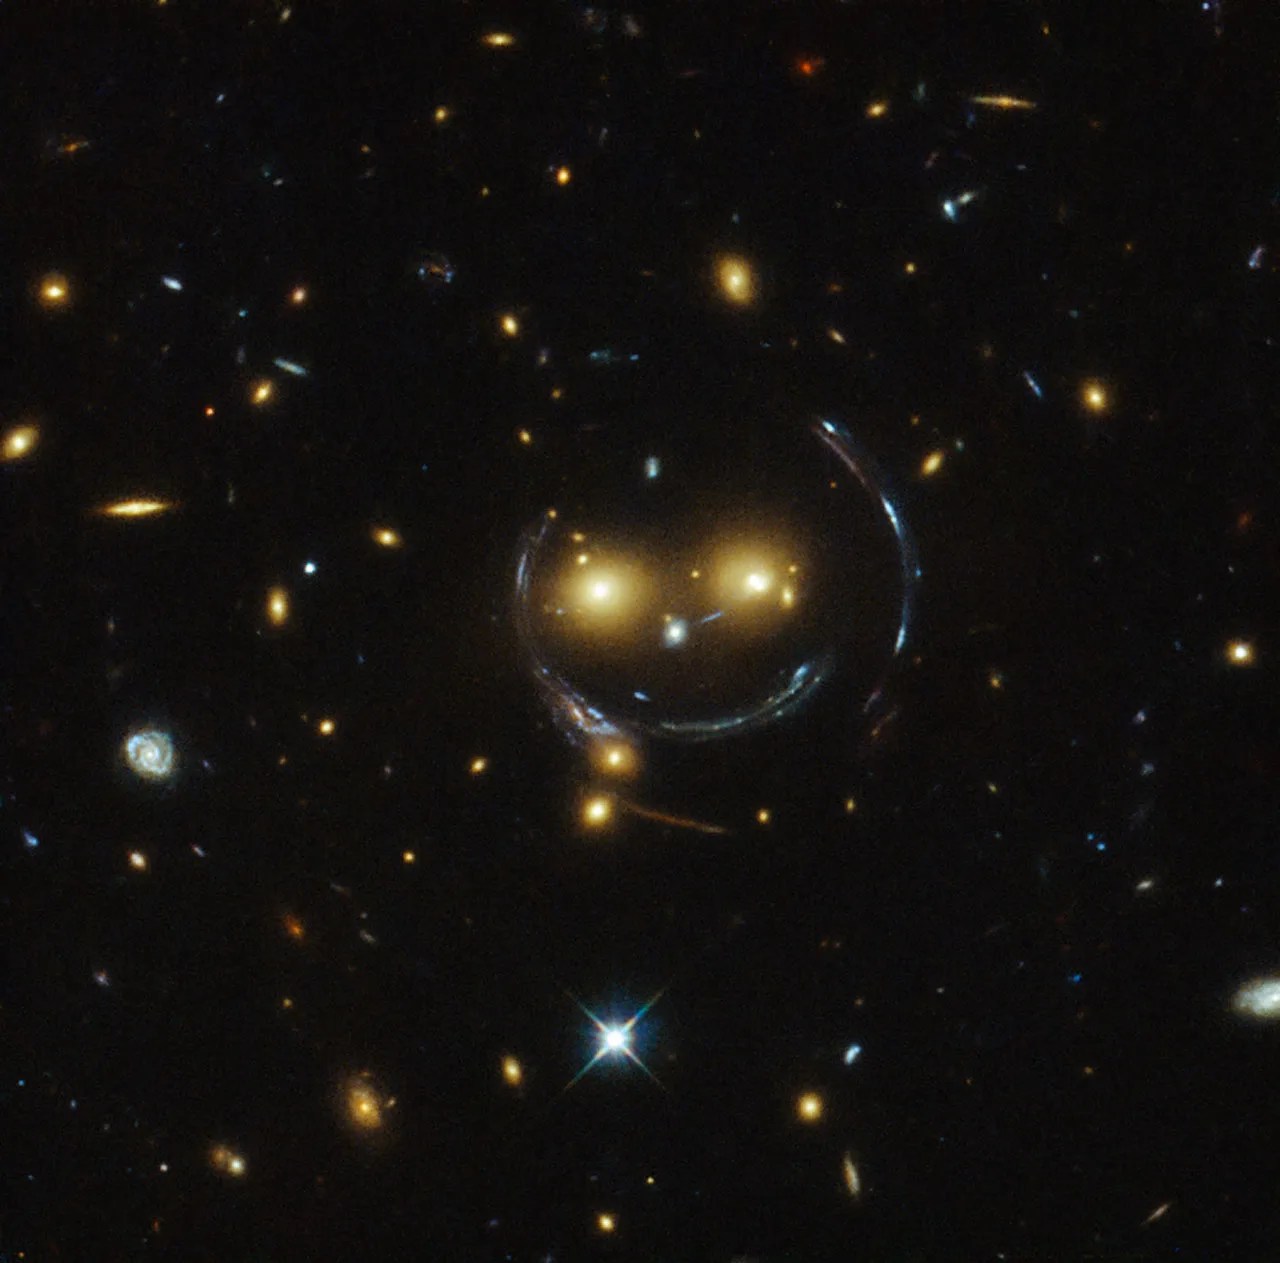
What to notice: The bright yellow galaxies belong to a foreground cluster, while the blue curved arcs are lensed images of more distant background galaxies. The arcs reveal the cluster’s total gravitating mass, including dark matter. (Credit: User-provided course asset)
The Bullet Cluster is famous because it gives a clean visual separation between components.

What to notice: The simplified schematic separates the three tracers: galaxies pass through, hot gas collides and lags, and lensing mass peaks remain offset from the gas. (Credit: Course illustration (A. Rosen))
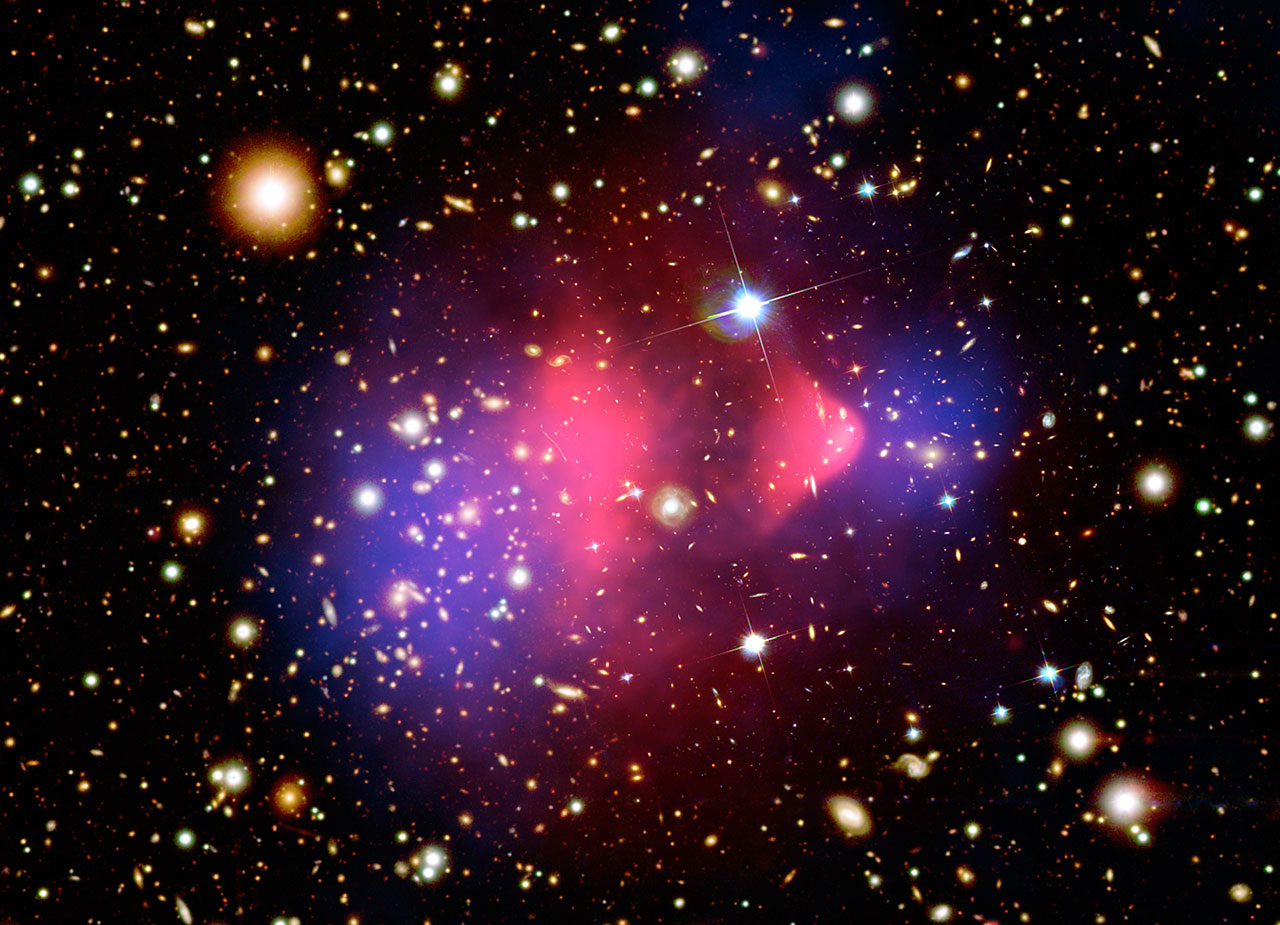
What to notice: In the Bullet Cluster, hot gas and gravitational mass are offset. The separation is powerful evidence that most of the mass is not ordinary gas. (Credit: NASA/CXC/STScI/ESO)
In a cluster collision, the galaxies mostly pass through one another because they are separated by enormous distances. The hot gas behaves differently: it collides, shocks, heats, and slows down. If most of the mass were ordinary gas, the gravitational mass map would line up with the hot gas. Instead, the lensing mass is offset from the gas and more closely associated with the collisionless components.
What to notice: Multiple observatories separate different components of the same collision: galaxies, hot gas, and gravitational mass. The model has to explain all three at once. (Credit: NASA/ESA/CSA/STScI/CXC)
This does not make every detail of dark matter simple. It does make one thing hard to avoid: gravity is responding to a mass component that is not the hot X-ray gas and not the visible stars alone. The dark matter inference survives a very different kind of observation than a rotation curve.
Rotation curves alone are not the whole dark matter argument. Any alternative model would also have to explain why gravitational lensing in cluster collisions can separate from the hot X-ray gas, why galaxies cluster into a cosmic web, and why the same gravitational framework works across many scales. This is why the evidence chain matters more than any single famous example.
Observable: galaxies, X-ray gas, and gravitational lensing peaks are spatially separated after a cluster collision.
Model: ordinary gas collides and slows; collisionless mass passes through more easily; lensing traces total mass.
Inference: most of the gravitating mass is not ordinary hot gas.
The colors in the composite image are not the evidence by themselves. The evidence comes from comparing three tracers: optical galaxies, X-ray-emitting gas, and the lensing map of total gravitating mass.
The model must explain why the collisional gas is spatially separated from the strongest lensing signal. The inference is not simply “there is something dark here.” It is that most of the gravitating mass behaves differently from ordinary hot gas during the collision.
Why does the Bullet Cluster provide a different kind of evidence than a spiral-galaxy rotation curve?
A rotation curve uses orbital speeds to infer mass inside a galaxy. The Bullet Cluster uses a collision plus gravitational lensing to compare where hot gas is located with where the total gravitating mass is located. It tests dark matter with a different observable and a different physical setup.
Part 6: Gravity Builds the Large-Scale Universe
The final scale in this reading is larger than a galaxy or a cluster. Redshift surveys map the positions of huge numbers of galaxies in three dimensions. When we do this, galaxies do not appear randomly sprinkled through space. They form the cosmic web: a large-scale network of filaments, walls, clusters, and voids.
The phrase large-scale structure refers to this pattern of matter on scales much larger than individual galaxies. Galaxies and clusters collect along filaments and walls, while large underdense regions become voids. The cosmic web is therefore not just a beautiful map. It is evidence that gravity has amplified small early density differences into the structure we observe today.

What to notice: Large-scale structure is hierarchical. Galaxies sit inside groups and clusters, clusters connect along filaments, and filaments surround large voids in the cosmic web. (Credit: Course illustration (A. Rosen))
What to notice: Galaxies are not sprinkled randomly. Redshift surveys reveal filaments, walls, clusters, and voids: the cosmic web built by gravity. (Credit: DESI Collaboration/NOIRLab/NSF/AURA)
This is gravity at work on the largest observable scales. Slightly denser regions pull in matter. Under gravity, structure grows. Dark matter matters here because it begins forming gravitational scaffolding before ordinary gas can cool and form luminous galaxies. Galaxies trace the web, but they are not the whole web.
This prepares us for the next reading. Cosmology is not only the story of expansion. It is the story of expansion plus gravity. Expansion stretches distances on large scales. Gravity pulls matter together into structure. The universe we observe is the result of both.
Why is the cosmic web evidence for gravity acting over cosmic time, rather than just a map of where galaxies happen to be today?
The web is a large-scale pattern of clusters, filaments, walls, and voids. Such structure is modeled as growth from small density differences under gravity. Galaxies trace that structure today, but the pattern records the history of gravitational growth.
Worked Example: Weighing a Galaxy
Suppose gas orbits in a galaxy at radius
\[ r = 20 \ \text{kpc} \]
with orbital speed
\[ v = 220 \ \text{km s}^{-1}. \]
Estimate the enclosed mass using
\[ M(<r) = \frac{r v^2}{G}. \]
Use CGS units:
\[ 1 \ \text{kpc} = 3.086 \times 10^{21} \ \text{cm}, \]
\[ 1 \ \text{km s}^{-1} = 10^5 \ \text{cm s}^{-1}, \]
\[ G = 6.674 \times 10^{-8} \ \text{cm}^3 \ \text{g}^{-1} \ \text{s}^{-2}, \]
and
\[ M_\odot = 2.0 \times 10^{33} \ \text{g}. \]
First convert the radius:
\[ r = 20 \ \text{kpc} \left( \frac{3.086 \times 10^{21} \ \text{cm}}{1 \ \text{kpc}} \right) = 6.172 \times 10^{22} \ \text{cm}. \]
Now convert the speed:
\[ v = 220 \ \text{km s}^{-1} \left( \frac{10^5 \ \text{cm s}^{-1}}{1 \ \text{km s}^{-1}} \right) = 2.20 \times 10^7 \ \text{cm s}^{-1}. \]
Square the speed:
\[ v^2 = \left(2.20 \times 10^7 \ \text{cm s}^{-1}\right)^2 = 4.84 \times 10^{14} \ \text{cm}^2 \ \text{s}^{-2}. \]
Now substitute:
\[ M(<r) = \frac{ \left(6.172 \times 10^{22} \ \text{cm}\right) \left(4.84 \times 10^{14} \ \text{cm}^2 \ \text{s}^{-2}\right) } {6.674 \times 10^{-8} \ \text{cm}^3 \ \text{g}^{-1} \ \text{s}^{-2}}. \]
The numerator is
\[ 2.99 \times 10^{37} \ \text{cm}^3 \ \text{s}^{-2}. \]
Therefore,
\[ M(<r) \approx 4.48 \times 10^{44} \ \text{g}. \]
Convert to solar masses:
\[ M(<r) = 4.48 \times 10^{44} \ \text{g} \left( \frac{1 M_\odot}{2.0 \times 10^{33} \ \text{g}} \right) \approx 2.2 \times 10^{11} M_\odot. \]
So the enclosed mass is
\[ \boxed{M(<20 \ \text{kpc}) \approx 2.2 \times 10^{11} M_\odot}. \]
This is a dynamical mass: the amount of gravitating matter required to produce the measured motion under the model assumptions. It is not automatically the mass in stars. To separate stars, gas, black holes, and dark matter, astronomers compare the dynamical mass to the mass traced by light, gas emission, and other observables.
Synthesis: One Pattern, Many Scales
The dark-matter argument is strong because it is not balanced on one observation. Galaxy rotation curves infer extended mass from orbital speeds. Cluster collisions compare X-ray gas to gravitational lensing maps. The cosmic web tests whether gravity can grow the observed pattern of filaments, clusters, and voids over cosmic time.
Those are different observables and different models, but they point toward the same broad conclusion: visible matter is not the whole gravitating matter budget.
Dark matter is a convergent inference. It is built from multiple gravitational measurements, not from a single rotation curve or a single famous image.
Practice Problems
Use these values and ideas unless a problem states otherwise:
- \(G = 6.674 \times 10^{-8}\,\mathrm{cm^3\,g^{-1}\,s^{-2}}\)
- \(M_\odot = 2.0 \times 10^{33}\,\mathrm{g}\)
- \(1\,\mathrm{kpc} = 3.086 \times 10^{21}\,\mathrm{cm}\)
- \(1\,\mathrm{km\,s^{-1}} = 10^5\,\mathrm{cm\,s^{-1}}\)
- For circular motion, \(M(<r) = rv^2/G\).
Conceptual
- ⭐ Motion as a mass measurement.
- What is directly observed when astronomers track S-stars near the Galactic center?
- What model turns that observation into a mass estimate?
- What inference does the compactness of the mass support?
- ⭐ Flat does not mean empty. A student says, “If a galaxy’s rotation curve is flat, then the enclosed mass must be flat too.”
- Use the enclosed-mass equation to explain the mistake.
- If \(v\) stays constant while \(r\) increases, what must happen to \(M(<r)\)?
- Why does this point toward an extended halo?
- ⭐⭐ Dark matter is an inference, not a photograph. Explain why dark matter is inferred from gravity rather than imaged directly in ordinary light.
Calculation
- ⭐⭐ Weighing a galaxy from a rotation speed. Gas orbits a galaxy at radius \(r = 10\,\mathrm{kpc}\) with speed \(v = 200\,\mathrm{km\,s^{-1}}\).
- Convert \(r\) to centimeters and \(v\) to \(\mathrm{cm\,s^{-1}}\).
- Use \(M(<r) = rv^2/G\) to estimate the enclosed mass in grams.
- Convert your answer to solar masses.
- State one simplifying assumption in this calculation.
- ⭐ Doubling the radius. A galaxy has a flat rotation curve with \(v = 220\,\mathrm{km\,s^{-1}}\) from \(r = 8\,\mathrm{kpc}\) to \(r = 16\,\mathrm{kpc}\).
- Without plugging in constants, by what factor does \(M(<r)\) increase?
- Why is this different from a Solar-System-like mass distribution?
- What does this imply about mass outside the bright inner galaxy?
- ⭐⭐ A compact central mass. A star orbits near a galactic center at radius \(r = 1.5 \times 10^{16}\,\mathrm{cm}\) with speed \(v = 4.0 \times 10^8\,\mathrm{cm\,s^{-1}}\).
- Estimate the enclosed mass using \(M(<r) = rv^2/G\).
- Convert the mass to \(M_\odot\).
- Explain why packing that much mass into a small region supports the black-hole interpretation.
Synthesis
- ⭐⭐ Many routes to dark matter. Build two observe → model → infer chains for dark matter using two different kinds of evidence: rotation curves, the Bullet Cluster, gravitational lensing, or the cosmic web.
- ⭐⭐ AGN feedback in the ecosystem model. Explain how a supermassive black hole can affect future star formation even though the black hole itself does not shine.
- ⭐⭐⭐ The Bullet Cluster as a stress test. In one paragraph, explain why the Bullet Cluster is not just “another dark matter example.” Your answer should mention hot gas, lensing, collisionless matter, and why the spatial separation matters.
Glossary
Active galactic nucleus (AGN): A luminous galactic center powered by accretion onto a supermassive black hole.
Bullet Cluster: A colliding galaxy-cluster system where hot X-ray gas and gravitational lensing mass are spatially separated.
Cosmic web: The large-scale network of filaments, walls, clusters, and voids traced by galaxies and shaped by gravity.
Dark matter: A gravitating component inferred from motion, lensing, and structure formation that does not emit, absorb, or scatter enough light to be seen directly.
Enclosed mass (\(M(<r)\)): The amount of mass inside radius \(r\), inferred from orbital motion or other gravitational effects.
Flat rotation curve: A galaxy rotation curve in which orbital speed stays roughly constant with radius.
Galaxy cluster: A gravitationally bound system of many galaxies, hot X-ray-emitting intracluster gas, and dark matter.
Gravitational lensing: Bending of light by mass, used to map total gravitating matter whether or not it emits light.
Large-scale structure: The distribution of matter on scales larger than individual galaxies, including galaxy groups, clusters, filaments, walls, and voids.
Local Group: The gravitationally bound galaxy group containing the Milky Way, Andromeda, Triangulum, and many dwarf galaxies.
Rotation curve: A plot of orbital speed versus distance from the center of a galaxy.
Supermassive black hole: A black hole with millions to billions of solar masses, commonly found in galactic centers.
Summary
Motion is a mass measurement. S-star orbits reveal the compact mass at the Milky Way’s center. Galaxy rotation curves reveal mass extending far beyond the bright stellar disk. Cluster collisions separate hot gas from gravitational mass. Redshift surveys show a cosmic web shaped by gravity over billions of years. Across all these scales, the method is the same: observe motion or lensing, model with gravity, infer the mass distribution.
In one paragraph, explain why dark matter is not inferred from one observation alone. Your answer should mention at least two of the following: galaxy rotation curves, the Bullet Cluster, gravitational lensing, and the cosmic web.